2019 PHP Monitoring Options
 Matthew Chigira
on
July 02, 2019
Matthew Chigira
on
July 02, 2019
There is no denying the popularity of PHP. It has been a constant force in the web development world since its release way back in 1995. And now in 2019, thanks to Laravel, it is still going as strong as ever! Here at Scout, recently we have been working hard on providing a PHP performance monitoring agent to sit alongside our existing ruby, python and elixir agents. Prior to us releasing this PHP agent, we took a look at the PHP ecosystem to see how Scout can complement the existing monitoring landscape.
Are you interested in trying out our new PHP agent? If so then sign up for a free 14-day trial today (no credit card required)!
Categorizing Monitoring Tools
There are many different ways to address the challenge of how to successfully monitor your PHP applications. You can approach this task from a multitude of different perspectives, depending on what it is you want to see. But we can roughly divide these approaches into two broad categories: blackbox monitoring and whitebox monitoring.
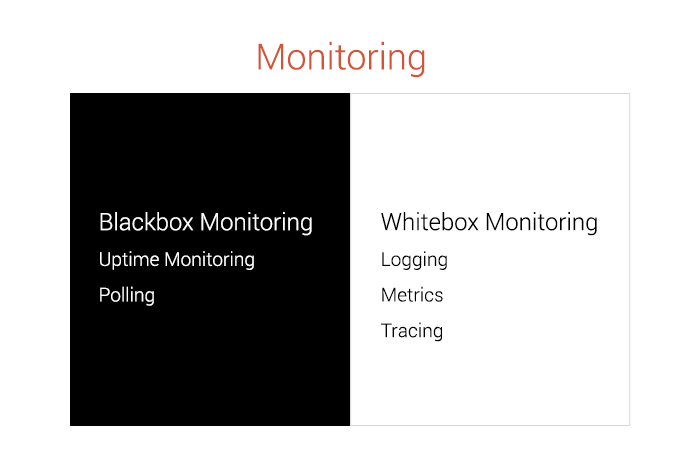
Blackbox monitoring is concerned with monitoring a system from the outside; from a user-oriented perspective if you will. It is called blackbox because this type of monitoring has no information about the underlying system, just what is exposed to the user on the outside. Examples of blackbox monitoring include uptime monitoring or polling.
In contrast to this approach, whitebox monitoring describes approaches that aim to monitor a system from the inside, with privileged information. This can be achieved with logging, metrics and tracing etc. Typically these approaches come with an overhead but they allow us to glimpse inside a system, to the heart of the problem.
Let’s take a closer look at the four most popular monitoring techniques in the PHP ecosystem: uptime monitoring, logging, metrics and tracing.
1. Uptime Monitoring
Perhaps the simplest type of monitoring that we can do is uptime monitoring. This blackbox approach allows us to monitor the uptime of our websites and to receive alerts the instant a disruption occurs. Some of the most popular uptime monitoring services around in 2019 are Pingdom, UptimeRobot and Site24x7.
Uptime monitoring services are very useful and you can think of them as being on the frontline, so to speak. In this sense, they will alert you that a problem occurred, but in order to diagnose that problem, you will probably need a different type of monitoring solution which provides more specific information.
2. Logging
For more information, the next logical step from uptime monitoring, is logging. As developers we are constantly logging information in our applications, either directly or indirectly by the framework we are using. These logs report everything from routine status information to exceptions and error reports. This means that when something does go wrong, there is a wealth of privileged information available with which we can investigate. As we mentioned earlier, this is known as whitebox monitoring.
Logging to files works fine initially, but as your application grows, the need for a log monitoring service becomes apparent. For example, when an error occurs in your live system, you want to be notified about that and then immediately be able to see the stack trace so that the debugging process can start right away.
There are many great services in the PHP space for this task, here are some of our favourites:
- Rollbar (integrates with Scout)
- Sentry (integrates with Scout)
- Bugsnag (integrates with Scout)
- Honeybadger (integrates with Scout)
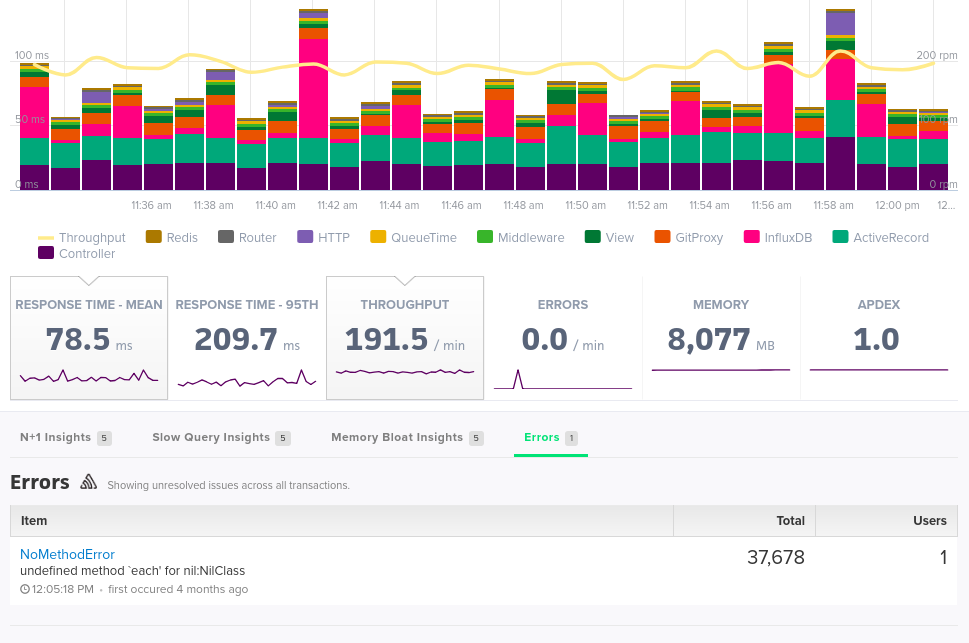
Error logging systems have another great advantage in that they can also be integrated very easily into APMs like Scout for more savvy, efficient monitoring. In the image below, you can see how the errors logged from Sentry show up on the main overpage of Scout in a handy list.
3. Metrics
Logging can be really great for reporting detailed information, which can be easily filtered and used for diagnosing problems. But what about if you need a higher-level of information? In other words, what if you need to zoom out and see the bigger picture of your system’s performance? That’s where metrics come in.
Metrics are a measurement of some variable over a period of time (called a time series), rather than a single snapshot of an occurrence like a log. Metrics complement logs, and when used together they offer a powerful monitoring solution. Three of the most popular services that we hear about often are:
Hosted Graphite is an alternative to ‘standard Graphite’ (shown below), and it’s a service that we’ve heard some great things about recently, as it seems to be gaining a lot of popularity.
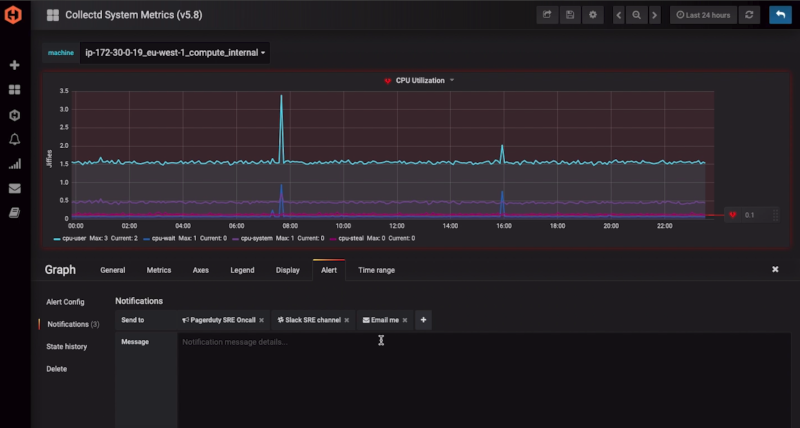
These solutions are often paired together and visualized in tools like Grafana. If you are interested in learning more about Prometheus and Grafana, then checkout Erik’s fantastic blog post about how to set up Prometheus with Grafana inside a Docker container.
4. Tracing
So far we have talked about various types of monitoring solutions which allow you to be notified if a service is down, present error logs for diagnosing problems, and show you useful charts about your system’s performance. But how about the scenario where there is no error in your system, the services are all up and running, but you are getting indications that the performance of your application in certain areas is not as you had hoped. That’s where the final piece of the monitoring puzzle comes in, tracing.
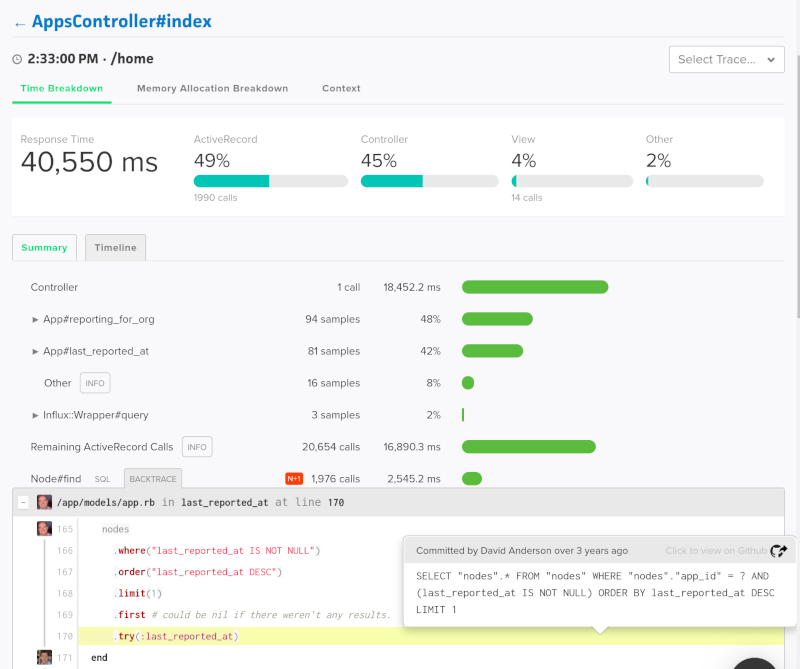
Tracing allows you to see a complete picture of the lifecycle of a single PHP Laravel request from start to finish. Enabling you to see how much memory is being used at each layer of the request, and exactly where time is being spent. These traces can then be aggregated together to form part of a high-level metric which allows you to view the performance and health of individual endpoints in your system. This powerful snapshot of an application's performance over time is the job of an Application Performance Monitoring tool, or APM, such as Scout.
What’s next?
PHP developers rejoice! It’s no longer just the Ruby, Python and Elixir developers who get to have all the fun, you too can now use your favourite Application Performance Monitoring (APM) tool, Scout, to monitor your PHP and Laravel applications! (Click on Doggo for some free swag!)

If you are interested in using Scout to monitor your PHP and Laravel applications, then click here to sign up for a free 14-day trial (no credit card required). We would also love to hear from you if you have any suggestions for improvements.