From a spike in response time to a Git blame: our improved path to slow code
Before Scout, we used several app monitoring services.
One of my biggest frustrations: I never found a way to select a spike in response time from an overview chart and view what's slow during that period.
Those spikes are begging to be clicked. We wanted to make that happen.
Introducing click-and-drag
See a spike in response time for your app? Just click-and-drag over the chart. Scout will show how many slow requests occured. You can then jump to a list of all slow requests aggregated by the endpoint.
Using an iPad? Pinch the spike. It's fun.
Git Integration
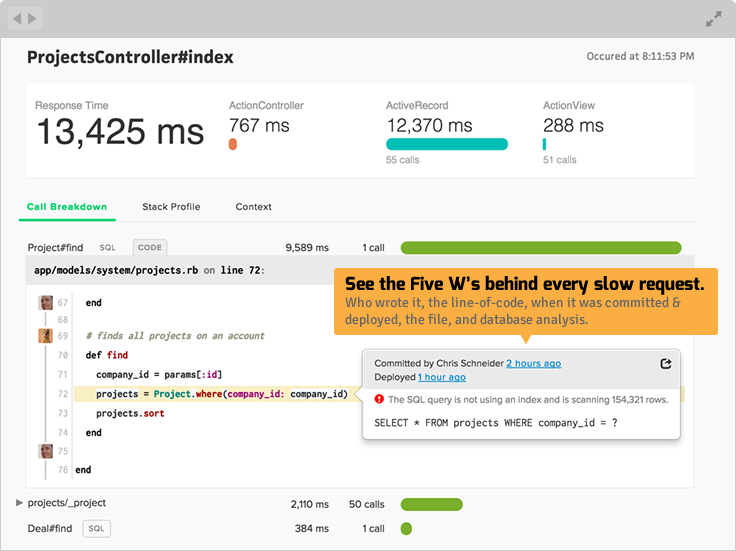
We'll be releasing our Git integration before General Availability on Nov 16th. Watch the video above for a preview of this in action.
Pricing
You can pick between per-server pricing ($59/server) and pre-request pricing (starting at $20 for the first 1M requests with automatic volume discounts).
Early Access
Signup for early access via our homepage.
Questions? Email sales@scoutapm.com.


