Meet Scout's new transaction timeline view
 Derek Haynes
on
June 25, 2019
Derek Haynes
on
June 25, 2019
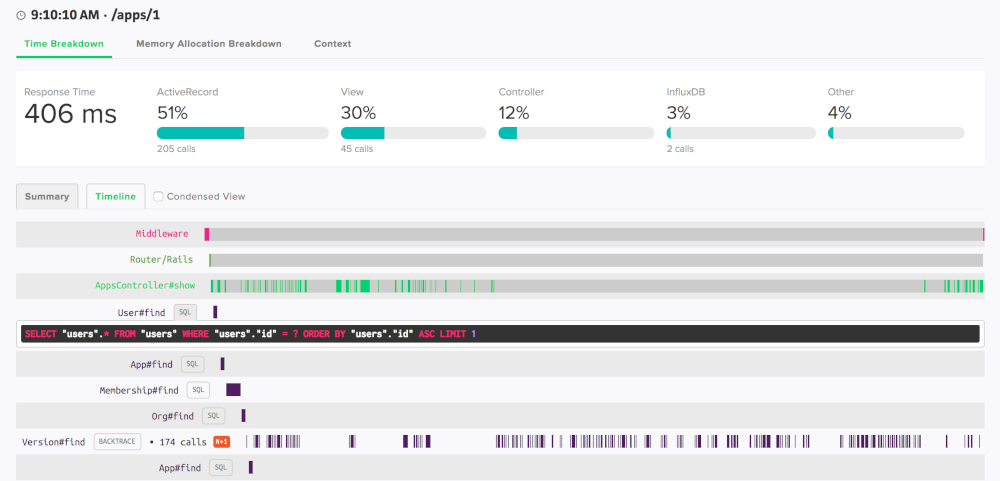
Today we're happy to announce that our transaction timeline view has exited BETA and is now generally available for Ruby.
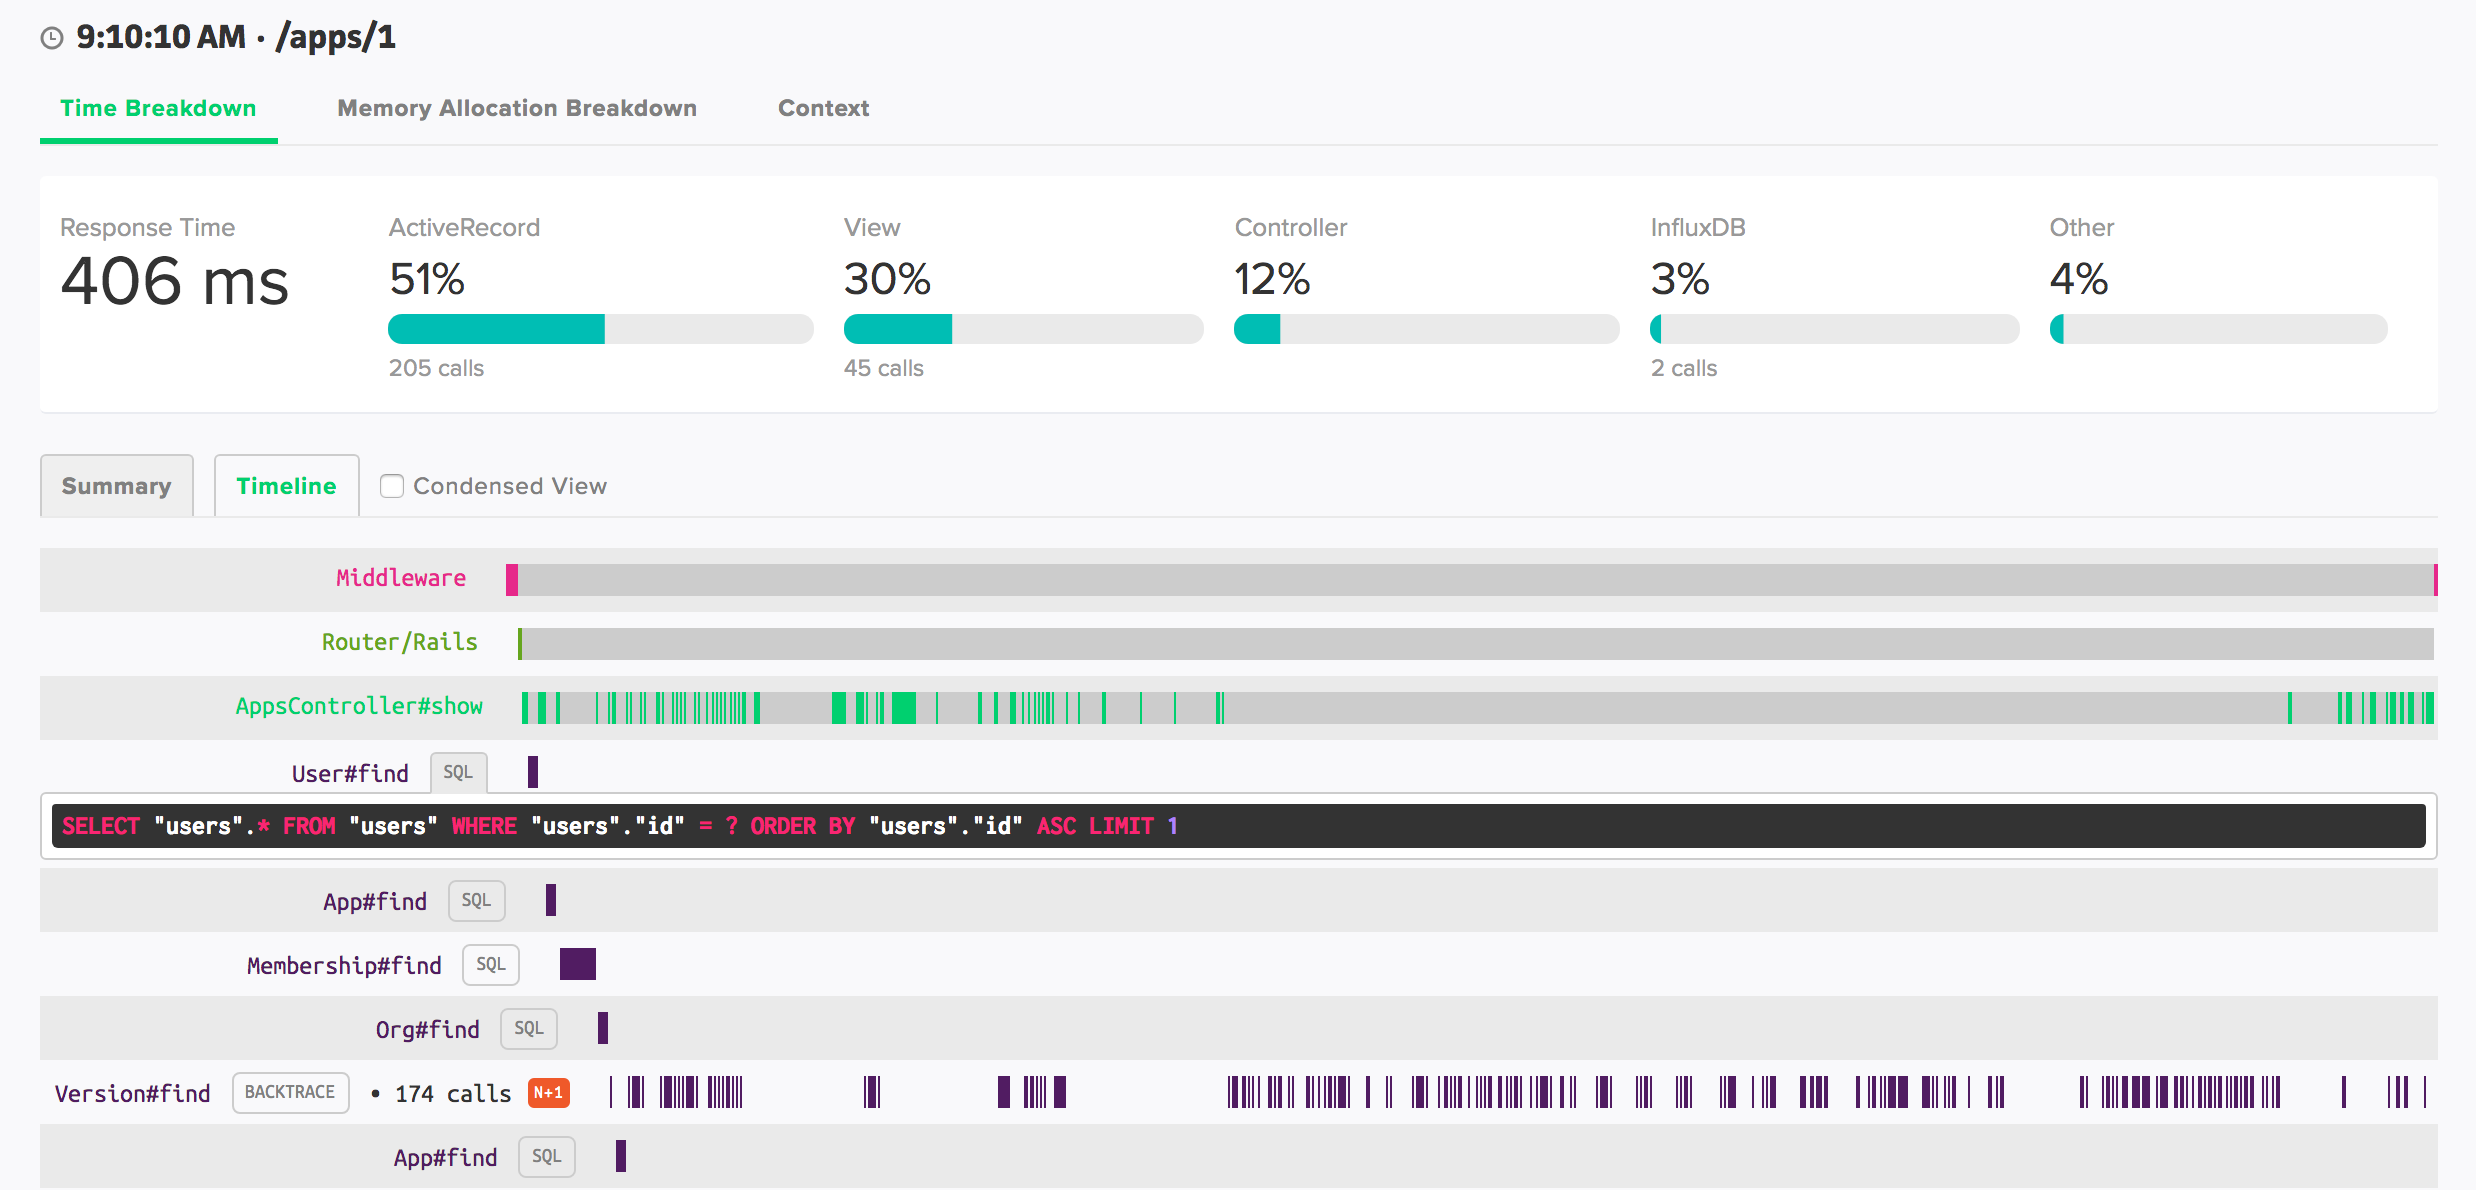
The timeline view compliments the existing view (renamed to "summary") used by our transaction traces, giving you insights into the execution order of your code.
The timeline view is especially helpful for:
- understanding the distribution of
Controllertime across a request. Is there a lot of time spent in your custom code at the beginning of a request? Is it spread out? Is it at the end of a request? - understanding the timing of distinct SQL queries. Is one instance of many nearly identical queries slow or all of them?
- getting the complete picture of parent and children method calls. How many SQL calls are being triggered by the same view partial?
When you upgrade to our latest Ruby agent, you'll be able to toggle back-and-forth between both views.
To start, the timeline view is available for Ruby. We're working on support for the rest of our languages. You can view a list of current limitations in our docs.
If you'd like to reach out when the timeline view supports your language, just email support@scoutapp.com.