Your Rails & Elixir performance metrics 📈 inside Chrome Dev Tools
Browser development tools -- like Chrome Dev Tools - are vital for debugging client-side performance issues. However, server-side performance metrics have been outside the browser's reach.
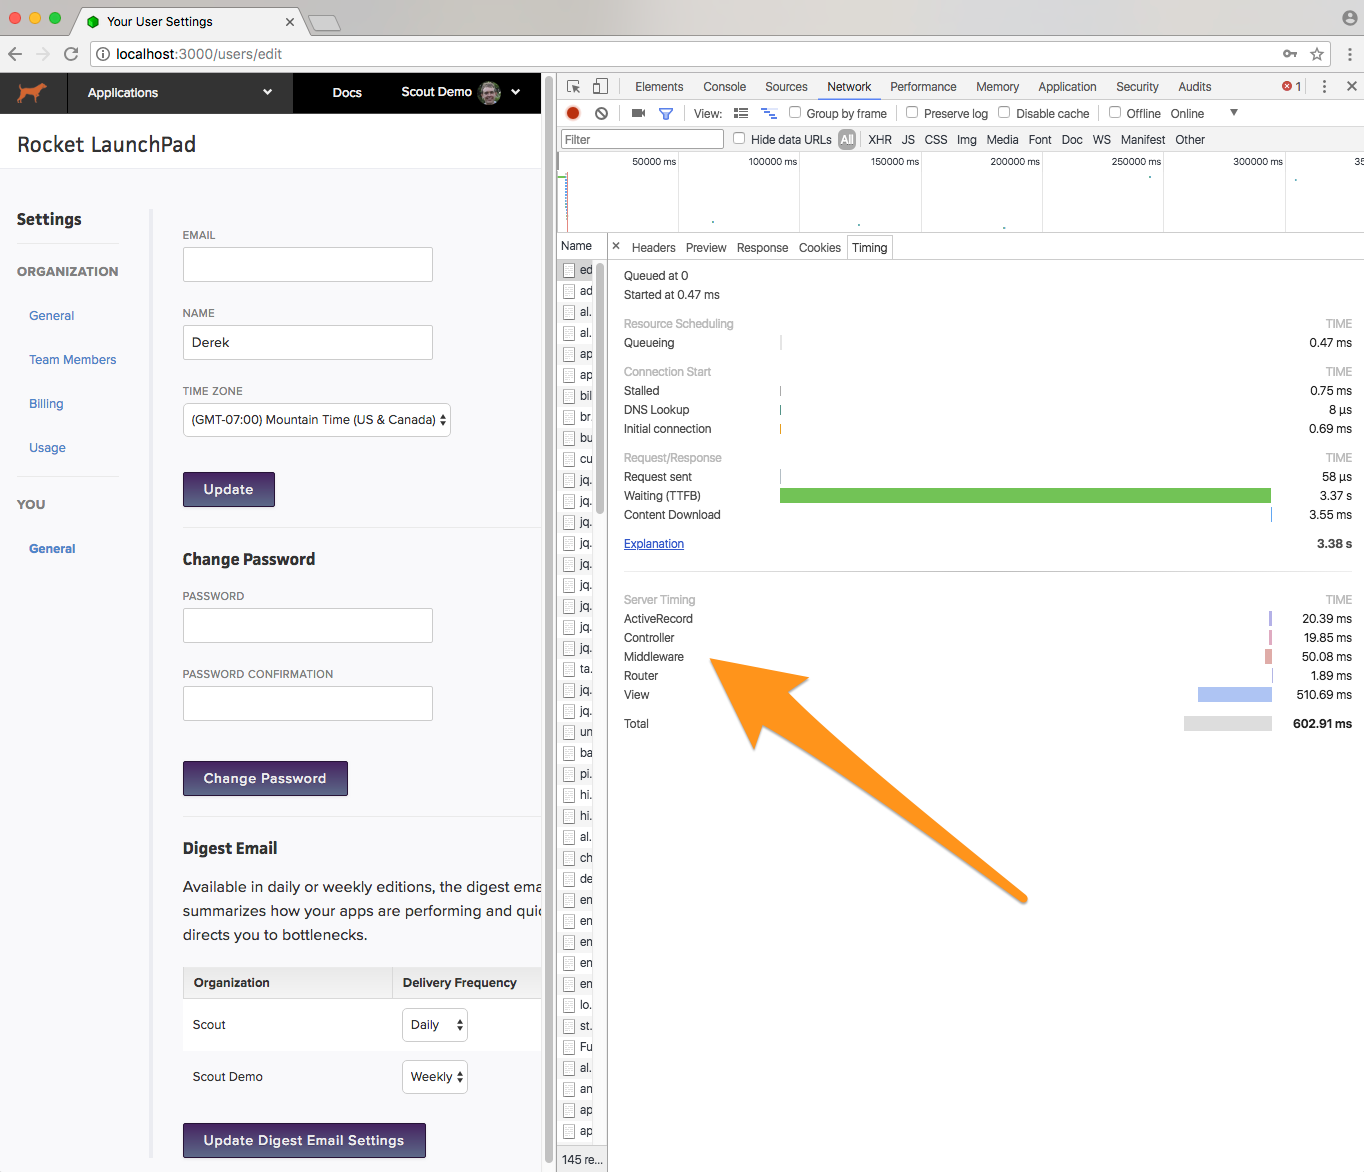
That changes with the Server Timing API. Supported by Chrome 65+, Firefox 59+, and more browsers, the Server Timing API defines a spec that enables a server to communicate performance metrics about the request-response cycle to the user agent. When you use our open-source Ruby or Elixir server timing libraries, you'll see a breakdown of server-side database queries, view rendering, and more:
Combined with the already strong client-side browser performance tools, this paints a full picture of web performance.
Get started with Scout's server timing libraries:
A Scout account isn't required, but it does make investigating slow response times more fun.


