A memory leak in an application deployed on the cloud can affect the availability and reliability of the application. Therefore, it is highly important to identify and ultimately resolve it quickly. However, in the production environment running on the cloud, memory leak detection is a challenge without the knowledge of the application or its internal object allocation details.
What is a Memory Leak?
A memory leak is the gradual loss of available computer memory when a program (an application or part of the operating system) repeatedly fails to return memory it obtained for temporary use. Memory leaks are distinct from any other program bugs in that they do not affect program behavior directly by influencing (or altering) the execution path although accumulated leaks cause application performance degradation which is visible to the outside world.
What Causes Memory Leaks?
Python
Sometimes, Garbage collectors fail to keep a check on unreferenced objects which leads to memory leaks in Python. Eventually, programs in python run out of memory because it gets filled by memory leaks. Thus, we can say that memory leak occurs in python when the unused data is heaped up and the programmer forgets to delete it. The main causes of memory leaks in python are: lingering on all the large objects which have not been released, and reference cycles in the code and, sometimes, underlying libraries.
PHP
There are several ways for memory leaks to occur in PHP. Variables that never go out of scope, cyclical references, extensions in C that `malloc` instead of `emalloc` and for whatever reason don’t `free`, to name a few. There are surprising and quite subtle ways of using and holding on to memory in PHP. PHP does have garbage collection that should help prevent memory leaks. However, several factors can prevent the garbage collector from fulfilling its task. For example, if an object’s refcount increases and never decreases, then the object is still technically in use and is not garbage. The garbage collector, therefore, cannot identify it as such and will not free up the object. Garbage collection is active in PHP by default, but it can be disabled through settings in `php.ini`. If garbage collection is disabled, you’ll quickly accumulate unused memory that’s never freed.
Node JS
Memory leaks occur when long-lived objects are attached to expectedly short-lived objects. A real-life example of how a memory can leak is shown in this code snippet:
const requests = new Map();
app.get( "/", (req,res) => {
    requests.set(req.id, req);
    res.status(200).send("Hello World");
});
The above example is likely to cause a memory leak because the variable requests, which holds a new instance of the Map object, is global. Thus, every time a request hits the server, there is a memory allocation to the object. The guaranteed memory allocation to the new instance means that the object will live forever. The application will eventually run out of memory and crash when the number of requests consumes memory beyond the resources available to the application.
Technical and Financial Consequences of Memory Leaks
Technically, the presence of memory leaks causes gradual exhaustion of system memory and eventually leads to serious performance degradation of production systems. They make programs end unexpectedly, or crash before they can shut down in an orderly fashion and give to their memory. Moreover, memory leaks can be intentionally exploited by adversaries to launch denial-of-service attacks.
One notable example showing the severity of memory leakage is the Amazon web services outage. In 2012, Amazon replaced a data collection server. Unfortunately, this seemingly harmless maintenance action caused an incorrect configuration of some servers, which led to memory leaks. Due to the failure of a monitoring alarm, the memory leaks went out of control eventually, and the affected servers came to a stop. Consequently, millions of users were affected by memory leaks.
Memory leaks are hard to detect and fix at an early stage of development. Since their number of possible execution paths is potentially infinite, covering every possible execution path and configuration is not feasible even for extensive in-house testing. As a result, only the obvious leaks are discovered and fixed during the testing stage. The remaining leaks, therefore, are highly susceptible to the execution environment and are highly elusive. The Amazon memory leak incident is a clear demonstration of how tricky memory leaks are.
Leaks waste space by filling up pages of memory with inaccessible data and waste time due to extra paging activity. Leaked memory eventually forces the system to allocate additional virtual memory pages for the application, the allocation of which could have been avoided by reclaiming the leaked memory.
Garbage collection does not solve memory leakage entirely because garbage collection only collects what it knows not to be in use. Objects that are reachable from the roots are not considered garbage. GC is the most convenient method for handling memory leaks, although one of the downsides is that it consumes additional resources in the process of deciding which space to free. This would thereby slow down processes hence affecting the application performance.
Even if your app doesn't exhibit slowness, if it leaks memory, it can retain that memory even while it's in the background. This behavior can slow the rest of the system's memory performance by forcing unnecessary garbage collection events. Eventually, the system is forced to kill your app process to reclaim the memory. Then when the user returns to your app, it must restart completely and this is extremely terrible to application performance.
How to Find a Memory Leak
Ruby
The list of steps below assumes you have determined there is a memory leak in your Ruby application but don’t know what is causing it. Your first instinct might be to reach for some memory profiling tool and begin looking at memory allocation over time. Some of these steps might seem like a waste of time, but in practice are the most effective. These first two steps focus on gems. Often times third-party code is more widely used and pitfalls and memory leaks are more widely known.
- Check for any unused gems in the Gemfile and remove them
There are numerous tools out there to help you find memory leaks in Ruby applications, but with a large codebase even the best tools still produce a lot of noise. If you find even one unused gem it will greatly reduce the amount of code you need to analyze to find the memory leak. Seldom have I not found at least one or two unused gems when reviewing the Gemfile of a legacy Ruby application. Removing unused gems sometimes has the added benefit of reducing overall memory usage.
- Check the issue tracker of each gem still present in the Gemfile for reports of memory leaks
A gem may contain memory leaks that have already been reported on the gem’s issue tracker or mailing list. If you find a ticket or thread that describes something similar to the leak you are experiencing, you may have found your memory leak. If a newer version of the gem contains a fix for the memory leak upgrade to the latest version. If you found a ticket but a fix is not available, you may have to work with the maintainers of the gem to get it fixed or fork the project and fix it yourself. If you don’t find someone on the issue tracker describing your issue the changelogs will show if any released versions of the gem contain fixes for memory leaks. Even if a leak does not seem like the one you are experiencing its best upgrade to a version that doesn’t have any known leaks. If you do not find the source of the leak continue to step 3.
- Run Rubocop with the rubocop-performance extension
This isn’t likely to find the cause of the memory leak, but it will alert you to general performance issues, which may give you clues as to where the leak is. If there are any Rubocop performance warnings correct the code and see if the memory leak is still present. The memory leak will likely still be present. If it is continuing to step 4.
- Visually review the Ruby code for possible memory leaks
Read through the application code and look for class attributes that grow in size, arrays that grow but never shrink, and long-lived objects. Creating a memory leak is pretty easy. Fix any obvious issues, but don’t spend a ton of time on this; just read through the code quickly and look for any obvious issues. On applications with very large codebases, you may need to skip this step as it will be too time-consuming. If you haven’t found the cause of the leak continue to step 5.
- If you still haven’t found the issue, use Ruby’s ObjectSpaceclass to find the leak
Follow the steps in the sections below to profile memory usage.
By using ObjectSpace.each_object.
Ruby already comes with ObjectSpace which contains a few methods for analyzing your program. The most useful for finding memory leaks is ObjectSpace.each_ object which yields every single ruby object in your program.
counts = Hash.new{ 0 }
ObjectSpace.each_object do |o|
counts[o.class] += 1
end
By dumping the counts into a file after each request and using diff it’s possible to determine what kind of objects are leaking. This is essential to know, but it doesn’t give you any insight into why they’re not being garbage collected.
Python
Tools like, tracemalloc, are part of the Python system library. Essentially tracemalloc is used to take snapshots of the Python memory.
PHP
Identifying the source of your PHP memory leak is the first step to finding a solution. You can’t fix a problem until you understand its underlying cause.
Option One: Log Your Scripts
If you’re running multiple scripts, then you need to determine which one is causing the leak. Use `auto_append_file` and `memory_get*` to generate a log of your scripts. Then, review the scripts to see which ones use the most memory.
Option Two: Discover Peak Usage
Use `memory_get_peak_usage` to find out how much memory has been allocated to your script. If it looks abnormally high, then you might first look at your PHP script for code that may be unintentionally loading or iterating over more data than anticipated. If so, break down the loading or processing of the data into manageable chunks instead of all-at-once.
Option Three: Use a PHP Memory Profiler
Use the php-memprof extension to learn how much memory is still in use after a script runs.
Monitoring Memory Usage with a PHP Memory Profiler
Monitoring memory usage with a PHP memory profiler can make it much easier for you to spot problems within your scripts. Several PHP profilers include features that will detect memory leaks.
What is memory profiling?
Memory profiling scans your PHP scripts to see precisely how each function uses memory. The level of depth that you get will depend on the PHP memory profiler that you choose. Some, for example, will show you how much memory your functions use and continue to use while running a script. Others will point you directly to problematic functions that cause PHP memory leaks and other performance issues.
Node JS
Automatic memory management like garbage collection in V8 aims to avoid such memory leaks, for example, circular references are no longer a concern, but could still happen due to unwanted references in the Heap and could be caused by different reasons. Some of the most common reasons are described below.
- Global variables: Since global variables in JavaScript are referenced by the root node (window or global this), they are never garbage collected throughout the lifetime of the application, and will occupy memory as long as the application is running. This applies to any object referenced by the global variables and all their children as well. Having a large graph of objects referenced from the root can lead to a memory leak.
- Multiple references: When the same object is referenced from multiple objects, it might lead to a memory leak when one of the references is left dangling.
- Closures: JavaScript closures have the cool feature of memorizing its surrounding context. When a closure holds a reference to a large object in heap, it keeps the object in memory as long as the closure is in use. This means you can easily end up in situations where a closure holding such reference can be improperly used leading to a memory leak
- Timers & Events: The use of setTimeout, setInterval, Observers and event listeners can cause memory leaks when heavy object references are kept in their callbacks without proper handling.
Memory Leak Detection Tools
Scout APM has developed the best tool called the Scout APM Monitoring for modern development teams.
Our platform is focused on finding the root cause of application performance problems as quickly as possible. Scout Leverage Tools that help us get big things done. Our APM is effective at applications supported by GitHub, PaaS services, Dynamic Languages, and frequent releases to build tailored monitoring Platforms for Modern teams.
Best Practices for Preventing Memory Leaks
Python
Practice 1: Monitor Memory Utilisation.
A simple Python program may not cause many problems when it comes to memory, but memory utilization becomes critical on high memory consuming projects. It's always advisable to keep memory utilization in mind from the very beginning when working on a big project.
- Calculate large sets of results using generators:
Generators give you lazy evaluation. You use them by iterating over them: either explicitly with 'for' or implicitly, by passing it to any function or construct that iterates.
Use slots when defining a Python class. You can tell Python not to use a dynamic dict, and only allocate space for a fixed set of attributes, eliminating the overhead of using one dict for every object by setting __slots__ on the class to a fixed list of attribute names. Slots also prevent arbitrary attribute assignment on an object, thus the shape of the object remains same throughout. Read more about slots here.
You can track your memory usage at object level by using built-in modules like resource and objgraph.
Practice 2: Share Code.
Sharing code is a rewarding endeavor. Whatever the motivation, your good intentions may not have the desired outcome if people find your code hard to use or understand. Almost every organization follows style guidelines that developers have to follow for consistency, easy debugging, and ease of collaboration. The Zen of Python is like a mini style and design guide for Python. Popular style guidelines for Python include:
- PEP-8 style guide
- Python Idioms and efficiency
- Google Python Style Guide
- Using static code analysis tools
There are lots of open-source tools available that you can use to make your code compliant with standard style guidelines and best practices for writing code.
Pylint is a Python tool that checks a module for coding standards. Pylint can be a quick and easy way of seeing if your code has captured the essence of PEP-8 and is, therefore, ‘friendly’ to other potential users.
It also provides you with reports with insightful metrics and statistics that may help you judge code quality. You can also customize it by creating your own .pylintrc file and using it.
Pylint is not the only option — there are other tools like PyChecker, PyFlakes, and packages like pep8 and flakes8.
- Document your code properly
This aspect is most critical to the usability and readability of your codebase. It is always advised to document your code as extensively as possible, so that other developers face less friction to understand your code.
A typical inline-documentation of a function should include:
A one-line summary of what the function does.
Interactive examples, if applicable. These could be referred by the new developer to quickly observe the usage and expected output of your function. As well as you can use the doctest module to assert the correctness of these examples (running as tests). See the doctest documentation for examples.
Parameters documentation (generally one line describing the parameter and its role in the function)
- Return type documentation (unless your function doesn't return anything!)
Sphinx is a widely used tool for generating and managing your project documentation. It offers a lot of handy features that would reduce your efforts in writing standard documentation. Moreover, you can publish your documentation at Read the Docs for free, which is the most common way of hosting documentation for projects.
The Hitchiker's guide to Python for documentation contains some interesting information that may be useful to you while documenting your code.
Practice 3: Speed Up Your Performance
Multiprocess, not Multi-thread
When it comes to improving the execution time of your multiple-task code, you may want to utilize multiple cores in the CPU to execute several tasks simultaneously. It may seem intuitive to spawn several threads and let them execute concurrently, but, because of the Global Interpreter Lock in Python, all you're doing is making your threads execute on the same core turn by turn.
To achieve actual parallelization in Python, you might have to use a Python multiprocessing module. Another solution might be outsourcing the tasks to:
The operating system (by doing multi-processing)
Some external application that calls your Python code (e.g., Spark or Hadoop)
Code that your Python code calls (e.g. you could have your Python code call a C function that does the expensive multi-threaded stuff).
Apart from multiprogramming, there are other ways to boost your performance. Some of them include:
- Using the latest version of Python: This is the most straightforward way because new updates generally include enhancements to already existing functionalities in terms of performance.
- Use built-in functions wherever possible: This also aligns with the DRY principle — built-in functions are carefully designed and reviewed by some of the best Python developers in the world, so they're often the best way to go.
- Consider using Ctypes: Ctypes provides an interface to call C shared functions from your Python code. C is a language closer to machine level, which makes your code execute much faster compared to similar implementations in Python.
- Using Cython: Cython is a superset Python language that allows users to call C functions and have static type declarations, which eventually leads to a simpler final code that will probably execute much faster.
- Using PyPy: PyPy is another Python implementation that has a JIT (just-in-time) compiler, which could make your code execution faster. Though I've never tried PyPy, it also claims to reduce your programs' memory consumption. Companies like Quora actually use PyPy in production.
- Design and Data Structures: This applies to every language. Make sure you're using the right data structures for your purpose, declare variables at the right place, wisely make use of identifier scope, and cache your results wherever it makes sense, etc.
- A language specific example that I could give is — Python is usually slow with accessing global variables and resolving function addresses, so it's faster to assign them to a local variable in your scope and then access them.
Practice 4: Picking the right Versions!
Python2.x or Python3.x?
On one hand, Python3 has some great new features. On the other hand, you may want to use a package that only support Python2 like (Apple's coremltools. Moreover Python3 is not backward-compatible. This means that running your Python2 code on a Python3.x interpreter can possibly throw errors.
It is advisable to use the latest release of Python when starting a new project, but, if for some reason you've to stick to Python 2.x, then it is possible to write code in a way that works on both Python2 and Python3 interpreters. The most common way is to use packages like future, builtins, and six to maintain a single, clean Python3.x compatible codebase that supports both Python2 and Python3 with minimal overhead.
Handling your pip requirements
Generally, all the pip dependencies of a project are specified in a file named requirements.txt in the root of your project. Another person trying to run your project can simply install all the requirements using this file with the command pip install -r requirements.txt. It is also a common practice to put the dependecies required for running your tests in a separate file named test-requirements.txt.
Note that pip does not use requirements.txt when your project is installed as a dependency by others. Generally, for that, you'll have to specify dependencies in the install_requires and tests_require arguments of setuptools.setup function in your setup.py file. If you want to maintain a common dependency file for both packaging and development.
Use virtual environment
A change in version of the dependency can break certain parts of your projects, it is often advisable to use Virtual environments (lightweight, self-contained Python installations) to avoid conflicting versions of a dependency across multiple projects while developing. Apart from this, they are super easy to set up, The Hitchiker's Guide to Python discusses some basic usage here.
Versioning your project.
Follow Semantic versioning, hands down! See this guide for different ways to store your project version in your package.
Practice 5: Analyzing your code
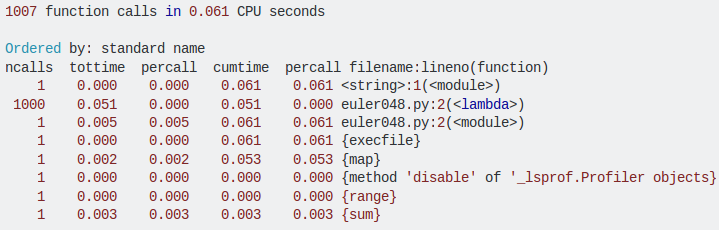
It's often helpful to analyze your code for coverage, quality, and performance. Python comes with the cProfile module to help evaluate performance. It not only gives the total running time, it also times each function separately.
It then tells you how many times each function was called, which makes it easy to determine where you should make optimizations. Here's what a sample analysis by cProfile looks like:
- memory_profiler is a Python module for monitoring memory consumption of processes, as well as a line-by-line analysis of memory consumption for Python programs.
- objgraph allows you to show the top N objects occupying our Python program’s memory, what objects have been deleted or added over a period of time, and all references to a given object in your script.
- resource provides basic mechanisms for measuring and controlling system resources utilized by a program.
Practice 6: Testing and Continuous Integration
Testing:
It is good practice to write unit tests. If you think that writing tests aren't worth the effort, take a look at this StackOverflow thread. It's better to write your tests before or during coding. Python provides unittest modules to write unit tests for your functions and classes. There are frameworks like:
- nose - can run unittest tests and has less boilerplate.
- pytest - also runs unittest tests, has less boilerplate, better reporting, and lots of cool, extra features.
To get a good comparison among these, read the introduction here.
Not to forget the doctest module, which tests your source code using the interactive examples illustrated in the inline documentation.
- Measuring coverage:
Coverage is a tool for measuring Python program code coverage. It monitors your program, notes which parts of the code have been executed, then analyzes the source to identify code that could've been executed but was not.
Coverage measurement is typically used to gauge the effectiveness of tests. It can show which parts of your code are being exercised by tests, and which are not. It is often advisable to have 100% branch coverage, meaning your tests should be able to execute and verify the output of every branch of the project.
Continuous Integration:
Having a CI system for your project from the very beginning can be very useful for your project in the long run. You can easily test various aspects of your codebase using a CI service.
Node JS
These practices can help you reduce memory leaks
Reduce use of Global Variables
Since global variables are never garbage collected, it’s best to ensure you don’t overuse them. Below are some ways to ensure that.
- Avoid Accidental Globals
When you assign a value to an undeclared variable, JavaScript automatically hoists it as a global variable in default mode. This could be the result of a typo and could lead to a memory leak. Another way could be when assigning a variable to this, which is still a holy grail in JavaScript.
// This will be hoisted as a global variable
function hello() {
    foo = "Message";
}

// This will also become a global variable as global functions have
// global `this` as the contextual `this` in non strict mode
function hello() {
    this.foo = "Message";
}
To avoid such surprises, always write JavaScript in strict mode using the 'use strict'; annotation at the top of your JS file. In strict mode, the above will result in an error. When you use ES modules or transpilers like TypeScript or Babel, you don’t need it as it’s automatically enabled. In recent versions of NodeJS, you can enable strict mode globally by passing the --use_strict flag when running the node command.
"use strict";

// This will not be hoisted as global variable
function hello() {
    foo = "Message"; // will throw runtime error
}

// This will not become global variable as global functions
// have their own `this` in strict mode
function hello() {
    this.foo = "Message";
}
When you use arrow functions, you also need to be mindful not to create accidental globals, and unfortunately, strict mode will not help with this. You can use the no-invalid-this rule from ESLint to avoid such cases. If you are not using ESLint, just make sure not to assign to this from global arrow functions
// This will also become a global variable as arrow functions
// do not have a contextual `this` and instead use a lexical `this`
const hello = () => {
    this.foo = 'Message";
}
Finally, keep in mind not to bind global this to any functions using the bind or call method, as it will defeat the purpose of using strict mode and such.
- Use Global Scope Sparingly
In general, it’s a good practice to avoid using the global scope whenever possible and to also avoid using global variables as much as possible.
As much as possible, don’t use the global scope. Instead, use local scope inside functions, as those will be garbage collected and memory will be freed. If you have to use a global variable due to some constraints, set the value to null when it’s no longer needed.
Use global variables only for constants, cache, and reusable singletons. Don’t use global variables for the convenience of avoiding passing values around. For sharing data between functions and classes, pass the values around as parameters or object attributes.
Use Stack Memory Effectively
Using stack variables as much as possible helps with memory efficiency and performance as stack access is faster than heap access. It ensures that we don’t accidentally cause memory leaks. Of course, it’s not practical to only use static data. In real-world applications, we would have to use many objects and dynamic data. But we can follow some tricks to make better use of stack.
- Avoid heap object references from stack variables when possible. Also, don’t keep unused variables.
- Restructure and use fields needed from an object or array rather than passing around entire objects/arrays to functions, closures, timers, and event handlers. This avoids keeping a reference to objects inside closures. The fields passed might mostly be primitives, which will be kept in the stack.
function outer() {
    const obj = {
        foo: 1,
        bar: "hello",
    };

    const closure = () {
        const { foo } = obj;
        myFunc(foo);
    }
}
function myFunc(foo) {}
Use Heap Memory Effectively
It’s not possible to avoid using heap memory in any application, but we can make them more efficient by following these tips:
- Copy objects instead of passing references. Pass a reference only if the object is huge and a copy operation is expensive.
- Avoid object mutations as much as possible. Instead, use object spread or Object.assign to copy them.
- Avoid creating multiple references to the same object. Instead, make a copy of the object.
- Use short-lived variables.
- Avoid creating huge object trees. If they are unavoidable, try to keep them short-lived in the local scope.
Properly using closures, timers, and event handlers
As we saw earlier, closures, timers, and event handlers are other areas where memory leaks can occur. Let’s start with closures as they are the most common in JavaScript code. Look at the code below from the Meteor team. This leads to a memory leak as the longStr variable is never collected and keeps growing memory.
var theThing = null;
var replaceThing = function () {
    var originalThing = theThing;
    var unused = function () {
        if (originalThing) console.log("hi");
    };
    theThing = {
        longStr: new Array(1000000).join("*"),
        someMethod: function ()
{ console.log(someMessage);
        },
    };
};
setInterval(replaceThing, 1000);
The code above creates multiple closures, and those closures hold on to object references. The memory leak, in this case, can be fixed by nullifying originalThing at the end of the replaceThing function. Such cases can also be avoided by creating copies of the object and following the immutable approach mentioned earlier.
When it comes to timers, always remember to pass copies of objects and avoid mutations. Also, clear timers when done, using clearTimeout and clearInterval methods.
The same goes for event listeners and observers. Clear them once the job is done, don’t leave event listeners running forever, especially if they are going to hold on to any object reference from the parent scope.
Conclusion
Diagnosis of leak-inducing defects is one of the main challenges for practitioners in software development and maintenance, therefore understanding the characteristics of resource and memory leaks can provide useful information to further improve leak diagnosis techniques.
References
https://docs.python.org/3/library/tracemalloc.html
https://www.ibm.com/developerworks/web/library/wa-memleak/wa-memleak-pdf.pdf
https://developer.mozilla.org/en-US/docs/Web/JavaScript/Memory_Management
https://docs.microsoft.com/en-us/previous-versions/msdn10/ff728624(v=msdn.10)