Scout Monitoring
No good endpoint left behind
- APM support for Ruby, Python, and PHP frameworks
- Sniff out memory bloat and get slow query insights
- Resolve N+1 queries with tracing logic tied to source code
- Straightforward log management with trace context

Hassle-free app monitoring that just works.
Get the performance monitoring insights you need without the hassle of mandatory sales calls or awaiting a response from a generic corporate support inbox for help on a complex onboarding process.
Supported Technologies:
-
- Ruby (Rails, Sinatra, Sidekiq, and more)
- Python (Django, Flask, FastAPI, and more)
- PHP (Laravel, Symfony, and more)
Identify, Solve & Monitor:
-
- N+1s
- Background jobs
- Memory Bloat
- Memory Leaks
- Slow Database Queries
- Overall Performance Metrics
Simple 3-step Set Up
- Install the Scout agent for a language (Ruby, Python, PHP)
- Configure the agent (easy, like three environment variables!)
- Deploy Scout Monitoring Tool
Enjoy turning slow code into fast code with Scout’s performance monitoring tool for your web applications.

The Grizzly Labs
“For over a year, we have utilized Scout APM, and it has been pivotal in enhancing the stability and efficiency of the Genius Scan’s backend, ultimately resulting in an enhanced user experience for millions of users.ScoutAPM proved to be indispensable in identifying and troubleshooting several crucial performance issues that would have remained unnoticed without its capabilities.”
– Bruno Virlet, Co-Founder

Internet Engineering Task Force
“Scout’s leadership and development team went out of their way to bring our volunteers up to speed in real-time. That willingness and agility was exceptional, and we truly appreciate the high level
of helpful engagement.”
– Robert Sparks, IETF
Scout Performance Monitoring
How Our Tool Works
Spend less time debugging performance issues and more time building.
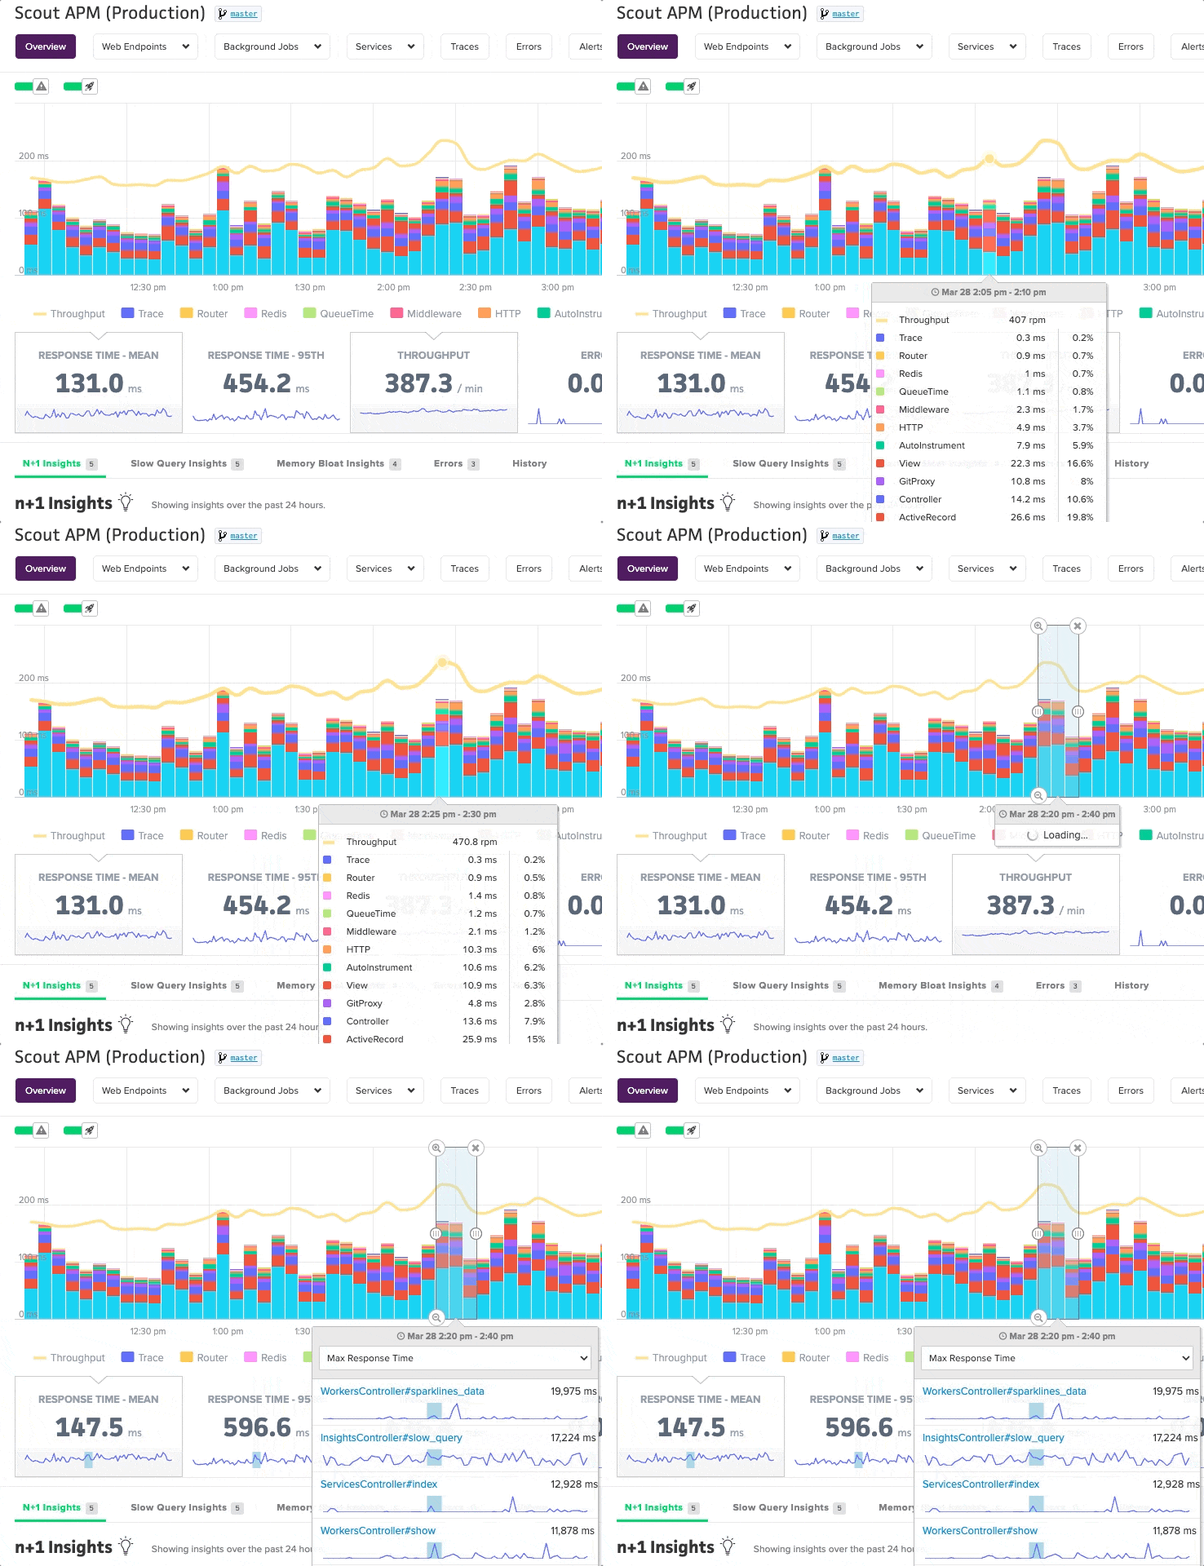
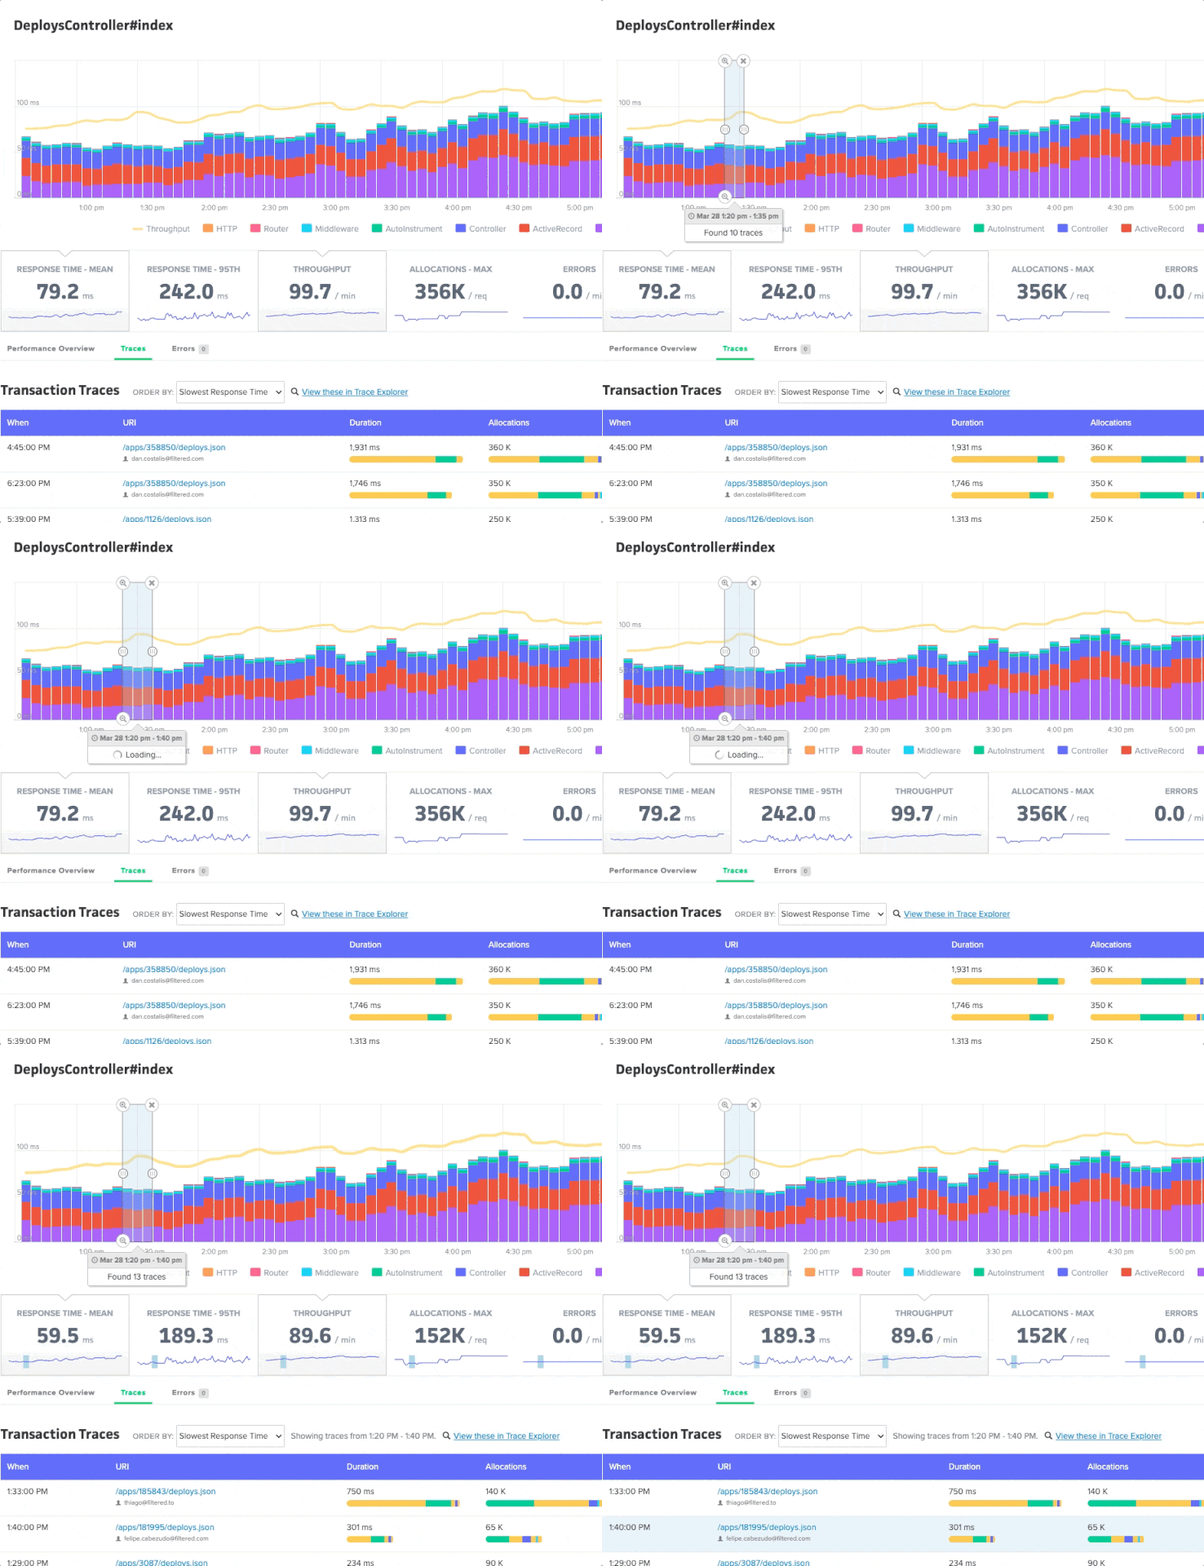
Scout’s tracing logic ties bottlenecks to the source code causing them so engineers like you can quickly find and fix common and one-off performance issues alike.
Proactive alerting, real-time insights and always-on support means you can rest easy knowing Scout is monitoring your Rails, Django and Laravel apps.
Get Started
Sign up for a free plan and get 14 days of unlimited access!

