What Are We Doing Here?
Coming back from Monitorama, I had a chance to sit back and start playing with some tools to see how they worked. Prometheus is a pretty ubiquitous tool in the monitoring space, it's pretty easy to spin up, and is open-source. Having a very active community of engaged developers means finding help articles or guides is easy. We are also going to use Grafana to build nicer looking graphs based on API queries from Prometheus.
Scout does a great job of letting your developers easily track down what is happening in your application. Using tools such as Prometheus and Grafana give your SREs and DevOps folks further insights into what is happening in the environment your application is deployed in. Okay, let’s dive in and get some monitoring rolling!
Getting your Application Docker Containers Set Up:
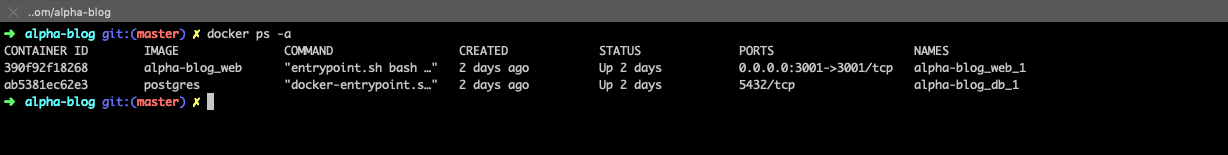
First things first, we need an environment. Docker is a great way to get your applications put into the cloud. Regardless of your preference for coding language, Docker can pretty much handle any of the most common frameworks. In case you have missed it, Matthew has been pumping out a great series of Docker articles over the past few weeks. In this article, we are specifically going to piggyback off of his article on getting a Rails application into Docker. I recommend getting this set up first so that you have something to measure when you get your Prometheus network set up.
Getting Prometheus Spun Up In A Dockerized Environment:
Application deployed via Docker? Check! Moving onto the server side of the pie. I am going to be deploying all of this on my local Docker host, but this can be easily replicated on a cloud provider such as GCP, AWS, Azure, etc. (with a few other bits of config that are outside of the scope of this article). There are several ways to do this, but a few folks have already done the hard work and put together GitHub repositories or guides walking you through the installation and aggregation of pertinent tools to make Prometheus usable right out of the box, significantly reducing time to deploy. These will at least give you a good idea of what can be done with the tools.
Dockprom, An Alternative To Adding In All Of The Bits Yourself
When I first started looking into deploying Prometheus on a Docker stack, I ran into a great example. Stefan Prodan has put together an entire GitHub repo of some of the tools you need to effectively build a monitoring solution for your Docker environment and took the time to put together this blog post to explain everything. If you are looking for an easy way to add in Grafana, cAdvisor, NodeExporter, AlertManager, and of course Prometheus, check it out. Stefan’s repo makes spinning up the monitoring bit pretty darn easy as all of the files you need are already configured and in place.
Install
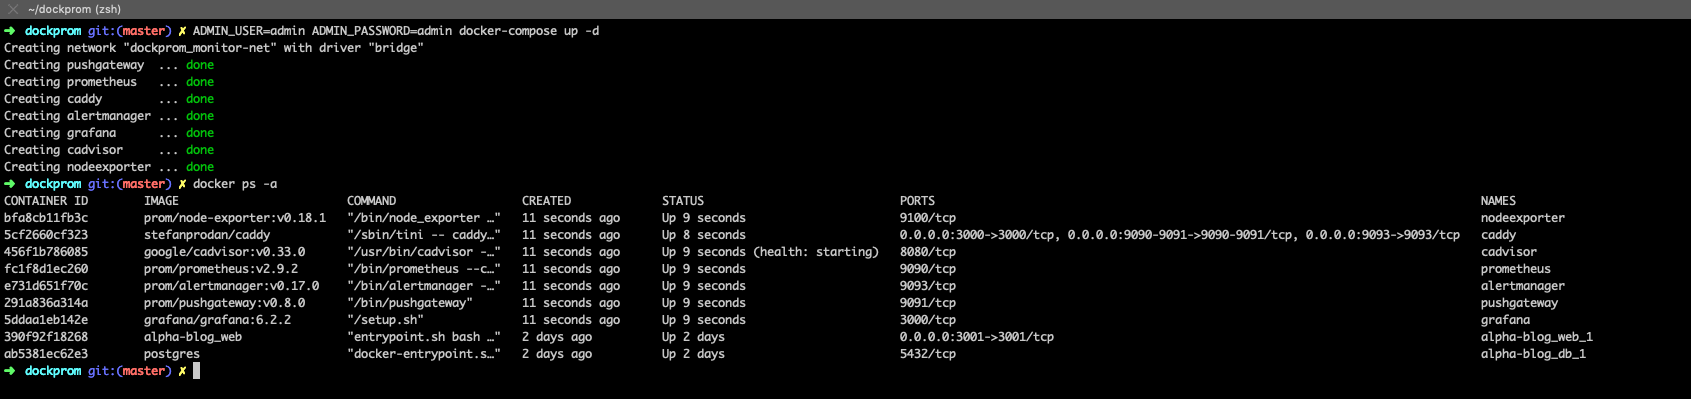
Clone this repository on your Docker host, cd into dockprom directory and run compose up:
git clone https://github.com/stefanprodan/dockpromcd dockpromADMIN_USER=admin ADMIN_PASSWORD=admin docker-compose up -d
Prerequisites:
- Docker Engine >= 1.13
- Docker Compose >= 1.11
Containers:
- Prometheus (metrics database)
http://<host-ip>:9090 - Prometheus-Pushgateway (push acceptor for ephemeral and batch jobs)
http://<host-ip>:9091 - AlertManager (alerts management)
http://<host-ip>:9093 - Grafana (visualize metrics)
http://<host-ip>:3000 - NodeExporter (host metrics collector)
- cAdvisor (containers metrics collector)
- Caddy (reverse proxy and basic auth provider for prometheus and alertmanager)
Setup Grafana
Navigate to http://<host-ip>:3000 and login with user admin password admin. You can change the credentials in the compose file or by supplying the ADMIN_USER and ADMIN_PASSWORD environment variables on compose up. The config file can be added directly in grafana part like this
grafana:
  image: grafana/grafana:5.2.4
  env_file:
    - config
and the config file format should have this content
GF_SECURITY_ADMIN_USER=admin
GF_SECURITY_ADMIN_PASSWORD=changeme
GF_USERS_ALLOW_SIGN_UP=false
If you want to change the password, you have to remove this entry, otherwise the change will not take effect
- grafana_data:/var/lib/grafana
Grafana is preconfigured with dashboards and Prometheus as the default data source:
- Name: Prometheus
- Type: Prometheus
- Url: http://prometheus:9090
- Access: proxy
alertmanager, pushgateway, grafana, and prometheus)
Dashboard Nirvana
The Docker Host Dashboard shows key metrics for monitoring the resource usage of your server:
- Server uptime, CPU idle percent, number of CPU cores, available memory, swap and storage
- System load average graph, running and blocked by IO processes graph, interrupts graph
- CPU usage graph by mode (guest, idle, iowait, irq, nice, softirq, steal, system, user)
- Memory usage graph by distribution (used, free, buffers, cached)
- IO usage graph (read Bps, read Bps and IO time)
- Network usage graph by device (inbound Bps, Outbound Bps)
- Swap usage and activity graphs

The Docker Containers Dashboard shows key metrics for monitoring running containers:
- Total containers CPU load, memory and storage usage
- Running containers graph, system load graph, IO usage graph
- Container CPU usage graph
- Container memory usage graph
- Container cached memory usage graph
- Container network inbound usage graph
- Container network outbound usage graph
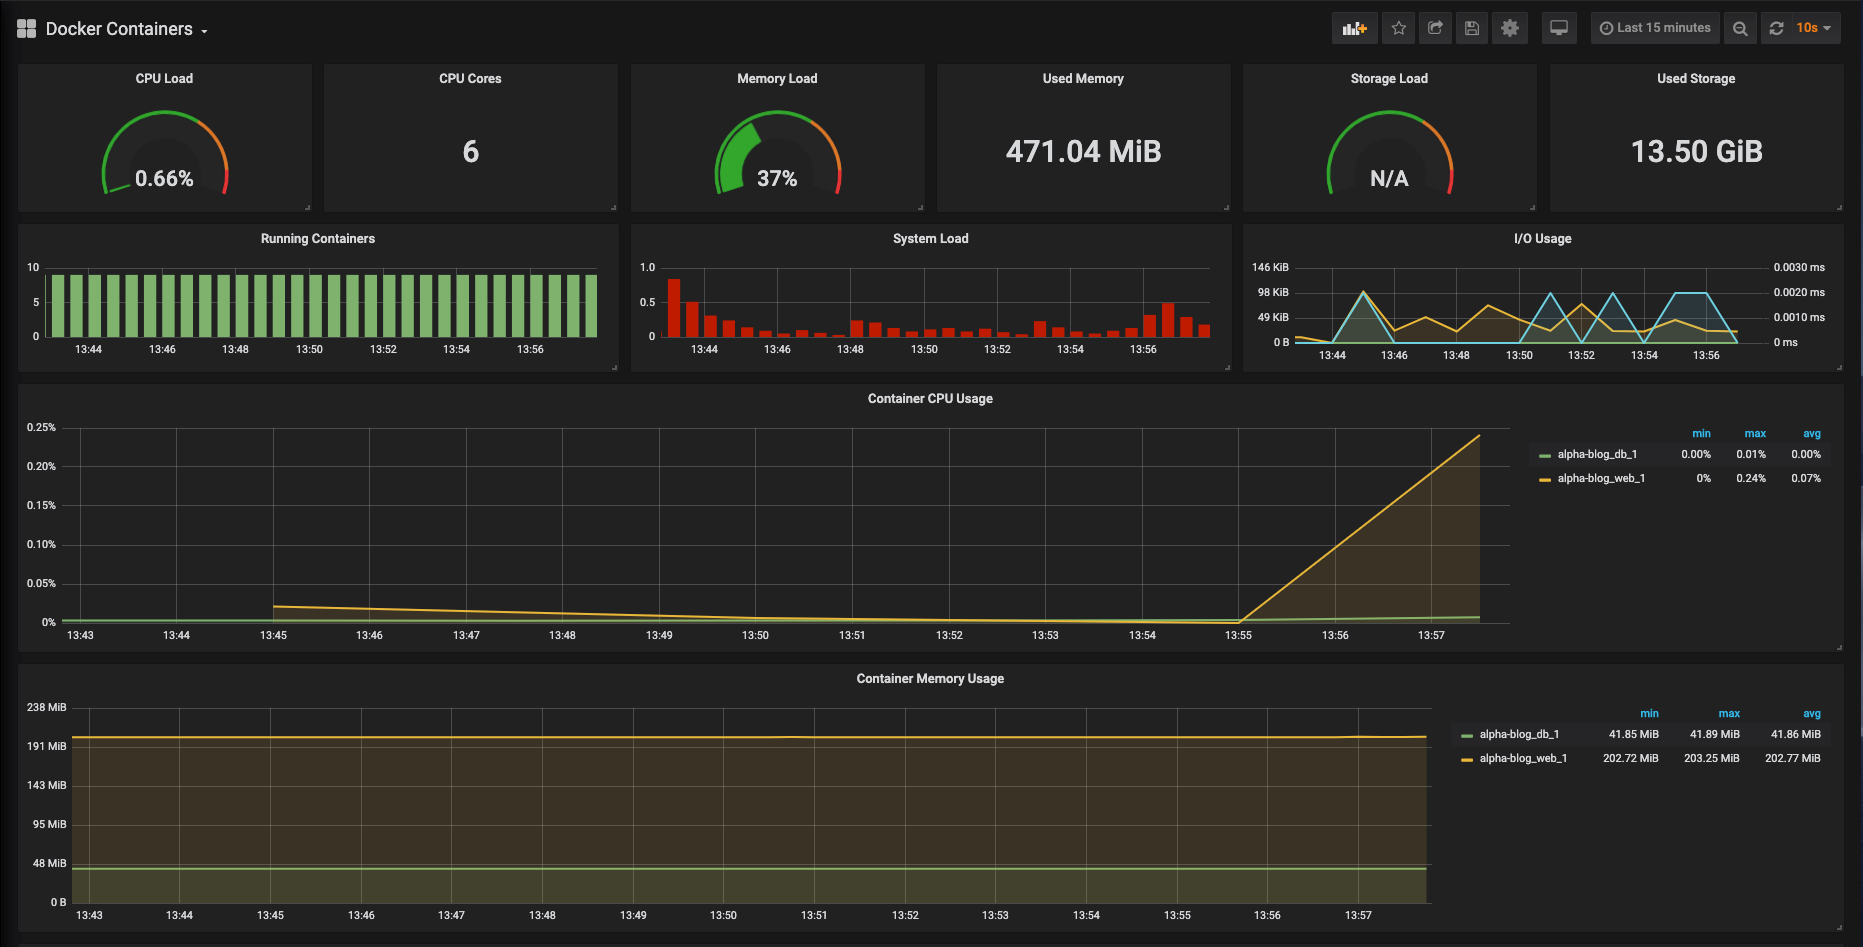
on my Rails app to generate some traffic to monitor.
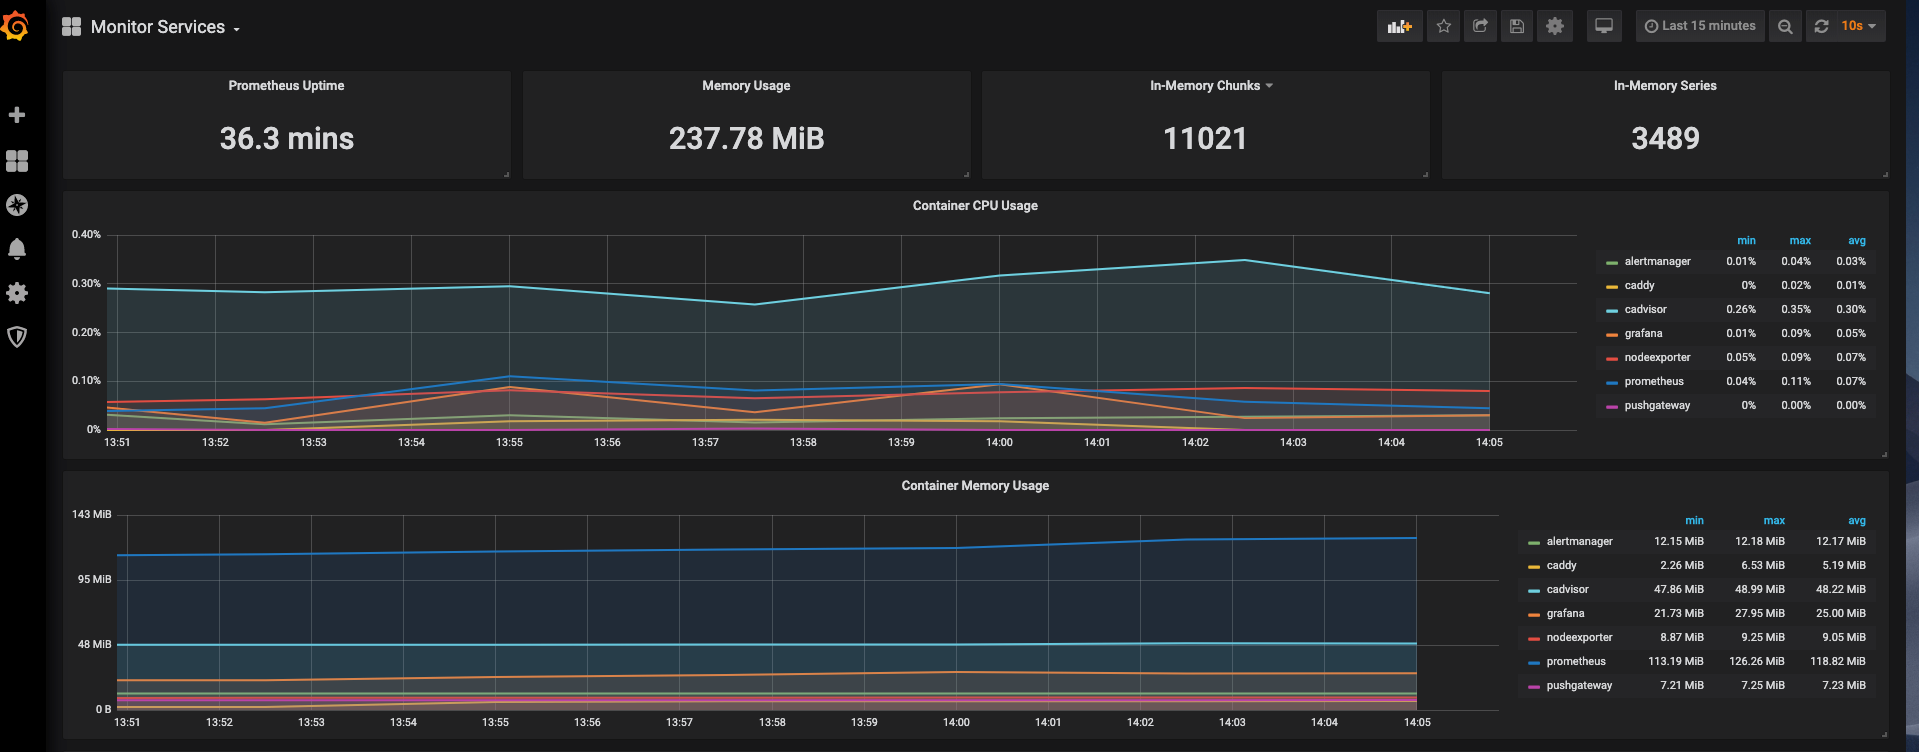
The Monitor Services Dashboard shows key metrics for monitoring the containers that make up the monitoring stack:
- Prometheus container uptime, monitoring stack total memory usage, Prometheus local storage memory chunks and series
- Container CPU usage graph
- Container memory usage graph
- Prometheus chunks to persist and persistence urgency graphs
- Prometheus chunks ops and checkpoint duration graphs
- Prometheus samples ingested rate, target scrapes and scrape duration graphs
- Prometheus HTTP requests graph
- Prometheus alerts graph
Tying It All Together
We have now shown how to easily monitor your Docker containers and provide easy-to-read, graphical dashboards for your team. This post has only scratched the surface with regards to what you can accomplish with these tools. The point of all of these tools is to make it as easy as possible for your teams to monitor and address issues as they happen in your environments. Looking at the tools we discussed today and the information I can glean from Scout, you can quickly see if any issues are application or environmentally based. As a hypothetical example, take a look at the Scout Dashboard (sign up for a trial here if you would like to see Scout in action and see similar graphs) below for the timestamp around 14:15.
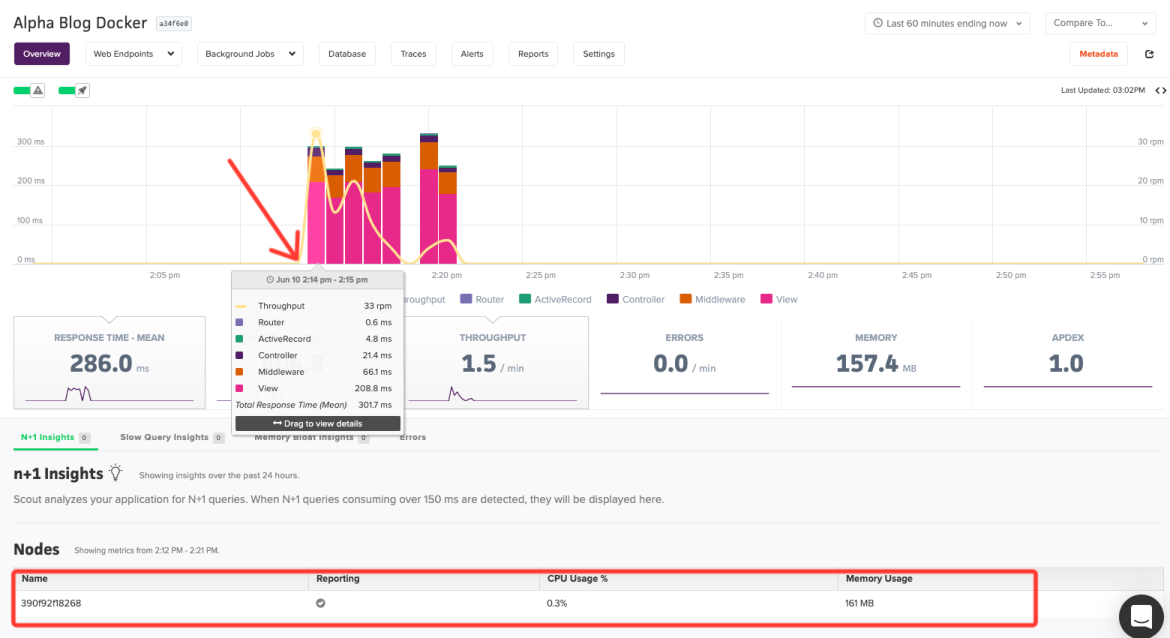
CPU usage over the time frame that will correspond to the chart below from our Prometheus monitoring setup.
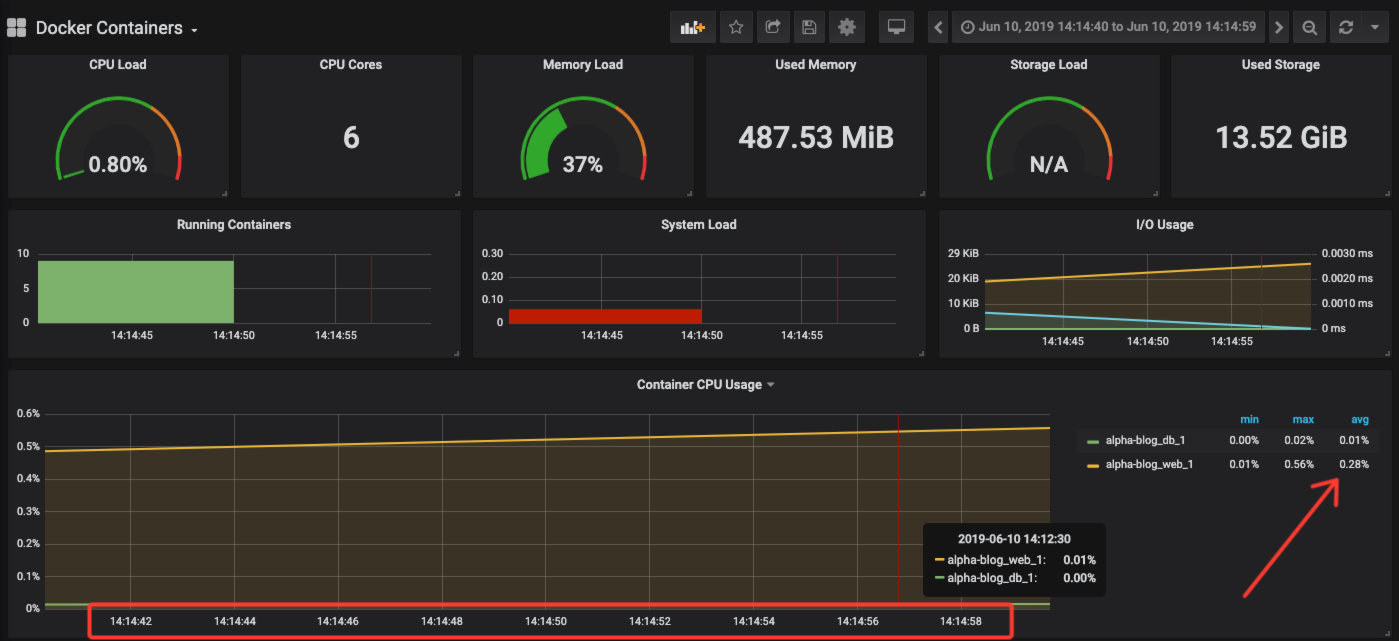
and then migrate to your Prometheus information and check to see the health of the server. Do you need more memory? More bandwidth, etc.
Next Steps:
There is still a ton of customization that you can do with these tools. This post is intended to help expose a different take on these tools and how you can start to visualize a monitoring strategy that works for your team or company. There is an infinite number of ways you can configure your environments, but at the end of the day, we firmly believe in one thing: Everyone needs monitoring. Period. The amount of a time a dialed in monitoring strategy can save your DevOps and engineering teams is worth the time and effort of the exercise.
What is your current monitoring setup? Can we help at all? We would love to help if we can. Sign up for a trial or contact us through our support channels (support@scoutapm.com or our community Slack channel).