Background
Python is not known to be a "fast" programming language. However, according to the 2020 Stack Overflow Developer Survey results, Python is the 2nd most popular programming language behind JavaScript (as you may have guessed). This is largely due to its super friendly syntax and its applicability for just about any purpose. While Python is not the fastest language out there, its great readability coupled with unrivaled community support and library availability has made it extremely attractive for getting things done with code.
Python's memory management plays a role in its popularity, too. How so? Python memory management is implemented in a way that makes our life easier. Ever heard of the Python memory manager? It is the manager keeping Python's memory in check, thus enabling you to focus on your code instead of having to worry about memory management. Due to its simplicity, however, Python does not provide you much freedom in managing memory usage, unlike in languages like C++ where you can manually allocate and free memory.
However, having a good understanding of Python memory management is a great start that will enable you to write more efficient code. Ultimately, you can enforce it as a habit that can potentially be adopted in other programming languages that you know.
So what do we get out of writing memory-efficient code?
- It leads to faster processing and less need for resources, namely random access memory (RAM) usage. More available RAM would generally mean more room for cache, which will help speed up disk access. The great thing about writing code that is memory-efficient is that it does not necessarily require you to write more lines of code.
- Another benefit is that it prevents memory leak, a problem which causes RAM usage to continuously increase even when processes are killed, eventually leading to slowed or impaired device performance. This is caused by the failure to free used memory after the processes terminate.
In the tech world, you may have heard that "done is better than perfect". However, say you have two developers who have used Python in developing the same app and they have completed it within the same amount of time. One of them has written a more memory-efficient code which results in a faster-performing app. Would you rather choose the app which runs smoothly or the one which noticeably runs slower? This is one good example where two individuals would spend the same amount of time coding and yet have noticeably different code performances.
Here's what you'll learn in the guide:
- How is Memory Managed in Python?
- Python Garbage Collection
- Monitoring Python Memory Issue
- Best Practices for Improving Python Code Performance
How is Memory Managed in Python?
According to the Python documentation (3.9.0) for memory management, Python's memory management involves a private heap that is used to store your program’s objects and data structures. Also, remember that it is the Python memory manager that handles most of the dirty work related to memory management so that you can just focus on your code.
Python Memory Allocation
Everything in Python is an object. For these objects to be useful, they need to be stored in the memory to be accessed. Before they can be stored in memory, a chunk of memory must first be allocated or assigned for each of them.
At the lowest level, Python's raw memory allocator will first make sure that there is available space in the private heap to store these objects. It does this by interacting with the memory manager of your operating system. Look at it as your Python program requesting your operating system for a chunk of memory to work with.
At the next level, several object-specific allocators operate on the same heap and implement distinct management policies depending on the object type. As you may already know, some examples of object types are strings and integers. While strings and integers may not be that different considering how much time we take to recognize and memorize them, they are treated very differently by computers. This is because computers need different storage requirements and speed tradeoffs for integers as compared to strings.
One last thing you should know about how Python's heap is managed is that you have zero control over it. Now you may be wondering, how do we then write memory-efficient code if we have so little control over Python's memory management? Before we get into that, we need to further understand some important terms concerning memory management.
Static vs. Dynamic Memory Allocation
Now that you understand what memory allocation is, it is time to familiarize yourself with the two types of memory allocation, namely static and dynamic, and distinguish between the two.
Static memory allocation:
- Like the word "static" suggests, statically allocated variables are permanent, meaning they need to be allocated beforehand and last as long as the program runs.
- Memory is allocated during compile time, or before program execution.
- Implemented using the stack data structure, meaning that variables are stored in the stack memory.
- Memory that has been allocated cannot be reused, thus no memory reusability.
Dynamic memory allocation:
- Like the word "dynamic" suggests, dynamically allocated variables are not permanent and can be allocated as a program is running.
- Memory is allocated at runtime or during program execution.
- Implemented using the heap data structure, meaning that variables are stored in the heap memory.
- Memory that has been allocated can be released and reused.
One advantage of dynamic memory allocation in Python is that we do not need to worry about how much memory we need for our program beforehand. Another advantage is that data structure manipulation can be done freely without having to worry about a need for higher memory allocation if the data structure expands.
However, since dynamic memory allocation is done during program execution, it will consume more time for its completion. Also, memory that has been allocated needs to be freed after it has been used. Otherwise, issues such as memory leaks may potentially occur.
We came across two types of memory structures above - heap memory and stack memory. Let's have a deeper look at them.
Stack memory
All methods and their variables are stored in the stack memory. Remember that stack memory is allocated during compile time? This effectively means that access to this type of memory is very fast.
When a method is called in Python, a stack frame is allocated. This stack frame will handle all the variables of the method. After the method is returned, the stack frame is automatically destroyed.
Note that the stack frame is also responsible for setting the scope for the variables of a method.
Heap memory
All objects and instance variables are stored in the heap memory. When a variable is created in Python, it is stored in a private heap which will then allow for allocation and deallocation.
The heap memory enables these variables to be accessed globally by all your program’s methods. After the variable is returned, the Python garbage collector gets to work, the workings of which we’ll cover later.
Now let’s take a look at Python’s memory structure.
Python has three different levels when it comes to its memory structure:
- Arenas
- Pools
- Blocks
We’ll start with the biggest of them all - arenas.
Arenas
Imagine a desk with 64 books covering its whole surface. The top of the desk represents one arena that has a fixed size of 256KiB which is allocated in the heap (Note that KiB is different from KB, but you may assume that they are the same for this explanation). An arena represents the largest possible chunk of memory.
More specifically, arenas are memory mappings that are used by the Python allocator, pymalloc, which is optimized for small objects (less than or equal to 512 bytes). Arenas are responsible for allocating memory, and therefore subsequent structures do not have to do it anymore.
This arena can then be further broken down into 64 pools, which is the next biggest memory structure.
Pools
Going back to the desk example, the books represent all the pools within one arena.
Each pool would typically have a fixed size of 4Kb and can have three possible states:
- Empty: The pool is empty and thus available for allocation.
- Used: The pool contains objects which cause it to be neither empty nor full.
- Full: The pool is full and thus not available for any more allocation.
Note that the size of the pool should correspond to the default memory page size of your operating system.
A pool is then broken down into many blocks, which are the smallest memory structures.
Blocks
Returning to the desk example, the pages within each book represent all the blocks within a pool.
Unlike arenas and pools, the size of a block is not fixed. The size of a block ranges from 8 to 512 bytes and must be a multiple of eight.
Each block can only store one Python object of a certain size and have three possible states:
- Untouched: Has not been allocated
- Free: Has been allocated but was released and made available for allocation
- Allocated: Has been allocated
Note that the three different levels of a memory structure (arenas, pools, and blocks) that we discussed above are specifically for smaller Python objects. Large objects are directed to the standard C allocator within Python, which would be a good read for another day.
Python Garbage Collection
Garbage collection is a process carried out by a program to release previously allocated memory for an object that is no longer in use. You can think of garbage allocation as memory recycling or reusing.
Back in the day, programmers had to manually allocate and deallocate memory. Forgetting to deallocate memory would lead to a memory leak, leading to a drop in execution performance. Worse, manual memory allocation and deallocation are even likely to lead to accidental overwriting of memory, which can cause the program to crash altogether.
In Python, garbage collection is done automatically and therefore saves you a lot of headaches to manually manage memory allocation and deallocation. Specifically, Python uses reference counting combined with generational garbage collection to free up unused memory. The reason why reference counting alone does not suffice for Python because it does not effectively clean up dangling cyclical references.
A generational garbage collection cycle contains the following steps -
- Python initializes a "discard list" for unused objects.
- An algorithm is run to detect reference cycles.
- If an object is missing outside references, it is inserted into the discard list.
- Frees up memory allocation for the objects in the discard list.
To learn more about garbage collection in Python, you can check out our Python Garbage Collection: A Guide for Developers post.
Monitoring Python Memory Issues
While everyone loves Python, it does not shy away from having memory issues. There are many possible reasons.
According to the Python (3.9.0) documentation for memory management, the Python memory manager does not necessarily release the memory back to your operating system. It is stated in the documentation that "under certain circumstances, the Python memory manager may not trigger appropriate actions, like garbage collection, memory compaction or other preventive measures."
As a result, one may have to explicitly free up memory in Python. One way to do this is to force the Python garbage collector to release unused memory by making use of the gc module. One simply needs to run gc.collect() to do so. This, however, only provides noticeable benefits when manipulating a very large number of objects.
Apart from the occasionally erroneous nature of the Python garbage collector, especially when dealing with large datasets, several Python libraries have also been known to cause memory leaks. Pandas, for example, is one such tool on the radar. Consider taking a look at all the memory-related issues in the pandas official GitHub repository!
One obvious reason that may slip past even the keen eyes of code reviewers is that there are lingering large objects within the code which are not released. On the same note, infinitely growing data structures is another cause of concern. For example, a growing dictionary data structure without a fixed size limit.
One way to solve the growing data structure is to convert the dictionary into a list if possible and set a max size for the list. Otherwise, simply set a limit for the dictionary size and clear it whenever the limit is reached.
Now you may be wondering, how do I even detect memory issues in the first place? One option is to take advantage of an Application Performance Monitoring (APM) tool. Additionally, many useful Python modules can help you track and trace memory issues. Let’s look at our options, starting with APM tools.
Application Performance Monitoring (APM) Tools
So what exactly is Application Performance Monitoring and how does it help in tracking down memory issues? An APM tool allows you to observe real-time performance metrics of a program, enabling continuous optimization as you discover issues that are limiting performance.
Based on the reports generated by APM tools, you will be able to have a general idea about how your program is performing. Since you can receive and monitor real-time performance metrics, you can take immediate action on any problems observed. Once you have narrowed down the possible areas of your program which may be the culprits for memory issues, you can then dive into the code and discuss it with the other code contributors to further determine the specific lines of code that need to be fixed.
Tracing the root of memory leak issues itself can be a daunting task. Fixing it is another nightmare as you need to truly understand your code. If you ever find yourself in that position, look no further because ScoutAPM is a proficient APM tool that can constructively analyze and optimize your application’s performance. ScoutAPM gives you real-time insight so you can quickly pinpoint & resolve issues before your clients may spot them.
Profile Modules
There are many handy Python modules that you can use to solve memory issues, whether it is a memory leak or your program crashing due to excessive memory usage. Two of the recommended ones are:
Note that only the tracemalloc module is built-in so be sure to first install the other module if you would like to use it.
tracemalloc
According to the Python (3.9.0) documentation for tracemalloc, using this module can provide you with the following information:
- Traceback where an object was allocated.
- Statistics on allocated memory blocks per filename and per line number: total size, number, and the average size of allocated memory blocks.
- Compute the difference between two snapshots to detect memory leaks.
A recommended first step that you should do in determining the source of the memory issue is to first display the files allocating the most memory. You can easily do this using the first code example shown in the documentation.
This however does not mean that files that allocate a small amount of memory will not grow indefinitely to cause memory leaks in the future.
memory_profiler
This module is a fun one. I have worked with this and it’s a personal favorite because it provides the option to simply add the @profile decorator to any function that you wish to investigate. The output given as a result is also very easily understood.
Another reason which makes this my personal favorite is this module enables you to plot a graph of time-based memory usage. Sometimes, you simply need a quick check to see if memory usage continues to increase indefinitely or not. This is the perfect solution for that as you do not need to do a line-by-line memory profiling to confirm that. You can simply observe the plotted graph after letting the profiler run for a certain duration. Here’s an example of the graph that is output -
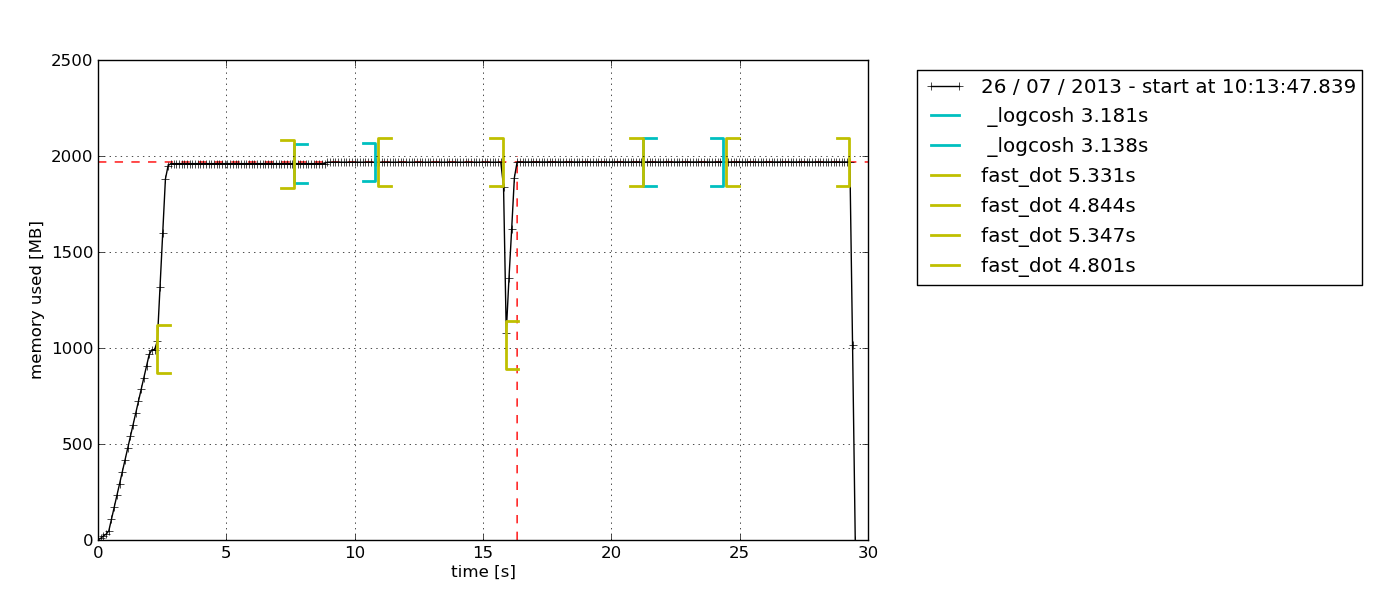
According to the description in the memory-profiler documentation, this Python module is for monitoring memory consumption of a process as well as a line-by-line analysis of the same for Python programs. It is a pure Python module that depends on the psutil library.
I recommend reading this Medium blog to further explore how memory-profiler is used. There you will also learn how to use another Python module, muppy (the latest one is muppy3).
Best Practices for Improving Python Code Performance
Enough of all the details on memory management. Now let us explore some of the good habits in writing memory-efficient Python code.
Take advantage of Python libraries and built-in functions
Yes, this is a good habit that may quite often be overlooked. Python has unrivaled community support and this is reflected by the abundant Python libraries available for just about any purpose, ranging from API calls to data science.
If there is a Python library out there which enables you to do the same thing as what you have already implemented, what you can do is to compare your code performance when using the library compared to when using your custom code. Chances are, Python libraries (especially the popular ones) will be more memory-efficient than your code because they are continuously improved based on community feedback. Would you rather rely on code that was crafted overnight or one that has been rigorously improved for an extended period?
Best of all, Python libraries will save you many lines of code so why not?
Not using "+" for string concatenation
At some point, we have all been guilty of concatenating strings using the "+" operator because it looks so easy.
Note that strings are immutable. Hence, every time you add an element to a string with the "+" operator, Python has to create a new string with a new memory allocation. With longer strings, the memory inefficiency of the code will become more pronounced.
So instead of using the "+" operator to join strings together, you should consider using the .join() method, str.format(), or %-formatting.
Using itertools for efficient looping
Looping is an essential part of automating stuff. As we continue to use loops more and more, we will eventually find ourselves having to use nested loops, which are known to be inefficient due to their high runtime complexity.
This is where the itertools module comes to the rescue. According to Python’s itertools documentation, "The module standardizes a core set of fast, memory-efficient tools that are useful by themselves or in combination. Together, they make it possible to construct specialized tools succinctly and efficiently in pure Python."
In other words, the itertools module enables memory-efficient looping by getting rid of unnecessary loops. Interestingly, the itertools module is called a gem as it enables composing elegant solutions for a myriad of problems.
I’m pretty sure you will be working with at least one loop in your next piece of code so try implementing itertools then!
Recap and Closing Thoughts
Applying good Python memory management habits is not for the casual programmer. If you usually get by with simple scripts, you should not run into memory-related issues at all. Thanks to hardware and software that continue to undergo rapid advancement as you read this, the base model of just about any device out there, regardless of their brands, should run everyday programs just fine. The need for memory-efficient code only starts to show when you start working on a big codebase, especially for production, where performance is key.
However, this does not suggest that memory management in Python is a difficult concept to grasp, nor does this mean that it is not important. This is because the emphasis on application performance is growing each day. One day, it will not just be a mere question of "done" anymore. Instead, developers will be competing to deliver a solution that is not only capable of successfully solving customers' needs but also does it with blazing speed and minimal resources.