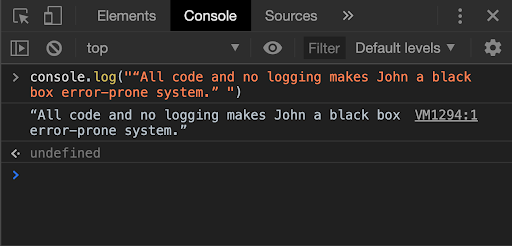
“All code and no logging makes John a black box error-prone system.”
Logging is a key aspect of monitoring, troubleshooting and debugging your code.
Not only does it make your project’s underlying execution more transparent and intelligible, but also more accessible in its approach. In a company or a community setting, intelligent logging practices can help everyone to be on the same page about the status and the progress of the project.
In this post, we’ll see how we can refine our PHP web development practices by understanding the importance of logging to the browser console. We’ll see how logging is natively supported in PHP, and how doing it in the browser console has more to offer than printing logs on webpages or writing logs to files.
Use these links to navigate:
- Background - Logging in PHP
- The Basics of Browser Console Logging
- How Console Logging Can be Done in PHP
- Why You Should be Logging to Console
- Wrapping it up
Background - Logging in PHP
More than 25 years since its creation, PHP is still one of the most widely used programming languages in the world, accounting for about 78% of the known internet.
Though when I started programming in PHP, I realized that my background in Javascript had not prepared me for this. I was so used to working with the browser’s console for debugging, that having to work with PHP’s native logging support couldn’t fill that void. But there was hope!
Before that, let’s see how PHP natively supports logging and debugging.
PHP can be used for logging through two primary ways -
- By either writing to log files on the disk or
- By displaying variable values on web-pages using echo and var_dump.
Both these options can prove to be restrictive.
Though static log files help in a retrospective analysis of how the execution unfolded, they can in some sense deprive you of the rich real-time experience of monitoring the dynamics of a modern website bustling with network requests and socket connections.
Also, there is only so much information that you can log onto your web-page without disrupting it’s design. Conventional logging mechanisms possible in PHP can, therefore, seem less viable for more extensive, dynamic websites.
The aforementioned issues restrict logging capabilities not only for PHP but for any language that was going to be used for web development in the future.
Modern browsers came to the rescue and realized the importance of providing developers with the necessary tools to make way for some easy, yet powerful logging and debugging support. These are also known as the Developer Tools and can be accessed by right-clicking on the web-page and selecting the ‘Inspect’ option.
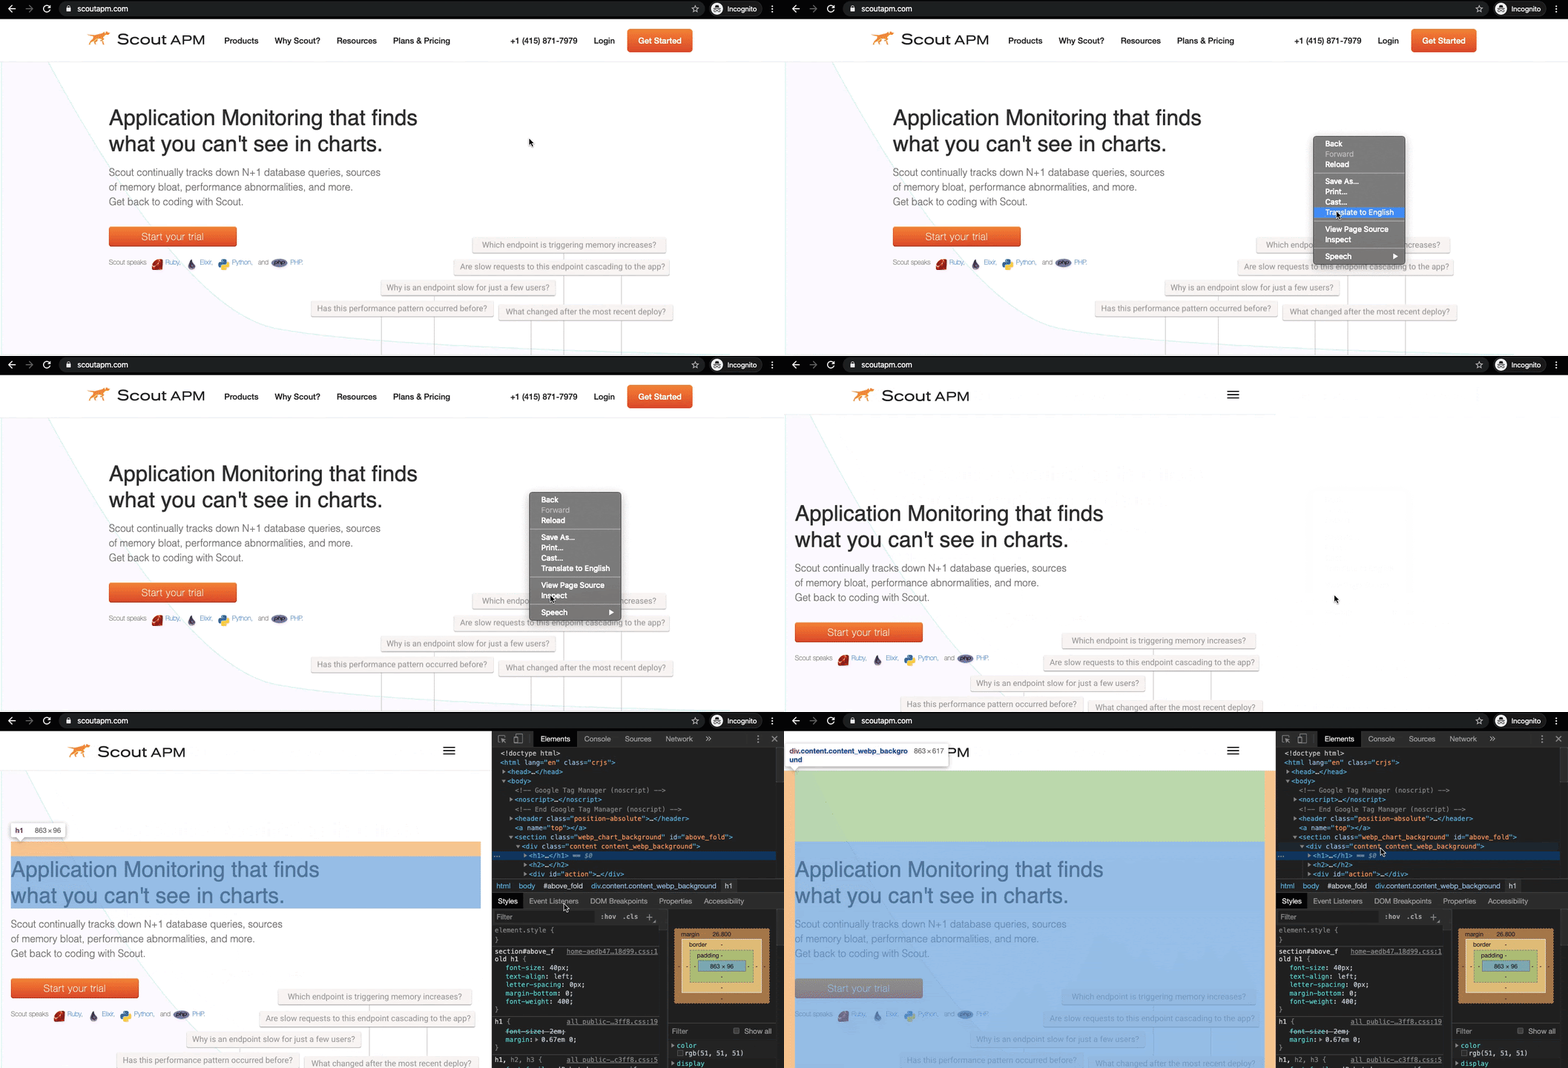
These tools allow you to inspect the DOM object, monitor network requests and responses, page load times, website performance, memory consumption and so much more.
One of these Developer Tools, known as the browser’s console allows you to log messages and run Javascript code to debug your application. Let’s see how we can use that to our advantage.
The Basics of Browser Console Logging
When something goes wrong on a website, usually the user is shown a fancy error message about what happened.
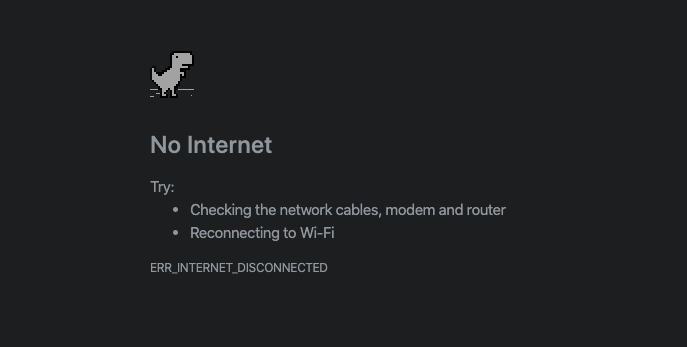
But a web developer’s window to what might have gone wrong is the browser’s Dev Tools - primarily the browser console.
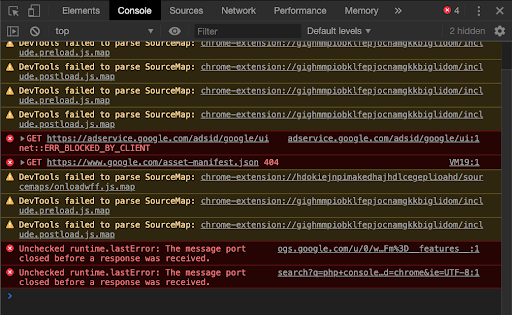
What is a browser console?
The browser console, as the name suggests, is a console in the browser.
Just as you can run Python or Node.js code on a console in your terminal, and print results and log errors, the console in your browser allows you to run Javascript code and log information pertinent to your website.
Let us understand this through an example. Let’s say you created an online messaging platform and due to some unknown reason, users on your website weren’t able to receive messages from their friends. Now in such a case, it would be handy to have a clear-cut logging system in place that could help you put a finger on what went wrong and where. The following is an example of a log:
- Database connected
- Fetching user’s friends
- Processing data
- Rendering data
- Opening socket connection
- Successful socket connection
- Sending a message on channel
- Received a message on channel
- Rendering message
- [ERROR IN RENDERING MESSAGE]
As shown in the above example, well-implemented logs would help you figure out that even though the message content was received, it was in rendering it that your code failed. Now you can go ahead and directly jump to the relevant portion of your code and make the necessary changes.
You can print information to the console by using the console.log() method.
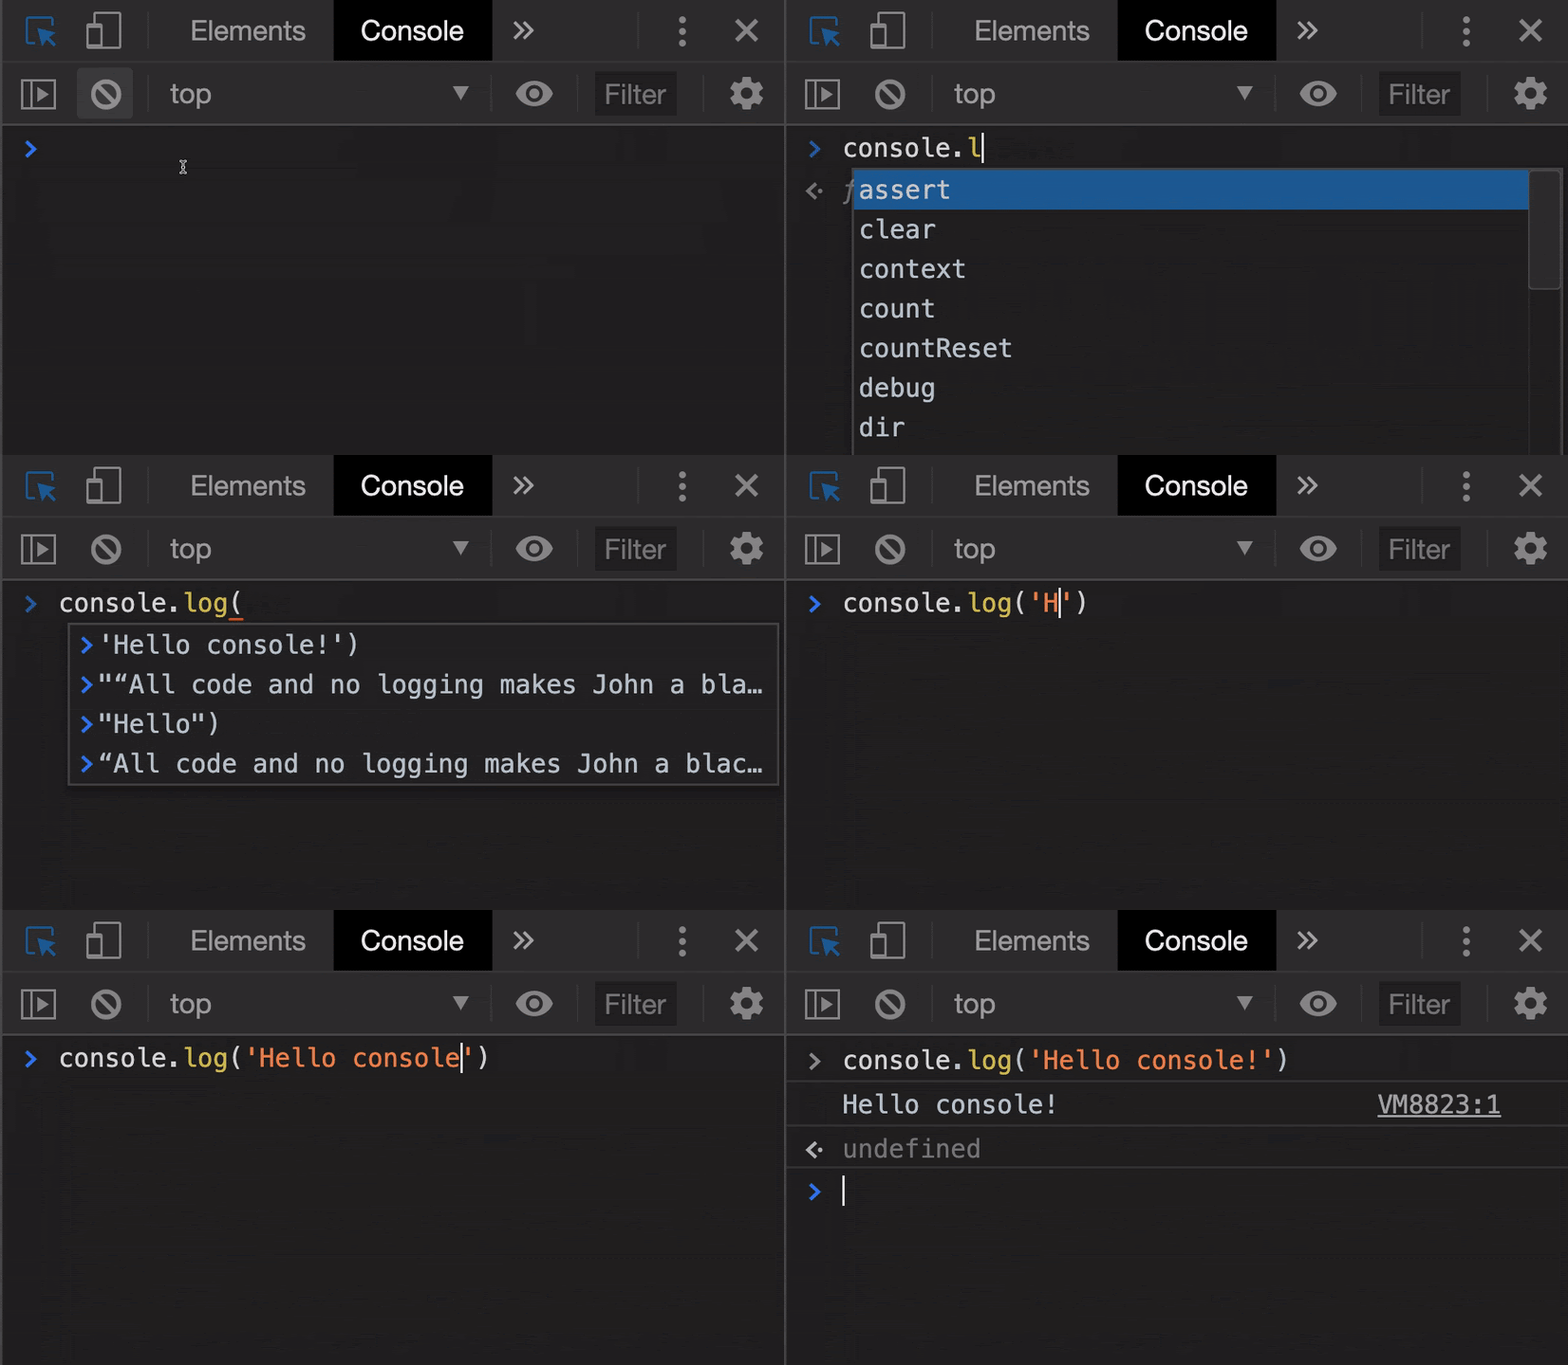
Depending on the requirement, other methods of the console object can also be used -
- console.info()
- console.debug()
- console.warn()
- console.error()
Where is it?
In Google Chrome, you can access the browser console by either using Cmd + Shift + C (Ctrl + Shift + C on Windows, Linux) or by navigating to the ‘Console’ tab in the Dev Tools after selecting the ‘Inspect’ menu option.
How Console Logging Can be Done in PHP
Despite PHP’s supremacy, the fact that all modern browsers chose Javascript as the browser interpreter language meant that the only way PHP code logs could make it to the browser’s console was going to be through custom helper functions. These functions can call Javascript’s console.log() by echoing it to the required webpage.
// code for connecting to database
echo 'console.log("Database connected!")';
This is the basis of how one can utilize the capabilities of a JS-based browser console for a PHP-based environment.
Let’s look at how we can make use of the above to log more often and more flexibly:
- Using json_encode()
The above example was just to print hard-coded message strings that informed about the status and progress of a certain subtask.
It is also very common to debug by logging data variables, such as to request parameters, JSON (Javascript Object Notation) responses, processed outputs, etc. Let us see how we can print a PHP array to the browser console.
<!-- app.php -->
<!DOCTYPE html>
<html>
<?php
   $my_arr = array(1,2,3);
   echo '<script>';
   echo 'console.log('. json_encode($my_arr, JSON_HEX_TAG) .')';
   echo '</script>';
?>
</html>
CONSOLE OUTPUT:

The json_encode() function converts the PHP variable into a JSON object that can be parsed by Javascript for printing to the console. Our pretty PHP file is converted by the browser to the following HTML markup -

(inspected from the ‘Sources’ section of the Developer Tools)
The json_encode() function can be used for converting any PHP data type to a Javascript compatible notation.
Instead of writing the corresponding echo statement each time we want to log something to the console, we can make a function for the same as such -
function console_log($data, $add_script_tags = false) {
    $command = 'console.log('. json_encode($data, JSON_HEX_TAG).');';
    if ($add_script_tags) {
        $command = '<script>'. $command . '</script>';
    }
    echo $command;
}
The above function can be used however we like depending on if we want the enclosing <script> tags to be added automatically or not.
$myarr = array(1,2,3);
$database_connected = True;
$request_status = "pending";
echo '<script>';
console_log($myarr);
if ($database_connected) {
    console_log("Database connected.");
}
console_log("Request status: ".$request_status);
echo '</script>';
CONSOLE OUTPUT:

Using PHP libraries to console log
If you want to outsource this logging middleware code to a helper Open Source library that allows more functionality, then you can look at something like PHPConsole or PHPDebugConsole.
PHPConsole is more popular on Github but is a little old, and less frequently updated. It works with a browser extension (for Chrome) to log information to the browser console. Code and installation instructions can be found here.
On the other hand, PHPDebugConsole, though it has only 34 stars on Github, is more frequently maintained and has better documentation. Code, installation information and usage instructions of the library can be found here.
By default, it outputs logs on the web-page in an organized fashion. Here is a usage example provided on their website that shows how easy it is to get started with logging using PHPDebugConsole.
<?php
require __DIR__.'/vendor/autoload.php';  // if installed via composer
// require 'path/to/Debug.php';   	   // if not using composer

$debug = new \bdk\Debug(array(
	'collect' => true,
	'output' => true,
));

$debug->log('hello world');
Below is an example of HTML output from their website.
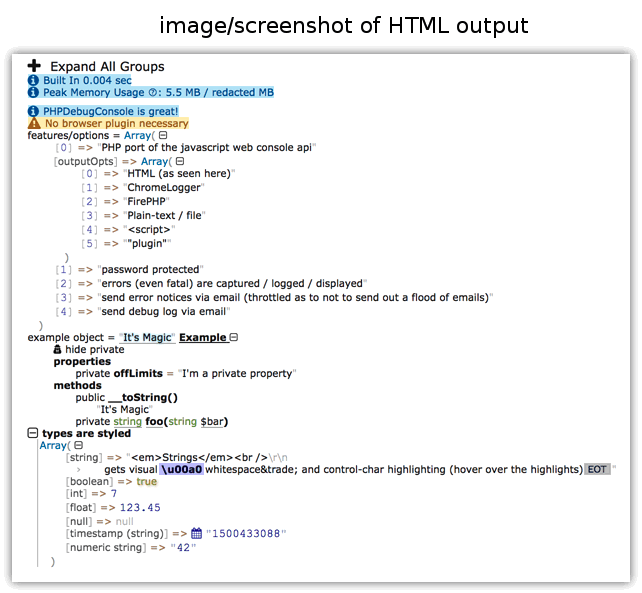
They also provide support for logging to the browser’s console by installing certain extensions.
If you are working on a small scale personal project, in my opinion, nothing would match the simplicity of using your custom json_encode() based helper function. It would save you from taking care of the external dependencies and browser cross-compatibility.
Why You Should be Logging to Console
Convenience
Logging to the browser console certainly has a convenience factor. It is easier for a developer to have the errors logged right next to the web-page’s display. This way the developer only has to switch between the IDE and the browser as compared to having a log file open on the side that is more likely to not be auto-refreshing.
Real-time monitoring of results
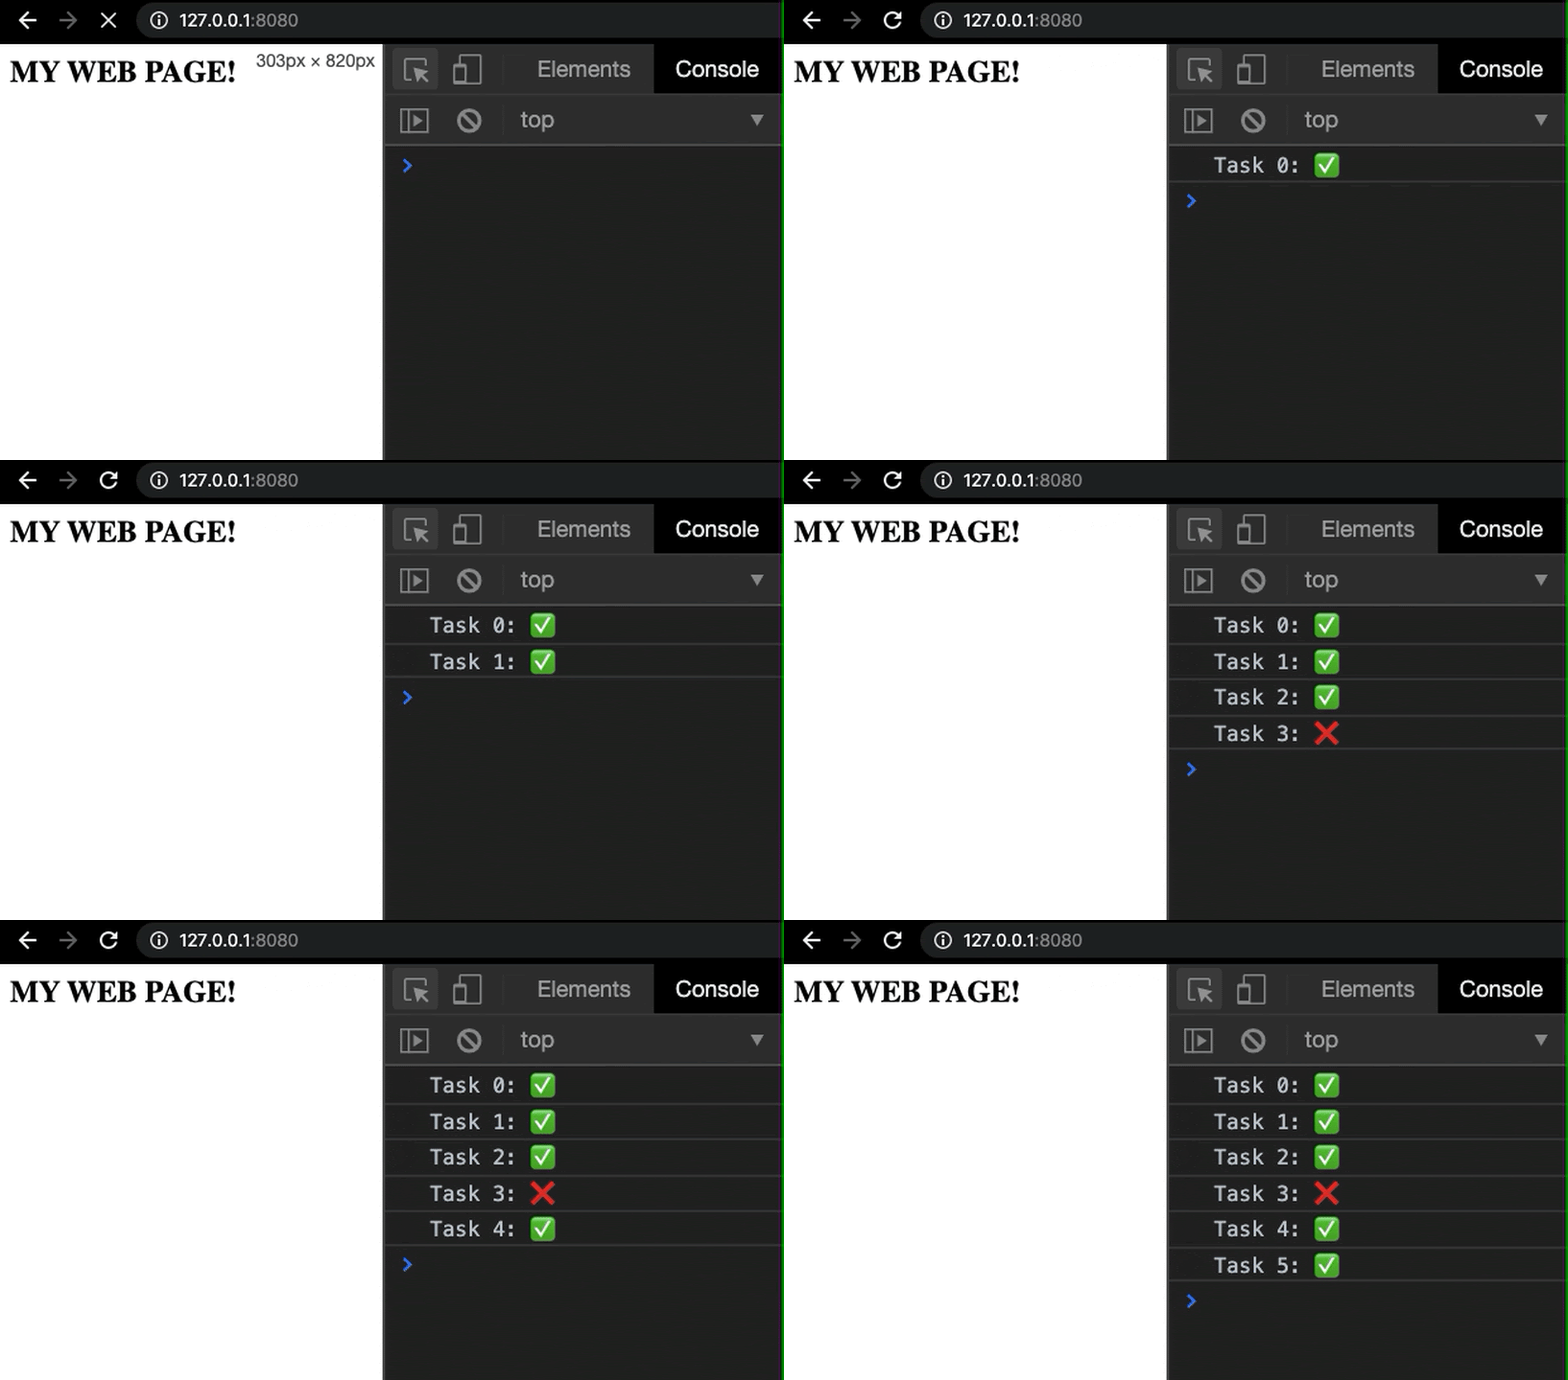
Since a major portion of a website’s functioning is the web-page’s display and content rendering, it is important for the developer to be able to monitor the logs and the web site's performance in real-time as the web-page unfolds and as the user interacts with the website. This synchrony can make way for new insights about how the website is performing and about relevant improvements that can be made.
Saves you from going through hefty static log files
Even though in many cases it is important to track and maintain log files for large-scale projects to analyze and assess performance, it can be slightly disappointing to realize that in PHP it is the only logging support that the language provides. For less important debugging logs, it can be nice to have a console that displays results as and when required.
Doesn’t mess with webpage
PHP’s echo and var_dump can be sometimes used to log and monitor data on the web page. But like we discussed before it disrupts your web page's display, affects user experience and is not a good practice for extensive projects. Below is an example -

The fact that a separate browser console window can be used for displaying the logs means that developers don’t need to worry about distorting the web-page layout or about the formatting of their logs.
Wrapping it up
In this post, we realized the importance of having a good logging system in place for your application, be it small or large. We saw how PHP natively allows debugging and logging, and how we can utilise the browser console for the same. We saw how we can echo Javascript’s console.log() calls to write to the console using the json_encode() function. We also saw some Open Source frameworks that can help us log to the console. In the end, we boiled down the benefits of logging to a console into four points that can convince us to adopt the aforementioned logging practices into our web development routines, on the road to more efficient coding.
Happy coding!


