When visiting a new website, it is quite normal to get carried away by the bells and whistles of the fancy UI and UX and not be able to appreciate all the lower level, back-end code that runs tirelessly to ensure a smooth and fast website experience. This is because your front-end HTML code has a visually rich browser page interface as a platform to showcase its output. Whereas your back-end, server-side code usually only has a console at its disposal. The console is the only window to the execution of your back-end code. And the only way we can effectively utilize this console is by extensively, yet intelligently logging information in our application.
Logging is the practice of keeping track of events that take place over the course of your application’s life. It allows you to record important information about its execution to keep track of its correctness, accuracy, quality, and overall performance.
Logging plays an integral role throughout the whole pipeline of any software application: from development to testing to releasing for production, a well-implemented logging system allows you to understand the various aspects of your application’s performance.
In this post, we will first talk about the importance of logging in web applications and about the most common, practical use cases where it would be a good idea to implement logging. Then we will discuss how we can implement logging in Node.js: about the different levels and functions of logging, about how they work under the hood, and the different places in which we can output our logs. To understand from a real-life example, we will also create a basic Express.js based server application and set up a basic logging system in it. Since implementing an extensive, fully functional logging system can be a daunting task if you are just starting out, we will also learn to use one of the most popular third-party open-source logging frameworks for Node.js - Winston, that can ease off your burden and provide a great deal of flexibility in logging.
If you haven’t already been logging in your code, by the end of this post, you should be convinced about its importance and be able to easily implement it in your Node.js application.
Here’s an outline of what we’ll be covering in this post so you can navigate the guide or skip ahead in the tutorial:
- Why Is Node.js Logging Important?
- What and When to Log: Use Cases for Logging
- How to Log: Various Logging Methods in Node.js
- How Node.js Logging Works Under The Hood ⚙️
- Where to Log 📝
- Logging in an Express.js Server App
- Third-Party Logging Frameworks - Winston 👨🏻🔧
- Recap and Summary 🔁
Let’s get started!
Why Is Node.js Logging Important? 🖨
Logging in Programming Languages]
Before we talk about logging in Node.js based web applications, let us look into how we directly benefit from well-implemented logging systems on a daily basis. Each time you write basic code in any programming language and make an error (for example, forgetting to close a parenthesis), you are encountered by a straightforward error message. It provides information about what the error is, where it happened, and (quite often) even about how it can be fixed.
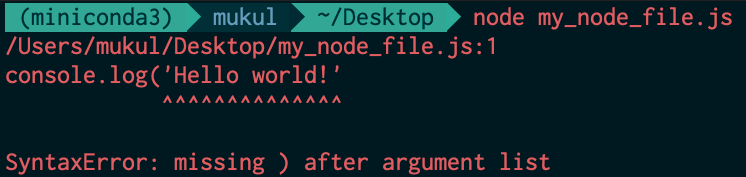
Example syntax error in Node.js
Thanks to excellent in-built logging systems in these programming languages, developers can be alerted about the weak links in their code through errors and warnings. If this wasn’t the case, it would take you ages of proof-reading your code to figure out why it didn’t output anything; you wouldn’t know about error occurrences right away, let alone where those errors happened and how they can be fixed.
[Logging in Web Applications]
If we talk about web applications, there’s a lot of work that goes behind the scenes to ensure a smooth, fast website experience. Your server needs to take care of a lot of stuff like serving web-pages, processing data, authenticating users, making API requests, performing database operations, and much more. It can be difficult to keep track of everything that’s going around in your back-end code without logging.

When developing small-scale personal projects, it, therefore, helps to log intermediate outputs, HTTP requests, responses, confirmation messages, and other information. This not only allows you to be able to understand and manage your application better but also makes debugging a whole lot easier. Similar is the case for large-scale applications where the server-side code is likely to be handling hundreds or thousands of such concurrent operations. If you don’t have appropriate logging set up, your system can seem to behave like a black box: if something goes wrong and your app fails, you will not know what happened and where it happened, thus making it difficult to make amends and get the application back on track.
Therefore, we need a way to be more in the loop as far as our application’s performance is concerned. Just like the browser web-page allows you to evaluate your front-end code, logging mechanisms enable you to receive updates and feedback information about the functioning of your back-end code.
All in all, logging in web applications allows you to be more aware of the proceedings of your code and it’s behavior. Like we discussed above, it is an integral aspect of web development across it’s complete lifecycle: from development to testing to production. During development, it allows you to quickly verify code behavior and debug small errors. During testing, it allows you to understand the failed cases, their locations, and reasons for failure. During production, it allows you to keep track of user analytics and make sense of that data. We will look at all these points in more detail in the next section.
What and When to Log: Use Cases for Logging
Now that we are fairly convinced about the importance of logging in our application, let us look at some use case scenarios in which logging can be extremely useful.
Quick debugging and verifying code behavior 🧼
When writing code, it can be helpful to keep track of its progress by intermittently logging the relevant output. This allows you to verify your application’s behavior and make sure that it is working as expected, at least during the development stage.
This can also help in exposing small mistakes in your code that can easily be debugged, thanks to intelligent log messages that can guide you to the part of the code where the error was localized.
By logging information and recording the progress at each significant intermediate checkpoint of our application, we can reduce the chances of letting through trivial bugs in our code during the preliminary stages of development.
Logging server requests and responses 🌐
Servers are constantly communicating over the internet through HTTP requests and responses. Messages carried over by these requests contain some information about (and from) the requester (your front-end code or some other server on the internet), like the HTTP method (GET, PUT, POST, etc), message body, content type, content length, requester’s remote IP address, timestamp and so much more. These requests can be easily decoded by web frameworks, allowing us to process its data and deal with it in our own way.
When your server receives this request packet, it can be useful to log its contents and take a glance at it. As we saw above, there are a bunch of items in the request object; but you might be interested in only a few of those. You can cherry-pick the ones relevant to your application and log them for each request to your server. You can also similarly log the response object generated by your server for each request when it is sent back. This allows you to inspect all the incoming requests and corresponding outgoing responses in real-time. This can make debugging HTTP data exchange a whole lot easier.
Later in the post, we will also look at some examples of logging server requests in Node.js.
Logging During Testing 🔬
Testing plays a very important role in the web development pipeline. It allows you to foolproof your code in a time-saving, automated, and therefore, more reliable way.
During testing, logging is a must because you need to log information about test suites, about each of its test cases, whether they passed or not, about expected values and about relevant warnings and error messages. These logs are also used to capture extra information like code coverage, speed performance, and the overall time taken. All testing frameworks (eg. Mocha, Jest) come equipped with in-built loggers that systematically output this information in an easily readable format.
Since most of us rely on efficient in-built or third-party libraries to carry out these tests, we can rest assured that they are capable of recording all the relevant information about our tests.
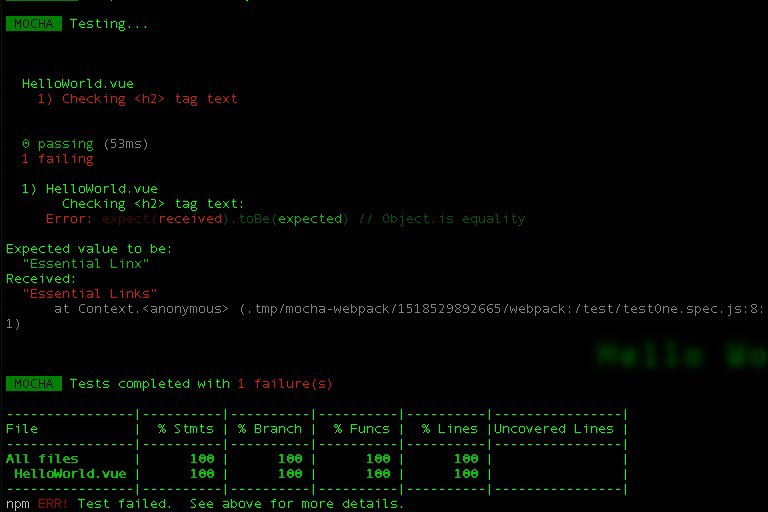
As you can see in the above example of test output, everything important related to your tests has been cleanly logged. This goes to show how useful a well-implemented logging system can be for getting a bird’s eye view of your application’s functioning and it’s code.
Analytics/diagnostics information about web app 📈 📊
For teams working on large-scale applications that are running in production, one of the main goals is to improve the user’s experience. For improving their products or services to better suit their customers’ needs, these teams need to better understand how their users interact with the application: about which pages or features are most commonly used, about the most commonly performed actions, etc. Besides, there should also be a focus on keeping track of the diagnostics data - about performance metrics, quality issues, bottlenecks, common errors, etc. and use that information to make the necessary changes and improvements.
Understanding both these aspects of your app’s performance requires a robust, well-implemented logging system that can effectively present coherent analytics and diagnostics information about your app. These logs can provide valuable insights about how your app is performing and how it can be improved. It can help you to direct your efforts towards improving the most important parts of your app, and therefore boost overall productivity.
You can take this to the next level by using proficient application monitoring (APM) tools like ScoutAPM to constructively analyze and optimize your website’s performance. ScoutAPM gives you real-time insight so you can quickly pinpoint & resolve issues before the customer ever sees them.
One more thing to note here about the advantages of logging is that it can benefit everyone in the team and not just web developers. Just like developers can glean debugging cues and benefit from lower-level jargony logs, project managers can make better sense of the higher-level telemetry-based analytics’ logs that give a bird’s eye view of the most used features and about how that information could be used to plan future updates and releases.
Now that we have a fair understanding of the very many use cases and advantages of logging, let’s dive into the implementation part of it, and look at how we can log stuff in Node.js.
How to Log: Various Logging Methods in Node.js 🧰
The most common way of logging in Node.js is by using the console.log() method.
console.log([data][, ...args])
As the object and function name reads, it logs the message to your console. This is the easiest method to get started with logging.
Let’s see how it works with a very basic example.
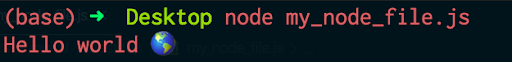
// my_node_file.js
var world_emoji = "🌎";
console.log("Hello world", world_emoji);
OUTPUT:
Node.js ships with certain variants of console.log() that we’d like to be familiar with. They can be divided into two types -
For logging general information and debugging -
console.log()console.info()console.debug()
For errors and warnings ⚠️ -
console.error()console.warn()
As their names suggest, these functions can be used for various purposes, depending on the type and severity (level) of the information to be logged.
However, if you use and compare both the console.log() and console.error() functions, you will notice that these functions work in the same way (at least) in the output they produce. Let’s see this in action through an example -
//my_node_file.js
console.log("Hello log!")
console.error("Hello error!")
OUTPUT:
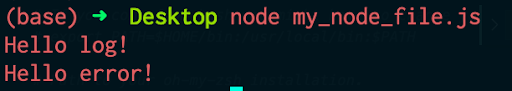
As you can see, there is no visible difference in the way these two functions display the log messages. Both the aforementioned set of functions (general logging-based and error-based) are, therefore, similar for the most part, except for two notable differences -
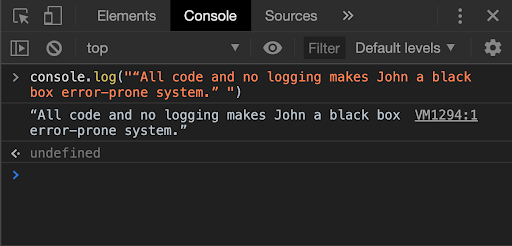
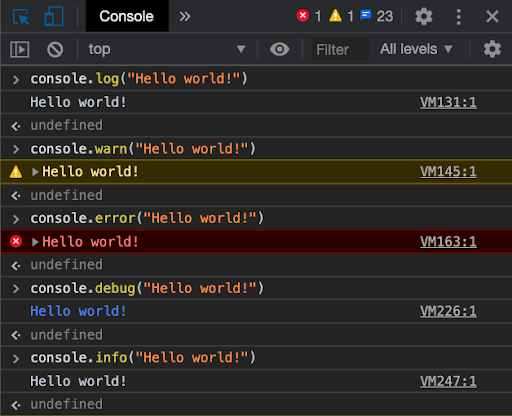
- If you prefer these logging functions to output the information differently, you can run them directly in the browser’s console or through your website’s Javascript code. This provides some fancy text-color highlighting that makes it visually easier to differentiate between the different logging levels. Additionally, the browser console also allows you to filter the log messages based on their level.
Logging in browser console
2. Understanding the second difference between general purpose and error-based logging functions requires an understanding of how these functions work under the hood. Let’s look at that in the next section.
How Node.js Logging Works Under The Hood ⚙️
If you are familiar with Node.js, you might know what streams are. For those of you who don’t know, streams in Node.js are objects that allow you to handle your data-read and write operations in a sequential manner. Instead of reading or writing the data all at once, these operations are performed piece by piece, in small chunks.
Processes in Node.js have access to three such streams - stdin, stdout, and stderr. As the name suggests, the stdin stream is for dealing with the input to the process (example - keyboard or mouse input). On the other hand, stdout and stderr are output streams for writing the output to the console or a separate file. The stderr stream has been reserved exclusively for error messages and warnings.
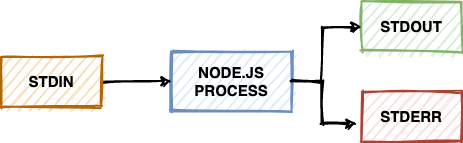
When you use the general-purpose logging methods - console.log(), console.info(), and console.debug(), they output to the conventional stdout stream. Whereas if you use the error and warning based methods - console.error() and console.warning(), they output to the stderr stream.
The design decision behind having two separate streams for different kinds of logs has benefited developers a lot. Thanks to it, we can maintain our logs more cleanly by keeping the general logs separate and clear from the error and warning logs. Even though sometimes we might want these logs to be in one place (for example, when we are interested in the events’ sequence of occurrence), having the flexibility to be able to segregate these logs based on their type always comes in handy.
We will see how we can take advantage of these two separate streams for better logs’ maintenance in the next section.
Where to Log 📝
When we run a node application from our command line, using node my_node_file.js, the logs are by default output to the command line itself. We saw this in one of the previous examples as well.

This might be helpful when you want to view the log messages in real-time.
But for most large-scale applications, where your server is concurrently catering to hundreds or thousands of requests, it becomes humanly impossible to keep track of the raw log messages as they inundate your CLIs. It is therefore considered to be a good practice to store your logs in separate files. This is a much more viable alternative as it makes it easier to maintain these records and therefore simplifies the process of monitoring and analyzing your application’s overall performance.
Let’s see how we can store the logged outputs to specific files instead of having them printed on the command line. Here is our Node.js file -
// my_node_file.js
var world_emoji = "🌎";
console.log("Hello world", world_emoji);
console.error("Hello world error ⚠️");
Now if we want to output our message to a specific log file, we need to use the redirect operator ‘ > ’ when we run the file, as shown below -
node my_node_file.js > my_log.log
OUTPUT:
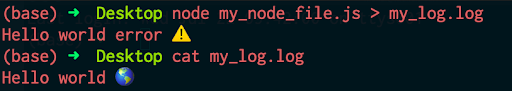
As you can see, our console.log() message was logged to the specified file. The thing to note here is that the console.error() message was not logged to that file. Instead, it was printed on the command line.
The reason for this is that the redirect operator ‘ > ’ is only used to redirect the stdout stream’s output (from the console.log() function) to a file. As a result, the stderr stream’s output (from the console.error() function) was not redirected to this file.
If we want to record the error logs in a file, we need to use the ‘ 2> ’ operator for capturing the stderr stream output to the file. If we were to capture both the log types in the previous example, we can use the command shown below -
node my_node_file.js > my_log.log 2> my_error_log.log
OUTPUT:
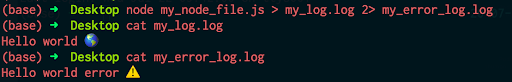
We can see how the above log messages were recorded in separate files.
As we discussed above, this differentiation allows us to maintain and process our general logs and error logs separately.
Now that we know quite a bit about the ‘how’, ‘what’, ‘where’ and ‘when’ of logging, let us write some server-side code in Node.js and learn by logging a few things for a dummy back-end application.
Logging in an Express.js Server App
Express.js is the most popular web application framework for Node.js. It is light-weight, robust, and provides a simple, minimal interface to easily get started with writing server-side code for your application. In this section, we’ll create a basic server and learn by logging a few things.
Let us first get a basic Express.js server up and running. To get started you can initialize an npm project and install Express.js (and other) dependencies using the following commands -
npm init # initialise npm project
npm install --save express # install Express.js dependencies
Then we can create a file index.js and write the following code to start the server.
// index.js
var express = require('express'); // importing library
var app = express(); // initialising app
var PORT = 3000; // server port

app.get('/', function(req, res){ // dummy GET route
  res.send("Hello world! 🌎");
});

app.listen(PORT, () => { // start server
  console.log('Server running on port %d! 🚨', PORT);
});
OUTPUT:
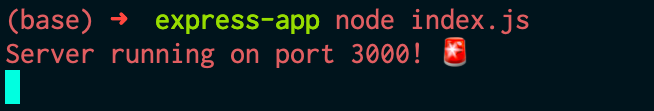
Server output
As you can see, we are able to successfully log that the server has been started. This is one of the most basic things that we can log in to our application.
For the intrepid developer, Express.js also exposes certain additional lower-level log messages that can be helpful for debugging and understanding how the server runs under the hood. As per their documentation, we can get access to this additional information by using the following command -
DEBUG=express:* node index.js
Side note: This is made possible thanks to the renowned npm debug package.
OUTPUT:
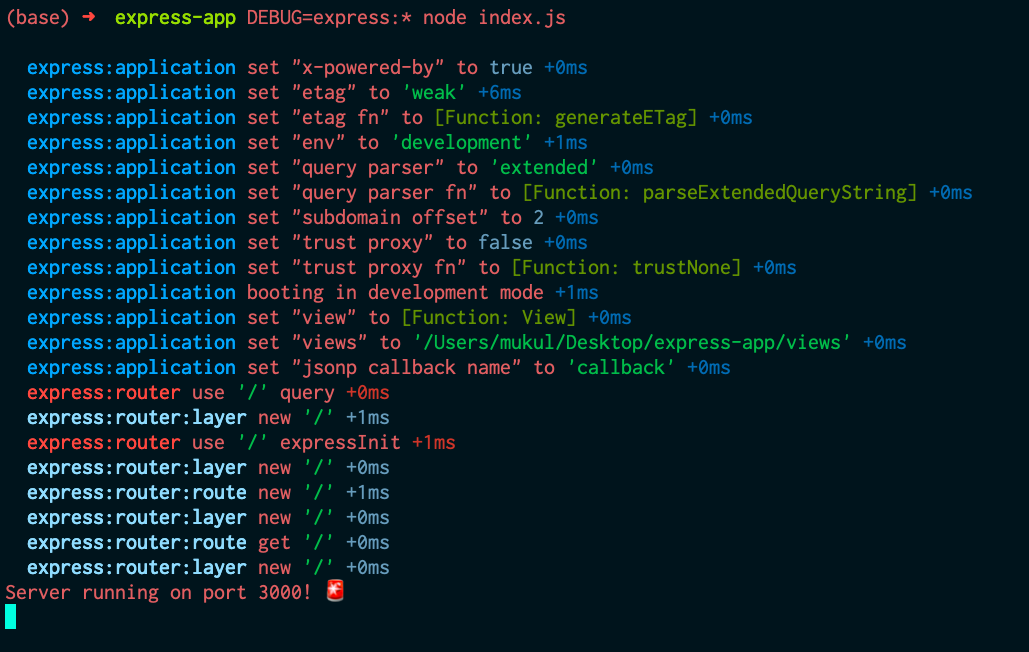
This output is just a glimpse of everything that goes behind the scenes when you start your server. All this extra information is only required if you want to get into the lower-level specifics of how things work. So, for most cases, we can turn this off and proceed with the conventional approach.
Coming back to the basic Express.js code we wrote - let’s try to make some requests to our server and log them from our code. As you can see in our code, we have also created a simple GET route (‘/’) in our server. Now to it’s handler function, let’s add some code for logging the request object.
app.get('/', function(req, res){ // dummy GET route
  console.log(req);
  res.send("Hello world! 🌎");
});
Now restart your server for the changes to take effect.
When you visit the ‘/’ route of your server ( localhost:3000 ), your server will log the whole request object to the console.
OUTPUT:
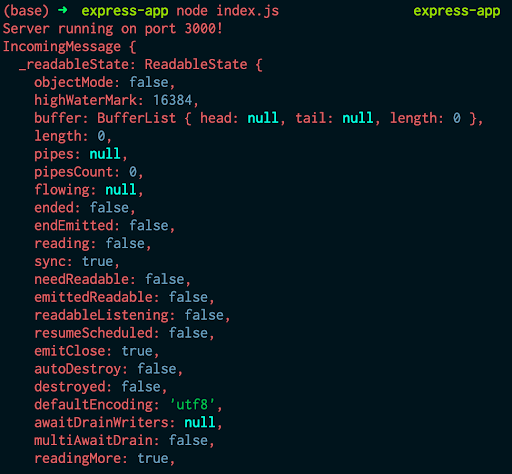
What has been shown above is only a very small snippet of the whole output. As you can see, most of the information here is not useful for us. We might be interested in deconstructing this object and logging a more relevant subset of this that contains information about -
- Request headers
- Request query params
- Request path (or route)
- Timestamp
Let’s see how we can naively log these from our handler function.
app.get('/', function(req, res){ // dummy GET route

  var timestamp = new Date(); // getting current timestamp

  console.log('Timestamp:', timestamp);
  console.log('Request Headers:', req.headers);
  console.log('Request Query Params:', req.query); // for all query params
  console.log('Request Path:', req.path);
  console.log('Request Route:', req.route);
  res.send("Hello world! 🌎");

});
Now we’ll create a dummy request (with params) from our browser to localhost:3000/?happy=😊&cat=🐈 and see what the server logs.
OUTPUT:
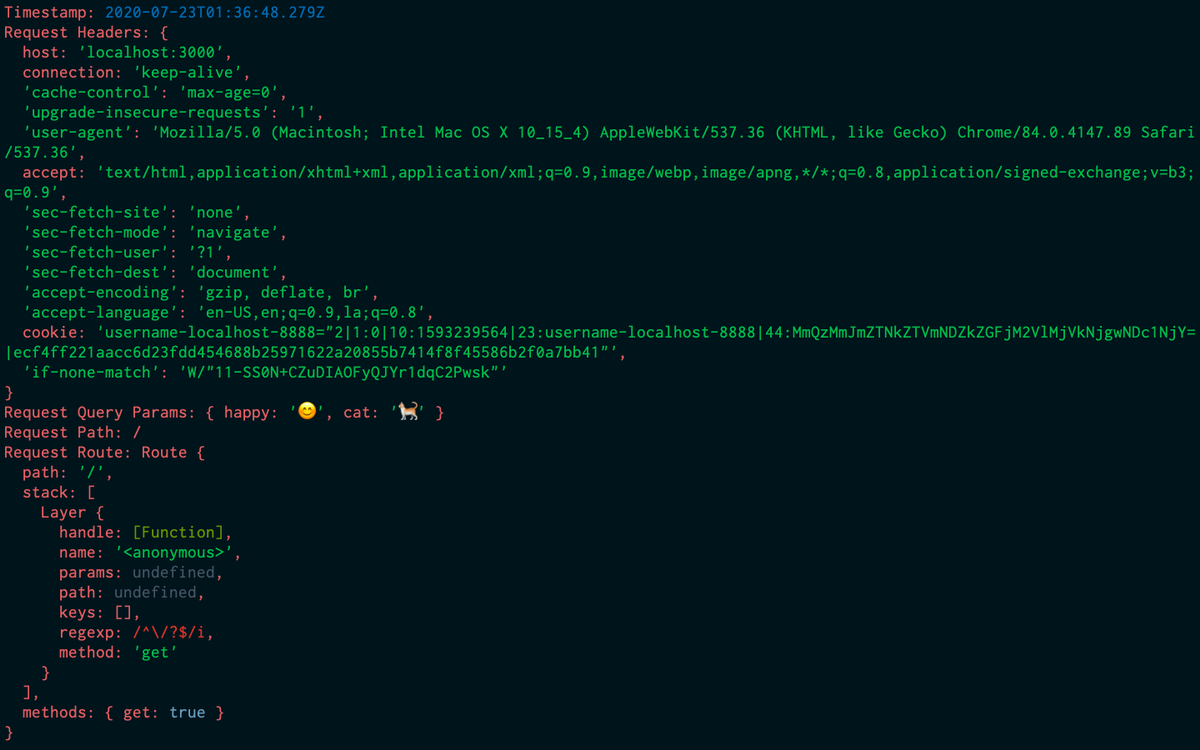
As you can see, we were able to successfully log the request parameters. We can also write this information to specific log files using the redirect operators ( ‘>’ and ‘2>’) as we discussed above.
This was just an example of logging some of the items that we can extract from the request object. In many cases, we might want to log fewer (or different) items for our application.
As I hinted before, this is a slightly naive way of logging things. There are much more functionality and convenience that we can benefit from by plugging third party solutions into our code. Now we will look at a renowned open-source third-party logging framework - Winston, and how it can make our life easier in the next section.
Third-Party Logging Frameworks - Winston 👨🏻🔧
One of the most popular logging frameworks for Node.js is Winston. It provides a simple API that makes the overall logging process more extensible and flexible.
Primarily, it allows you to configure multiple transports for redirecting logs to various sources. This can be very helpful if you want to record different levels of logs with different settings in different places. For instance, you might want a specific preset for your error logs - eg. for them to be in JSON format, formatted with timestamps, stored in separate files on some remote server; whereas you might want to deal with your general logs differently - eg. to output them to the CLI or redirect them to some local file with certain additional information. You can read more about transports in Winston here.
This multi-transport feature is quite easy to set up in Winston. Let’s first install Winston in our npm project using-
npm install --save winston
Now let’s see how we can initialize our Winston logger, configure it with the various options available, and log some stuff. We’ll break down the code for easier understanding -
// index.js
var express = require('express'); // importing library
var app = express(); // initialising app
var PORT = 3000; // server port

const winston = require('winston') // importing library
const format = winston.format // initialising for configuring log format options
Here, we import the Winston library and also initialize the format object that will be used to configure the formatting options for our log messages later
const consoleTransport = new winston.transports.Console(); // initialising console transport - for redirecting log output to console
const errorLogsFileTransport = new winston.transports.File({ filename: 'error.log', level: 'error' }); // initialising file transport for error logs
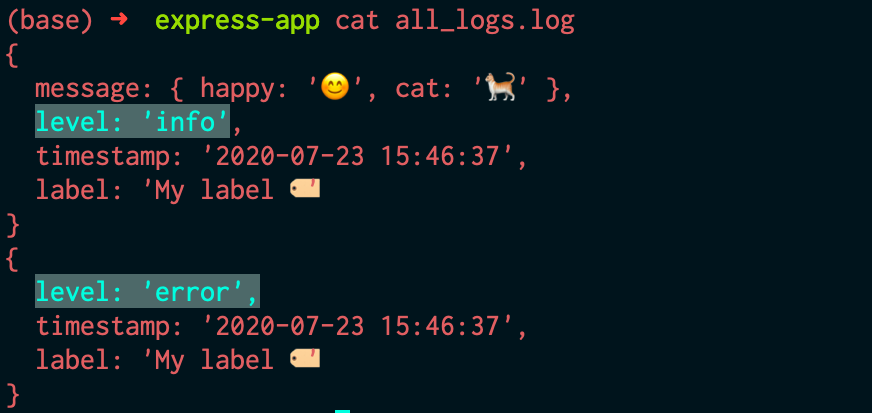
const allLogsFileTransport = new winston.transports.File({ filename: 'all_logs.log', level: 'info' }); // initialising file transport for all logs
Here, we initialize our transport targets (or destinations) that will take care of which logs should be stored where. First, we initialize the console transport, for logging to the console. Then we initialize file transports that will be used for storing different levels of logs in different files.
Note: When we initialize allLogsFileTransport using ‘info’ as the level, it allows all logs below the ‘info’ level to be stored in the specified file. This is why logs stored in all_logs.log also include ‘error’ and other level logs. You can read more about logging levels in Winston here.
Moving on,
const myWinstonOptions = { // defining configuration options for logger

  format: format.combine( // combining multiple format options

     format.timestamp({
       format: 'YYYY-MM-DD HH:mm:ss' // for adding timestamp to log
     }),

     format.label({ label: 'My label 🏷' }), // for labelling log message

     format.prettyPrint(), // for pretty printing log output
  ),

  transports: [consoleTransport, errorLogsFileTransport, allLogsFileTransport] // transport objects to be used
}
Here, we define the format and transport options that we will be using for our logger, which is to be initialized next.
const logger = new winston.createLogger(myWinstonOptions); // initialising logger

app.get('/', function(req, res){ // dummy GET route

  logger.info(req.query) // logging request's query params
  logger.error(new Error("Hello error ❌")) // logging arbitrary error
  res.send("Hello world! 🌎");

});

app.listen(PORT, () => { // start server
console.log('Server running on port %d! 🚨', PORT);
});
After defining all the configurations, we finally initialize our logger and log two types of messages in the route handler function.
Now based on our configurations, both the logs should appear in our console and in the all_logs.log file. Also, the error log should be written to the error.log file.
OUTPUT:
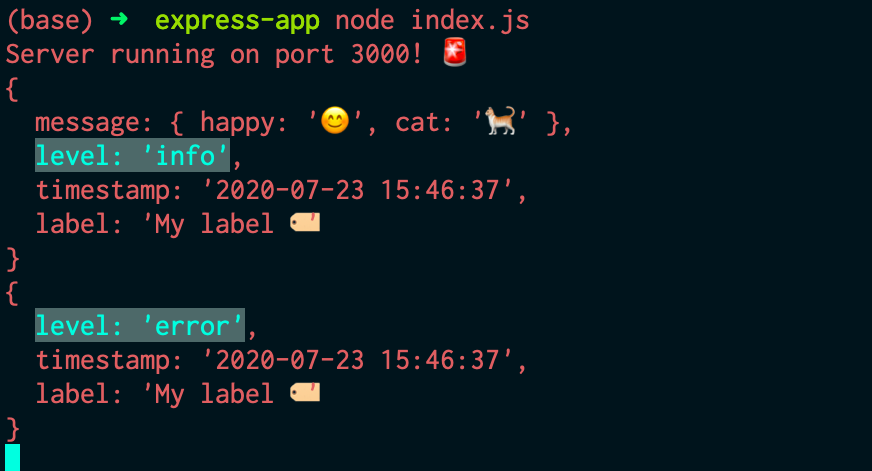
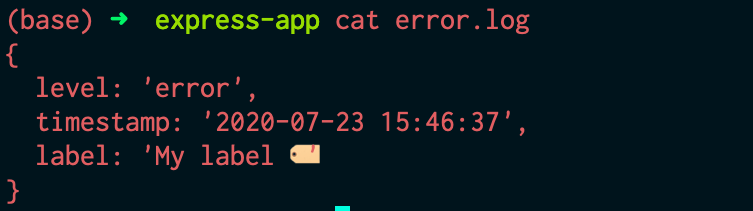
Thanks to Winston, you can see how easy and systematic it is to maintain these logs in an organized fashion. There’s a lot of extra functionality that Winston offers, like color formatting, child loggers, custom transports, exception handling, and much more. You can learn more about Winston and it features from their documentation here.
Here are some other popular logging frameworks for Node.js that you can also check out -
- Bunyan
- Morgan
- Node-Loggly (also from the developers of Winston)
Recap and Summary 🔁
In this post, we started by discussing the importance of logging in your applications: about how much we owe to good logging systems that benefit us every day. To understand more about the applications of logging and why it is useful, we also looked at four common, prevalent use case scenarios that extensively involve or benefit from logging. After being convinced about the advantages of logging in general, we then segued into the more implementation-based part of logging. We first learned about the various functions in Node.js’s console logging toolkit - about the general logging functions and the error/warning logging functions. We also discussed the difference between those two through an understanding of how logging in Node.js works under the hood. We then looked at the two redirect operators (‘>’ and ‘2>’) that allow us to write the log messages to separate log files.
To solidify our understanding of these concepts, we also created a basic Express.js server app and played around with logging the request object. Towards the end, we also looked at one of the most common Node.js logging frameworks, Winston, and implemented a basic Winston logger in our server to witness the ease, functionality, and flexibility it brought to the table.
Now that you know almost everything about logging in Node.js, go ahead and start logging in your application! Good luck!
Stay healthy, stay safe, and keep learning! Happy coding!
Did you find this article helpful or see something you disagree with or think should be improved? Please let us know, we value your feedback!