It is pretty common to envision software developers spending most of their time writing fancy code, building new, shiny features for applications, and smoothly deploying them to production. However, the reality is usually messier.
Things break all the time — your code fails, the system runs out of memory, exceptions go unhandled, dependencies conflict, servers overload, slow requests take forever, and whatnot. Sometimes, you’ll know exactly what went wrong, thanks to pretty error messages, system outputs, and logs. However, often, because of how complex many of these systems eventually get, locating and identifying the cause often becomes quite challenging.
Debugging is the bread and butter of software development. As a software developer, this is the part you likely spend the most amount of time on. Therefore, you want to make sure that you are the most efficient at it — because the quicker you can be at identifying and fixing bugs, the more time you can spend on building and shipping new, exciting features for your applications.
In this post, we will understand the process of debugging in software development — its meaning and the general steps to follow for systematically debugging errors out of your application. Towards the end, we will also discuss how APM tools can make debugging more effortless and effective. Here’s an outline of what we’ll be covering so you can easily navigate or skip ahead in the guide –
What is Debugging
Debugging is broadly the process of identifying, locating, and fixing an erroneous aspect (a bug) of your application. This could involve getting rid of bugs that cause your code to fail and exit or those that produce faulty, inaccurate outputs (e.g., errors in business logic).
Debugging is quite a straightforward concept — it is essentially the identification and fixing of any aspect of your application that isn’t working as expected. Let’s enlist some general steps of debugging.
Basic Steps of Debugging
Recognize that something’s not right (the bug)
The first step is to recognize that something is amiss. The most straightforward hint you could get is through a loud error message for things failing during compilation or runtime.
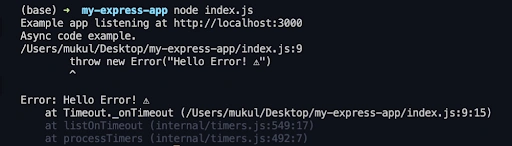
Error example
However, it could also be as nuanced as a discrepancy in the output in some end cases. For instance, imagine a shopping application that doesn’t update the order amount when you add more instances of an item to your cart. If gone unnoticed, imagine how much loss such a small mistake could incur to a business!
Bugs like these you are likely to catch during the testing phase of your application — through extensive unit, end-to-end, or integration tests.
Isolate the source
Once you know things aren’t working as they are supposed to be, the next logical step is to pinpoint the pain point — to see where the issue occurred.
Based on the specific error message (from the previous step) or your general understanding of the codebase structure, you need to isolate the part of your code causing the issue. In this regard, stack traces from error messages can be super helpful in pointing to the exact line of code causing the problem. However, this step might not be as straightforward if the issue is with the program's processing logic or output.
In that case, you could try printing out intermediate outputs along the pipeline to locate where things depart from their usual course. Intuitively, you could also backtrack from the point wherein the corresponding (inaccurate) output is returned (or displayed) up to the source of the processing error.
This is also where logging tools can be beneficial. They can help you track vital operations in your application and understand where exactly things went wrong.
Identify Cause
Once you’ve drilled down to the very part of your code causing issues, you need to identify the cause or the inaccuracy in your logic — to know why the issue occurred.
The bug could be due to an incorrectly implemented for loop, forgetting to update the global state of a variable, missing a necessary if condition, an unhandled exception, or whatnot.
To understand the cause of the issue better, debugger tools can be extremely valuable. They’ll allow you to step-by-step go through the program's execution, understand the control sequence at play, and get more information about the state of the program at each step. During development, information gathered in this phase will allow you to understand your application's workings better and troubleshoot effectively. On the other hand, in deployed applications, it is an effective logging setup that provides valuable contextual information required for determining a fix (the next step).
To learn more about how Scout helps with all your PHP logging requirements, check out our internal documentation. To learn more about logging in Rails applications, check out our Debugging with Rails Logger article.
Determine Fix
Based on what you learned about the cause of the issue from the previous step, you need to decide the course of action for its resolution. The fix could be as minor and straightforward as adding an if condition, rectifying a typo, renaming a variable, or adding a try/catch block. However, it could also be as enormous as a complete code refactoring from the ground up — requiring you to restructure your architecture, its control flow, data structures, etc.
The solution depends on a case-by-case basis, and you need to choose the one that is the quickest, most efficient, and most reliable for the long term.
Apply Fix and Test
The next obvious step is implementing the appropriate solution in your code.
Now, there’ll be times when fixing that one issue doesn’t fix everything. You need to test the tweaks you made to ensure that 1) it solves the issue, and 2) it doesn’t affect any other part of your code.
Therefore, you either re-run your tests and code to see if the issue still exists, or you write (or update) a unit test to verify the updated code. If you encounter new bugs, you might need to go back to the first step and start afresh for these new issues. However, if you don’t, that completes your debugging pipeline. You successfully debugged your code!
Troubleshooting & Debugging with APM tools
As you saw, debugging errors can be a comprehensive and painstaking exercise. Because these errors can potentially disrupt your application’s user experience and business operations, you’d want to be most efficient in getting these bugs out of the way. As you can imagine, manually monitoring and managing these issues can be intractable.
This is where you need automated Application Performance Monitoring tools that are 24x7 on the lookout for issues and performance trends in your application. APM tools like Scout provide you with live alerts and real-time insights about your application’s performance using a clean, minimal, streamlined interface, so you can spend more time building things and less time debugging issues.

Real-time error monitoring with Scout
Scout also provides an extensive error-monitoring tool that makes it super quick to detect bugs through a unified interface with error traces and contextual information. Below is a list of all the features it ships with:
- Full stack traces
- Request and custom params
- Real-time errors
- Monitor error rates
- Intelligent error grouping
- Github integrations for backtraces
- Real-time alerts via email
- Search Function
Learn more about Scout’s APM suite at scoutapm.com.
Conclusion
To err is human. Debugging is part and parcel of a software developer’s role. The more time you can save in debugging issues in your application, the more time you can spend shipping new application features to help your business grow.
Now that you have a good understanding of the principles of debugging and APM tools that can make you more productive, go ahead and apply these steps to any of the bugs you are currently encountering in your project.
Consider investing in an APM tool like Scout so you can ship reliable software faster. To learn more about why Scout is the best APM suite for you, check out our Why Scout webpage. Get started with a 14-day free trial (no credit card needed!).