Introduced in 1991, Python has grown to become a versatile and reliable programming language for modern computing requirements. Python is a powerful language used in web development, data science, software prototype creation, and much more. One of the best qualities of this language is it’s easy to learn and uniform across many use-cases. If you’re looking to start a career in any field that requires you to handle code, there is a high chance that Python is among the available programming languages. However, Python performance has been a debatable topic since the language's inception.
While the Python language offers ease of use, that ease of use can also negatively impact performance. Easy to remember keywords and syntax require additional preprocessing levels, and this preprocessing adds a tremendous amount of load on the overall throughput of the compiler/interpreter. If this is not taken care of properly, you can experience performance lag of your Python applications. This article looks at some common tips and tricks to help improve your Python application’s performance.
Use these links to navigate the guide:
- Common Python Performance Issues
- How to Improve Python Performance
- Benchmark Current Performance Metrics
- Use the Latest Version of Python
- Use Application Performance Monitoring Tools
- Import modules lazily whenever possible
- Use inbuilt functions
- Avoid global variables
- Prefer NumPy arrays over traditional Lists
- Use list comprehension
- Avoid checking if a variable is true
- Put for loop inside functions, rather than otherwise
- Prefer enumerate for value and index
- Use in over iteration
- Count unique values using Counter
- Concatenate strings with join()
- Try an alternative way
- Measure the Performance of your Python App in Realtime
Common Python Performance Issues
Before we dive into understanding ways to improve the performance, let’s first examine the actual issues that make Python slower than its counterparts.
The Perennial Python Speed Issue
Many python features were designed to keep in mind the hardware technology available back then when the language’s foundation was created. Changing the language design to accommodate the leaps that have been made in hardware technologies is a cumbersome task - applications built on Python may already need to be broken down and rebuilt. Making changes to improve performance can render such applications incompatible with Python’s future versions due to its fundamental design.
Another important step in improving performance is to acknowledge that there is room for improvement. Python wiki states that the slow speed, when compared to other languages like C, is not a ground-breaking problem. Let’s take a look at some aspects that affect Python’s performance.
Python is an Interpreted Language
One of the most important differences between Python and other languages is that Python is usually interpreted. Interpreted languages tend to perform worse than compiled languages, each command takes up a greater number of machine instructions than a compiler counterpart's to execute. In the case of compiled languages, executables are built beforehand which usually contain byte code or its equivalent, and do not need any further compilation to execute the program.
Python code, on the other hand, requires to be interpreted every time before it is run by the processor. There happens to be some caching of the byte code generated by Python files when compiled .pyc files are used, but even they perform poorer than their Java or .NET equivalents. The reason here is that languages like Java and .NET use Just-In-Time compilation (JIT).
The JIT does not make the execution of byte code any faster, the reason being that it is still executing the same byte code sequence. However, the biggest benefit that JIT brings to the table is that it enables optimizations in the compilation process.
Some very good JIT compilers are smart enough to identify chunks of code that are being called again and again and replace them with more efficient versions. Ahead of Time compilers, on the other hand, need to make sure that the CPU understands every piece of code before the execution takes place, so they often miss out on optimizations based on application performance.
PyPy has been built with a JIT compiler inside, and its results are obvious - it is found to be 4 to 5 times faster than the traditional CPython runtime.
However, CPython has no plans of upgrading into a JIT compilation process. This is because of multiple reasons. JIT compilation increases start-up time, and PyPy has already suffered from this quite heavily. As the CPython runtime was meant to be a general-purpose programming runtime, it would make no sense to have to wait for JIT to boot up when using CLI tools built using CPython. Also, JIT makes much more sense for use-cases where a piece of code is called repeatedly, usually in a long-running process or application.
Python is Dynamically Typed
One of the best things about Python is that you do not have to define types every time you declare a variable. A feat like this is very common in Python code:
foo = 0
foo = "bar"
foo = {"bar": "baz"}
But this takes a really heavy toll on the performance of the language. In dynamically typed languages like Python, the interpreter doesn't know the type of the variables that are defined at the time of the program's execution. This means that additional efforts have to be put to identify the type of data that is stored inside a variable in Python to be able to use it in a statement. For instance, if we have such a piece of code in C:
int a = 0;
int b = 1;
int sum = a + b;
And we have its equivalent in Python:
a = 0
b = 0
sum = a + b
The C code would outshine its Python equivalent in performance every single time. The reason for this is, that when the data type of a variable is explicitly declared to the runtime environments, it can apply optimizations specific to certain data types to improve performance quite easily. Also, the runtime environment is not required to evaluate the type of data stored in a variable when it is accessed. It already knows this information beforehand, and this reduces a great number of otherwise redundant operations.
In the case of dynamically typed languages like Python, this simply means that a lot of extra steps are involved when handling such cases, which degrade the performance of the environment. However, this does result in a better and faster development experience, and that is the main reason why even though Python is so slow, it still dominates the tech market.
Python's Object Model Can Cause Inefficient Memory Utilization
As we saw above, the objects in Python do not have proper types associated with them, and due to this numerous redundant operations are required to be done to carry out simple tasks. If you talk about an array of such objects, it only magnifies the issue.
However, there is another major issue associated with lists of objects in Python. The way Python stores lists is different from conventional arrays - a List object in Python contains a reference to a contiguous array of references in the memory. These references point to the actual data. This can create a messy scenario, similar to this:
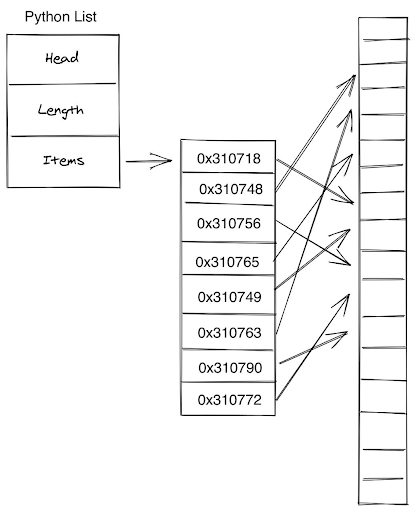
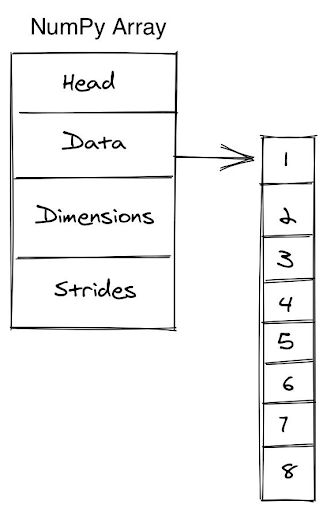
To curb this, the NumPy Arrays were formulated, which are nothing but objects built around the primitive C arrays. This makes their structure super simple, and thus manipulating and accessing data is super smooth too.
Python Does Not Support Concurrency
While this is not much of a setback to Python's performance, it is still an area where Python missed out on improving. Most programming languages offer support to utilize the multitude of processing cores that modern machines are shipped with. While multi-core processing is complicated, it does add sweet performance benefits to processing. It also allows having better load balancing in case of performance-intensive tasks, thereby providing a smoother user experience.
One of the key issues that this behavior brings along with itself is that concurrent access to a variable needs to be moderated closely. If not handled correctly, situations such as race condition, deadlock, and livelock, can render a running application useless in seconds. The concept of locks is used to prevent this. A lock is used to prevent concurrent access to sensitive variables by multiple threads.
However, the CPython runtime implements a lock called the GIL (Global Interpreter Lock) that prevents any two threads from running simultaneously at any point in time. This usually makes no difference in systems with single-core processors. But it renders the benefit of having a multi-core processor useless, as, at any given point in time, only one core can be utilized.
How to Improve Python Performance
Having taken a look at the different reasons why Python does not perform so well when compared to its contemporary counterparts, let's now analyze the various tried and tested ways to help improve the efficiency of programs written using this language.
1. Benchmark Current Performance Metrics
The best way to know if your application is performing up to the mark or not is to benchmark it. There are several great benchmarking and profiling tools out there to choose from, and you can easily find one that suits your needs. Here are the most common ones:
Timeit
If you’re looking to benchmark isolated lines of code individually, Timeit is a great alternative. It helps to run and benchmark small pieces of code with great control over the tests. An important feature of Timeit is that you can choose to disable/enable the garbage collection during your benchmark runs. This can give you some great insights into how well your code is managing the available memory.
However, Timeit can be a tough tool to use when you’re looking to benchmark large chunks of code. The tool requires the code that has to be benchmarked to be passed in the form of a string. This is how a sample of Timeit benchmarking looks like:
def test_func():
  # the code to be tested
    arr = []
    for i in range(500):
        arr.append(i)

if __name__ == '__main__':
    import timeit
    print(timeit.timeit("test_func()", setup="from __main__ import test_func"))
In this way, you can place any snippet of code inside test_func and benchmark it. This is how a sample output from the test would look like:
33.115881915
As you can see, the output from a timeit.timeit() call is simply the amount of time that the snippet took to complete execution. It does not provide any detailed insight into other performance metrics. This is where profiling comes in. Profilers do the same work as benchmarking tools; they just do it with more details. Let’s analyze Python’s default profiler now.
Python Profiler
A profile, by definition, is a collection of various statistics that describes how often and for how long various parts of the program are being executed. Profilers are meant to analyze several metrics simultaneously for the piece of the code that is under scrutiny. Python ships with an inbuilt profiler, and it pretty much covers all of the basic profiling requirements in a generic application.
Here’s how the same piece of code that we used earlier would be profiled:
def test_func():
  # the code to be tested
    arr = []
    for i in range(500):
        arr.append(i)

if __name__ == '__main__':
    import cProfile
    cProfile.run("test_func()")
The above snippet would result in something similar to this:
  504 function calls in 0.000 seconds

  Ordered by: standard name

  ncalls  tottime  percall  cumtime  percall filename:lineno(function)
        1    0.000    0.000    0.000    0.000 <iPython-input-11-6e0e08304ab5>:1(test_func)
        1    0.000    0.000    0.000    0.000 <string>:1(<module>)
        1    0.000    0.000    0.000    0.000 {built-in method builtins.exec}
      500    0.000    0.000    0.000    0.000 {method 'append' of 'list' objects}
        1    0.000    0.000    0.000    0.000 {method 'disable' of '_lsprof.Profiler' objects}
This presents you with much more detailed and useful data. The first line indicates that 504 calls were monitored. The next line: Ordered by: standard name, indicates that the text string in the far right column was used to sort the output. Several columns describe various types of data - the total number of calls made (ncall), the total time taken in those calls individually (tottime), cumulative time per sub function call (cumtime), etc. These are great when it comes to breaking down the execution and finding the exact line which is slowing down your application’s performance.
%%time
If you’re looking to benchmark some cells in a jupyter notebook on-the-fly, a great solution to this is to add either %%time or %time on the top of it. %%time is used to gauge the time spent in running the entire cell that this magic command is added in, while %time records the time spent in running the first statement only.
Here’s how you can measure the above example using this command:
%%time

def test_func():
  # the code to be tested
    arr = []
    for i in range(500):
        arr.append(i)

if __name__ == '__main__':
    test_func()
Output:
CPU times: user 86 µs, sys: 2 µs, total: 88 µs
Wall time: 93 µs
2. Use the Latest Version of Python
Another good practice to follow when using any software development tool or language is to always remain in sync with the latest version that is available. While windows users might fret upon this statement, it is usually very beneficial in all other cases. The reason is, every piece of software that’s under active development keeps track of the bugs that its users are facing. And every new release clears out a big chunk of these bugs every once in a while.
While issues like bad memory management in Lists are not going to be solved in any Python update shortly, some smaller issues such as those which crept in with some recent feature can surely be fixed. Many times, this solves peculiar performance issues that seem unusual right at sight. So if you’re facing some very unusual spike in your performance metrics, it will be best to make sure that you’re running the latest version of Python, to be on the safe side.
3. Use Application Performance Monitoring Tools
You can benchmark any piece of code that you want by using the methods that we described in the first tip. However, in real-life projects, this can get cumbersome. Business logic can be tricky, and isolating suspected pieces of code can be close to impossible. This is where application monitoring comes to the rescue. Monitoring refers to a broader version of benchmarking and profiling; it takes into account the performance of a full-fledged application rather than just a piece of code.
There are several great APM providers available out there, with ScoutAPM being just one solution.
4. Import Modules Lazily Wherever Possible
One of the best ways to improve performance metrics is to distribute module loading throughout the lifetime of the code. Not all languages support this, but fortunately, Python does, and you can leverage this to manage memory and processor usage better. Technically, you do not reduce any amount of time from your code's lifecycle, but you can, for sure, distribute it more evenly.
Beginners are usually advised to define all imports at the top of the file to keep things, and it’s not a bad practice to follow for smaller programs. But as the size of code increases and you finally start looking towards building an actual application, such management can go a long way in making sure that your application does not observe peaks of memory usage when all modules are imported at once.
5. Use Built-In Functions
While creating an application, it is a very common practice to create utility methods that help to carry out routine tasks like parsing data, formatting strings, etc. While you might do a great job in defining these methods according to your requirements, it is advisable to use a built-in alternative of such methods as far as possible.
The reason behind this is that more often than not, a built-in alternative of any of your custom methods is bound to perform better always against your code. This is so because those built-in functions are super optimized before they are shipped with the language. Adding to that, methods written manually are prone to errors and improper resource management, as they are not tested as intensively as built-in methods are. So the bottom line here is to make use of built-in functions as much and wherever possible.
6. Avoid Global Variables
A tip that often goes unnoticed is to use as few global variables as possible. It is a well-understood fact that global variables often make the work easy, by skipping over the issues associated with scopes and acting as a universal provider across the program. But apart from the security concerns that they raise, they also hamper application performance. Here’s a quick snippet of code to help you visualize the difference between the use of global and local variables -
x = "Hello World!"

def test_func_glob():
    arr = []
    for i in range(50):
      arr.append(x)

def test_func_loc():
    x = "Hello World!"
    arr = []
    for i in range(50):
      arr.append(x)

if __name__ == '__main__':
    import timeit
    print("Global -> ", timeit.timeit("test_func_glob()", setup="from __main__ import test_func_glob"))
    print("Local -> ", timeit.timeit("test_func_loc()", setup="from __main__ import test_func_loc"))
Here’s a sample output after running the program in a Google Colab cell -
Global ->  4.058157788000017
Local ->  3.613330179000002
7. Prefer NumPy Arrays Over Traditional Lists
This is a tip that we stumbled upon a little earlier in this guide. Restating the facts that we discussed earlier, NumPy arrays are merely wrappers around C arrays, with proper reference management. On the other hand, Python Lists are a mess of irregular reference sequences, and once they scale up to a large size, they can cause irregularities in memory utilization.
8. Use List Comprehension
In Python, lists of data are common. And where there is a list, there has to be some sort of iteration to carry out operations on it. You can go the old way of looping to manually iterate through all values in the list, but as it turns out, it is not always the most efficient way. Python offers list comprehensions as an alternative, and apparently, they are a great tool when it comes to improving time and memory while accessing lists.
For instance, let’s see how you would square a list of numbers in the old-fashioned looping way -
result = []
for n in range(0, 20):
    result.append(n**2)
Here’s how you can do it with a list comprehension -
result = [n**2 for n in range(0, 20)]
As you can see, this approach is cleaner and more concise. And the best part of it is that it improves the performance of the code. So it’s a win-win for both code simplicity as well as application performance.
9. Avoid Checking if a Variable is True
A common practice while looking for empty variables is to compare them with None. While this does make sense, but a little tweak here can help you save some sweet time in the performance of your app. Aside from comparing an object with None to check if it’s empty or not, you can simply pass it as the only thing in the condition check. Here’s how it would look:
str = "Hey there!"

# The traditional way
if str != None:
  print("Found")
else:
  print("Not Found")

# The faster way
if str:
  print("Found")
else:
  print("Not Found")
10. Put Loop Inside Functions, Rather Than Otherwise
Sometimes, you might need to define a function and call it multiple times in a sequence. An obvious, easy way would be to create a loop and call this function inside the loop multiple times. However, this can be a risky maneuver as each function call associates itself with a new stack in the memory for the call. So it would be much more advisable to define the function in such a way that it only needs to be called once, and it runs a loop internally to complete the entire job in only one function call.
11. Prefer Enumerate For Value and Index
When it is needed to access both the value and the index of an element while traversing an array, this is how you would usually frame your code’s structure:
arr = range(0, 20)

for i in range(len(arr)):
  print("Index", i)
  print("Value", arr[i])
However, a better structure would be:
arr = range(0, 20)

for i, number in enumerate(arr):
  print("Index", i)
  print("Value", number)
This makes a very minor change in the code, but owing to the optimizations made to the enumerate method, the snippet that uses enumerate runs around 2 times faster than the previous one.
12. Use In Over Iteration
Let’s say you have to check whether a certain element is present in a list or not. A naive approach would be to iterate over the entire list, comparing each element with the search element and stopping where the first match occurs. However, it turns out that the internal method defined for this operation again beats the naive method fair and square, both in terms of performance and code readability. Here’s how you can do the same
arr = [] # Your list of elements

if (query in arr):
  # Match found
else:
  # Match not found
13. Count Unique Values Using Counter
Let’s say you are trying to count unique values in a long list. A naive approach would be to create a dictionary in which the keys are distinct values from the list and the values are the number of times they appeared. As we iterate through the list, we can increment a certain value’s count if it is already in the dictionary and add it to the dictionary if it is not.
val_counts = {}
for num in arr:
    if num in val_counts:
        val_counts[num] += 1
    else:
        val_counts[num] = 1
But, a better way would be to use the Counter() method from collections:
val_counts = Counter(arr)
That’s it! And this approach is bound to perform better, as the methods are super optimized for performance.
14. Concatenate Strings With join()
A small detail that is often missed out when concatenating strings is whether or not a new string is being created on every join. One way would be to use the ‘+’ operator to concatenate two strings, but a major drawback associated with it is that it creates a new string every time two strings are joined. This might not be problematic in small applications, but in apps that rely on processing words, it can cause huge spikes in memory consumption. A better way to handle this is to use the join() method. Let’s compare the two ways of concatenating strings:
str1 = "Hello" + "World!" + "Foo" + "Bar" + "Baz"
# => HelloWorld!FooBarBaz

str2 = " ".join(["Hello", "World!", "Foo", "Bar", "Baz"])
# => Hello World! Foo Bar Baz
The join() method is more convenient, faster, and looks cleaner to read as well.
15. Try An Alternative Way
In many cases, the logic of the code that you’ve written itself causes performance issues. So instead of hurrying through lists of tweaks to improve the performance, take a moment to analyze whether the logic that you’re trying to achieve is being achieved or not. If yes, is there a better, more concise way of doing it? Can you try making changes to your code or try replacing it with more built-in functions? A thorough code review that covers these questions, along with a benchmark tool like TimeIt can help you gain seconds if not minutes of the application running time, thereby providing a great boost in the user experience of the application.
Measure the Performance of Your Python App in Real-Time
As we reach the end of the guide, it’s important to remember this particular tip: always use a Python monitoring solution to measure your app’s performance in real-time. While you can do all sorts of benchmarking and profiling to isolate code hotspots that might cause spikes in your metrics, you can not imitate a real-time production environment in your tests. The best way to improve your Python application’s performance is to monitor it while it is in action by using an in-production APM tool like ScoutAPM.