
Updated version of an article first published on February 24th, 2015.
Your Linux server is running slow, so you follow standard procedure and run top. You see the CPU metrics:
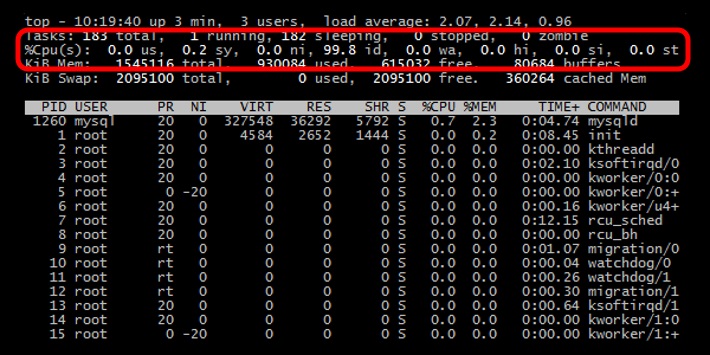
But what do all of those 2-letter abbreviations mean?
The 3 CPU states
Let's take a step back. There are 3 general states your CPU can be in:
- Idle, which means it has nothing to do.
- Running a user space program, like a command shell, an email server, or a compiler.
- Running the kernel, servicing interrupts or managing resources.
These three meta states can be further subdivided. For example, user space programs can be categorized as those running under their initial priority level or those running with a nice priority. Niceness is a way to tweak the priority level of a process so that it runs less frequently. The niceness level ranges from -20 (most favorable scheduling) to 19 (least favorable). By default processes on Linux are started with a niceness of 0. See our blog post Restricting process CPU usage using nice, cpulimit, and cgroups for more information on nice.
The 7 cpu statistics explained
There are several different ways to see the various CPU statistics. The most common is probably using the top command.
To start the top command you just type top at the command line:
The output from top is divided into two sections. The first few lines give a summary of the system resources including a breakdown of the number of tasks, the CPU statistics, and the current memory usage. Beneath these stats is a live list of the current running processes. This list can be sorted by PID, CPU usage, memory usage, and so on.
The CPU line will look something like this:
%Cpu(s):24.8us,0.5sy,0.0ni,73.6id,0.4wa,0.0hi,0.2si,0.0st
24.8 us - This tells us that the processor is spending 24.8% of its time running user space processes. A user space program is any process that doesn't belong to the kernel. Shells, compilers, databases, web servers, and the programs associated with the desktop are all user space processes. If the processor isn't idle, it is quite normal that the majority of the CPU time should be spent running user space processes.
73.6 id - Skipping over a few of the other statistics, just for a moment, the id statistic tell us that the processor was idle just over 73% of the time during the last sampling period. The total of the user space percentage - us, the niced percentage - ni, and the idle percentage - id, should be close to 100%. Which it is in this case. If the CPU is spending a more time in the other states then something is probably awry - see the Troubleshooting section below.
0.5 sy - This is the amount of time that the CPU spent running the kernel. All the processes and system resources are handled by the Linux kernel. When a user space process needs something from the system, for example when it needs to allocate memory, perform some I/O, or it needs to create a child process, then the kernel is running. In fact the scheduler itself which determines which process runs next is part of the kernel. The amount of time spent in the kernel should be as low as possible. In this case, just 0.5% of the time given to the different processes was spent in the kernel. This number can peak much higher, especially when there is a lot of I/O happening.
0.0 ni - As mentioned above, the priority level a user space process can be tweaked by adjusting its niceness. The ni stat shows how much time the CPU spent running user space processes that have been niced. On a system where no processes have been niced then the number will be 0.
0.4 wa - Input and output operations, like reading or writing to a disk, are slow compared to the speed of a CPU. Although this operations happen very fast compared to everyday human activities, they are still slow when compared to the performance of a CPU. There are times when the processor has initiated a read or write operation and then it has to wait for the result, but has nothing else to do. In other words it is idle while waiting for an I/O operation to complete. The time the CPU spends in this state is shown by the wa statistic.
0.0 hi & 0.2 si - These two statistics show how much time the processor has spent servicing interrupts. hi is for hardware interrupts, and si is for software interrupts. Hardware interrupts are physical interrupts sent to the CPU from various peripherals like disks and network interfaces. Software interrupts come from processes running on the system. A hardware interrupt will actually cause the CPU to stop what it is doing and go handle the interrupt. A software interrupt doesn't occur at the CPU level, but rather at the kernel level.
0.0 st - This last number only applies to virtual machines. When Linux is running as a virtual machine on a hypervisor, the st (short for stolen) statistic shows how long the virtual CPU has spent waiting for the hypervisor to service another virtual CPU running on a different virtual machine. Since in the real-world these virtual processors are sharing the same physical processor(s) then there will be times when the virtual machine wanted to run but the hypervisor scheduled another virtual machine instead.
Troubleshooting
On a busy server or desktop PC, you can expect the amount of time the CPU spends in idle to be small. However, if a system rarely has any idle time then then it is either a) overloaded (and you need a better one), or b) something is wrong.
Here is a brief look at some of the things that can go wrong and how they affect the CPU utilization.
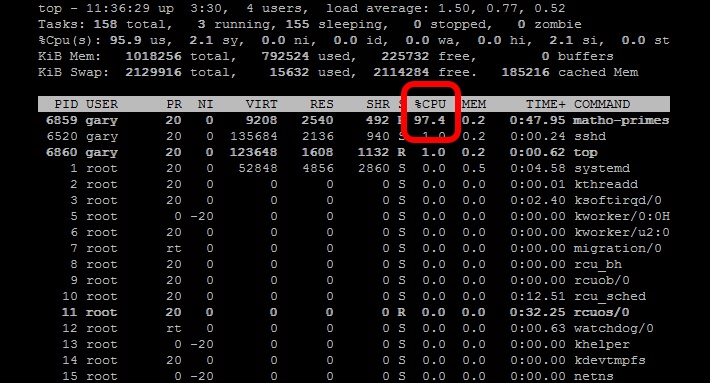
High user mode - If a system suddenly jumps from having spare CPU cycles to running flat out, then the first thing to check is the amount of time the CPU spends running user space processes. If this is high then it probably means that a process has gone crazy and is eating up all the CPU time. Using the top command you will be able to see which process is to blame and restart the service or kill the process.
High kernel usage - Sometimes this is acceptable. For example a program that does lots of console I/O can cause the kernel usage to spike. However if it remains higher for long periods of time then it could be an indication that something isn't right. A possible cause of such spikes could be a problem with a driver/kernel module.
High niced value - If the amount of time the CPU is spending running processes with a niced priority value jumps then it means that someone has started some intensive CPU jobs on the system, but they have niced the task.
If the niceness level is greater than zero then the user has been courteous enough lower to the priority of the process and therefore avoid a CPU overload. There is probably little that needs to be done in this case, other than maybe find out who has started the process and talk about how you can help out!
But if the niceness level is less than 0, then you will need to investigate what is happening and who is responsible, as such a task could easily cripple the responsiveness of the system.
High waiting on I/O - This means that there are some intensive I/O tasks running on the system that don't use up much CPU time. If this number is high for anything other than short bursts then it means that either the I/O performed by the task is very inefficient, or the data is being transferred to a very slow device, or there is a potential problem with a hard disk that is taking a long time to process reads & writes.
High interrupt processing - This could be an indication of a broken peripheral that is causing lots of hardware interrupts or of a process that is issuing lots of software interrupts.
Large stolen time - Basically this means that the host system running the hypervisor is too busy. If possible, check the other virtual machines running on the hypervisor, and/or migrate to your virtual machine to another host.
TL;DR
Linux keeps statistics on how much time the CPU spends performing different tasks. Most of its time should be spent running user space programs or being idle. However there are several other execution states including running the kernel and servicing interrupts. Monitoring these different states can help you keep your system healthy and running smoothly.
Also see
- Restricting process CPU usage using nice, cpulimit, and cgroups
- Slow Server? This is the Flow Chart You're Looking For
- Understanding CPU Steal Time - when should you be worried?
- Understanding Linux CPU Load - when should you be worried?
More servers? Or faster code?
Adding servers can be a band-aid for slow code. Scout APM helps you find and fix your inefficient and costly code. We automatically identify N+1 SQL calls, memory bloat, and other code-related issues so you can spend less time debugging and more time programming.
Ready to optimize your site? Sign up for a free trial.