Finding fast (but expensive) database queries
A database is a shared resource for a Rails application. A single misbehaving query hitting your database can slow down unrelated queries throughout your system.
When we began running our own database monitoring against our apps, we discovered several expensive queries that weren't apparent when viewing individual web endpoints and backgrounds jobs.
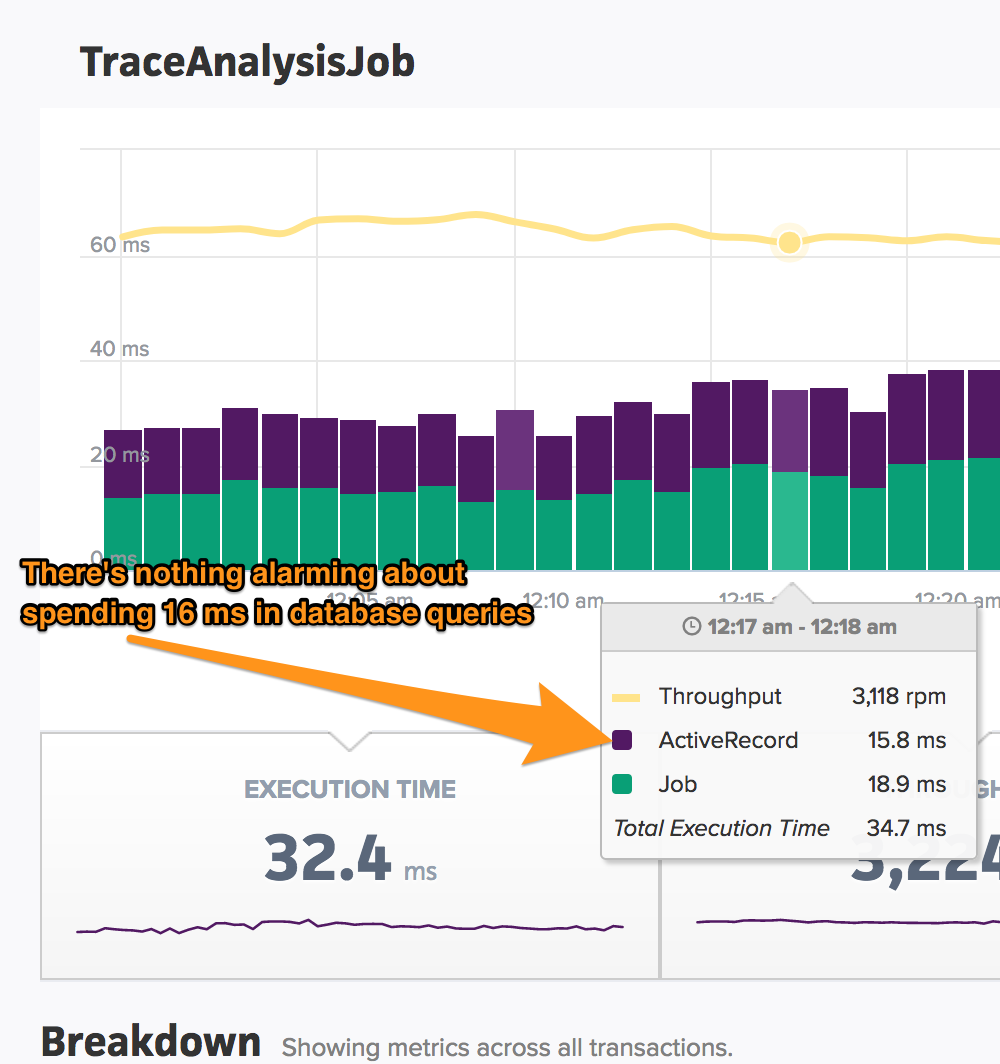
For example, here's a TraceAnalysisJob background job that analyzes traces collected by our agent for potential N+1 calls:
On the surface, there's nothing alarming about spending 16 ms in database calls per-transaction.
Now, let's look at Scout's expensive query view:
Here, I can see that one of the queries in our TraceAnalysisJob is responsible for 14% of the time spent in our database. Our database is doing a lot of work to execute this query since the job has a high throughput.
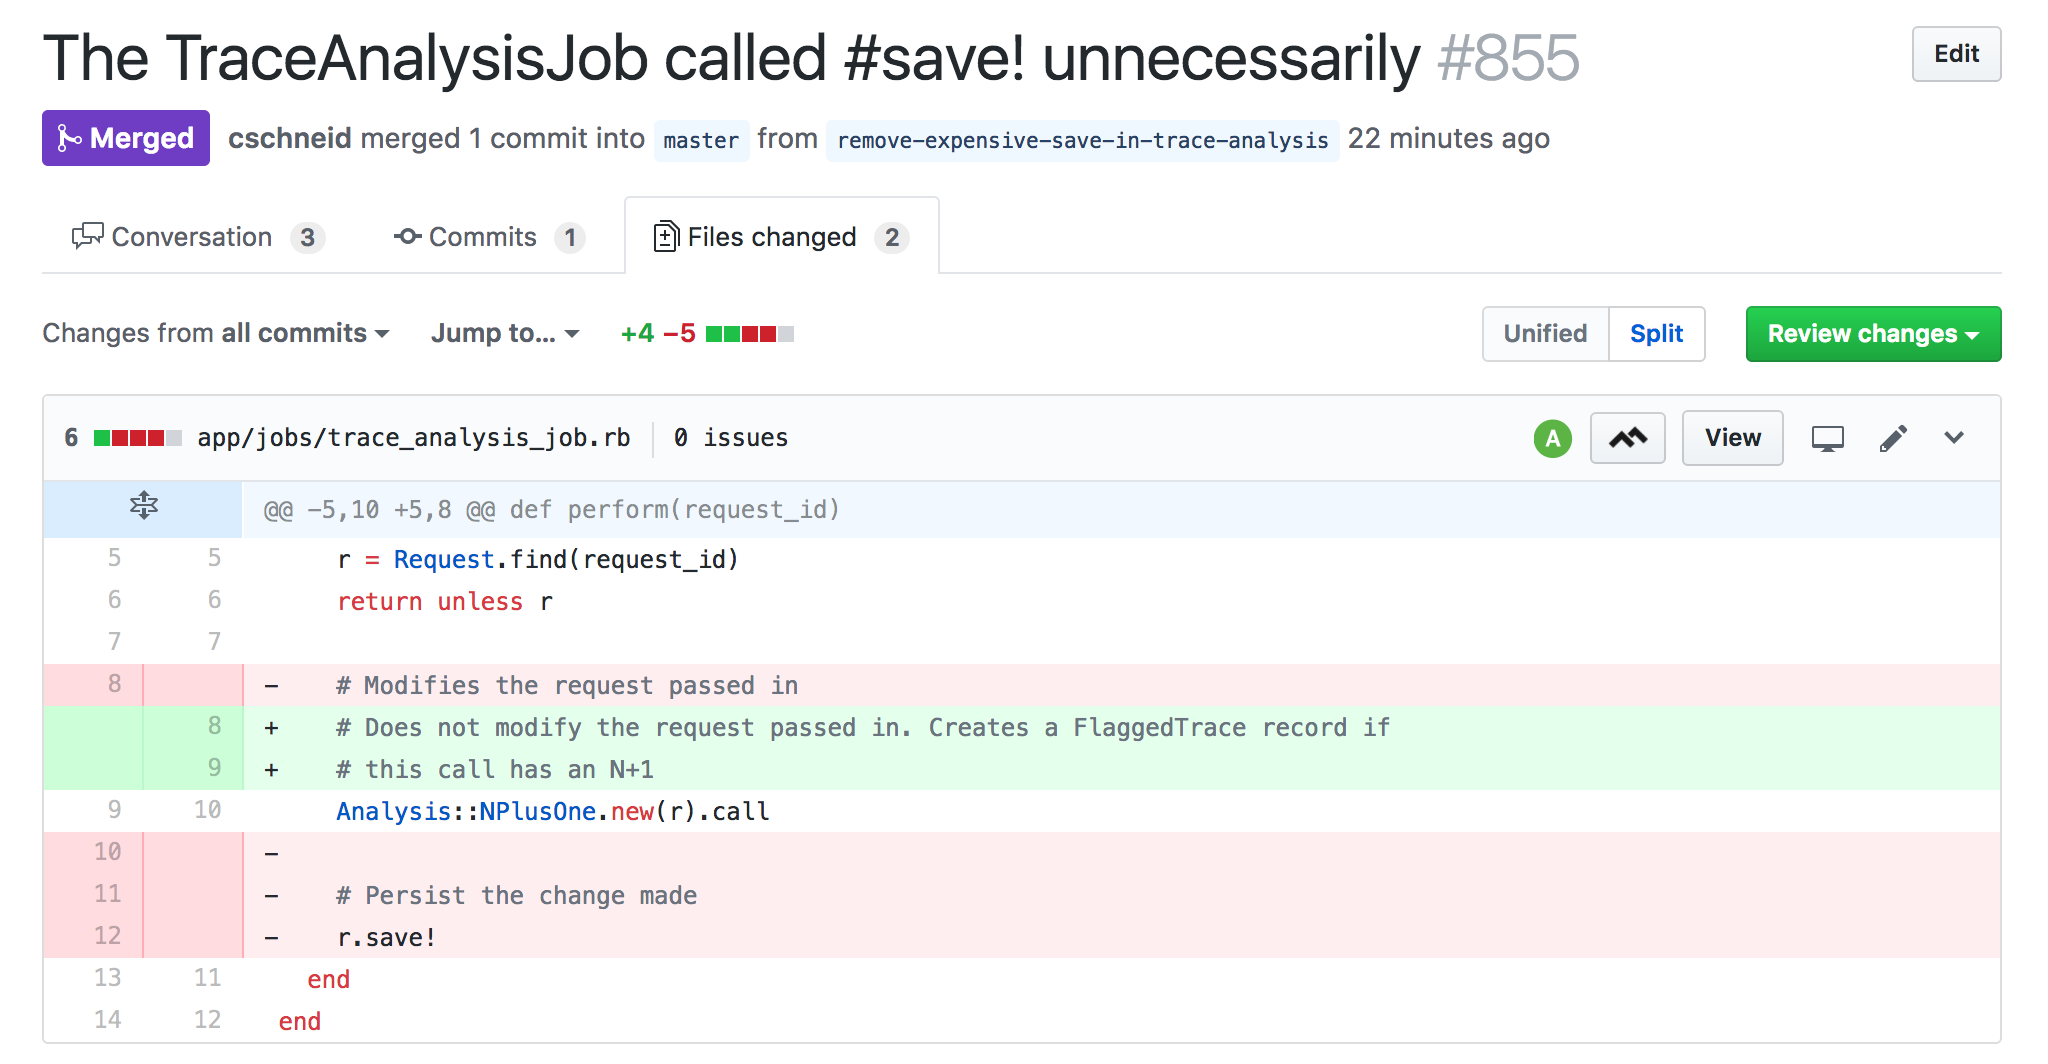
This caught the eye of Chris, one of our developers. He realized that this save wasn't actually needed. We weren't modifying the Request in the background job:
After deploying the optimization, we saw the expected drop in query throughput and time consumed:
TL;DR
High throughput, fast queries can account for a significant amount of work that your database performs. These can sneak under the radar when just examining web endpoints and background jobs on their own. Scout's new database monitoring can be particularly helpful bringing these issues to light.


