Top Infrastructure Monitoring Tools and Best Practices
As more and more organizations adopt cloud-native technologies, the need to align business objectives and end-user experience with IT infrastructure’s availability and performance is ever-growing. This trend requires infrastructure monitoring setups to ensure that all of your systems are active and working together across your cloud environments, host operating systems, storage systems, etc.
That brings us to the coveted question—what is infrastructure monitoring? And why does it matter for businesses now more than ever before? This guide will walk you through the fundamental advantages that infrastructure monitoring offers to companies and dissect the various infrastructure monitoring components to help you better understand how you can make the best of it.
Feel free to navigate this guide using these links:
- What is Infrastructure Monitoring?
- Important Infrastructure Monitoring Metrics
- Proven Methods for Infrastructure Monitoring
- Infrastructure Monitoring Tools
- Key Takeaways
What is Infrastructure Monitoring?
Infrastructure monitoring refers to instrumenting and analyzing the usage of IT resources, systems, and processes and using the collected data to enhance the said resources’ performance further.
Any endpoint or application connected directly or indirectly to your company’s internal network is a potential hazard for malicious entities that wish to access your company’s sensitive data or properties. Software and hardware devices can facilitate such an attack on your system. Additionally, any failure in your company’s IT infrastructure can inflict a loss on your business revenue. Therefore, you must regularly monitor your infrastructure's performance and health and take necessary actions whenever needed.
There are multiple facets to complete infrastructure monitoring:
Hardware Monitoring: This section is focused on capturing data from sensors found in computers and other machines. These include battery life data, current & voltage sensors, fan speed sensors, etc. Monitoring these metrics can help you identify a malfunctioning hardware resource before its failure causes damage to other surrounding resources.
Network Monitoring: This section helps verify if your company’s internal network is functioning correctly and performing up to the standards of expected speed reliability. With the correct tools, you can track the transfer rates and connectivity levels your users get on the network. You can even go so far as to monitor incoming and outgoing connections. Network monitoring can help you identify when unauthorized access is attempted in your network.
Application Monitoring: This section is one of the most critical aspects of IT monitoring. Your application is among the parts that are most exposed to the real world. This leaves room for security threats, and a small bottleneck can cascade into a significant loss in the business revenue. If you implement proper infrastructure monitoring tools, you can track user behavior on your apps and obtain operational insights into your app’s usage.
Why Do Businesses Use Infrastructure Monitoring?
Now that you understand what infrastructure monitoring means, it is time to learn why your business needs it. There are numerous advantages that a well-configured infrastructure monitoring setup brings with itself. This section will discuss some of the top reasons.
Reduced Operational Costs
With a proper infrastructure monitoring setup, you will track and hunt down errors way before they burn a hole through your pocket. Early diagnosis and resolution will prevent the further spread of issues and ensure that your application does not lose customers and revenue due to downtimes.
Reduced Complexity & Support Workload
Observability into the complete infrastructure of your application helps you destructure the complexity of the design of your application and track the performance of every component individually. When you need support for resolving issues, monitoring again comes into play by providing precious information on the issues.
Safeguarded Uptime For Users Globally
A robust monitoring structure ensures that you have covered almost all possible aspects of error sources and are ready to tackle any issues that arise head-on. This further ensures that your MTTR is low and application functions with maximum uptime possible. With decentralized monitoring solutions, you can even extend this trait across the globe and safeguard the uptime for all your users irrespective of their location.
Effective Security
Monitoring and security always go hand in hand. Without a reliable monitoring solution in place, it can become nearly impossible to know when and where a security breach has occurred. Logging and analyzing events in your infrastructure can help you gain insights into the performance of your application.
Enhanced Reliability of IT Resources
With a robust infrastructure monitoring setup, you can rest assured that your IT resources will perform to the best of their potential. You will receive alerts well before a resource is maxed out to its capacity and is about to blow out. To prevent downtimes, you can also implement failsafes as part of your infrastructure monitoring setup to ensure that the system is throttled down when certain thresholds are crossed.
Increased Business RoI
All the benefits mentioned above, when put together, contribute towards increasing the overall Return on Investment (or ROI) from your business and operations. You face smaller downtimes, and you can utilize the monitoring logs to gain insights on how to drive your business further and increase revenues.
Improved End-User Experience
When all components of your system work together and are unaffected by significant downtimes, the end-user experience for your customers is bound to improve. Proper monitoring ensures that you avoid major issues before they happen and resolve the minor ones that do happen in as minimal time as possible.
Important Infrastructure Monitoring Metrics
Having understood the importance of proper infrastructure monitoring for a business, it is now time to get into the basics of infrastructure monitoring. This section will take a detailed look at four integral metrics (also called Golden Signals by Google) used to evaluate infrastructure performance and how to benchmark your system using these metrics.
Latency
Latency is the time it takes to complete an activity. This is a very generalized definition of the term, and we will see it in more depth in the architectural contexts that we will look at later. To get a real-world idea, processing times, response times, travel times, etc., are all examples of latency.
When you put the latency of multiple parts of your system together, you get an idea of how long it takes for your complete system to complete a real-world job, such as going through a user request or completing a background job. You can use these metrics to identify performance bottlenecks, mark the slowest resources in the system, and diagnose issues that cause the system to take longer than usual to complete routine tasks.
With the latency metrics, you can categorize requests into successful and unsuccessful based on how quickly they can fulfill requests and add value to your business operations.
Traffic
The traffic metric measures how busy the components of your system, and the system itself in general, are. It captures the workload of your services to help you understand how much of your system’s capacity is under used.
Prolonged high or low values can indicate that the system needs to be optimized; it is either wasting resources or underperforming and losing on valuable incoming workload. Additionally, traffic is related to other metrics such as latency and can help you cross-check if both of them are behaving correctly together.
You can use traffic data to analyze how your system receives workload throughout a timeframe and can help you analyze based on traffic trends. It can also explain how your service’s performance degrades throughout various stages of usage.
Errors
Error is one of the most easily understood terms. It is crucial to track the count and occurrences of system and app errors to understand the health of your system. Some apps expose errors in clean, easy-to-read interfaces, while some cannot handle and log basic errors. Therefore it is vital to set up a dedicated layer of monitoring to identify and analyze error trends in your infrastructure.
The ability to distinguish between various types of errors can help you quickly pinpoint the nature of the issues impacting your application. A continuous occurrence of the same kind of error indicates that a particular component of your system is malfunctioning. This ability also gives you an upper hand in alerting, where you can customize the kind of alerts you receive for each type of error.
Saturation
Saturation measures how much of a particular resource is utilized. This metric is usually indicated by fractions or percentages and is generally provided only for resources with a clear total capacity. For other resources with less properly defined capacities, you might need to come up with some creative measurements.
Saturation data also provides information about the resources needed by a service or application to operate effectively. Since components in a typical system are usually inter-dependent, saturation provides a relative measurement of how well your system can handle workloads on a modular level.
Higher or irregular saturation values indicate that your system is juggling around to complete jobs and might need reconfiguration or optimization. Saturation and latency together can usually cross-check with an increase in error or traffic measurements in the underlying layers.
How to Use These Metrics
The four metrics discussed above are usually coupled with a system’s context to measure more detailed data. For instance, here’s how you would use the four metrics to measure CPU performance:
- Latency: Average/maximum delay in CPU scheduler
- Traffic: CPU utilization
- Errors: Errors specific to a processor or faulted CPUs
- Saturation: Run queue lengths
If you were to measure the memory performance, you would use the four metrics like this:
- Latency: Not applicable to memory
- Traffic: Amount of memory used
- Errors: Frequency of out of memory errors or segmentation faults
- Saturation: OOM killers, swap usage, etc.
In the case of storage devices, here’s what the four metrics would indicate:
- Latency: Average wait time for read/write
- Traffic: Read/write IO levels
- Errors: Filesystem errors, disk errors, etc.
- Saturation: IO queue depth
For networking signals, here’s how these metrics would look:
- Latency: Network driver queue
- Traffic: Incoming/outgoing bytes or packets per second
- Errors: Dropped packets, network device errors, etc.
- Saturation: Dropped packets, retransmitted segments, overruns, etc.
For client-facing applications, this is how you can use these four metrics:
- Latency: Time taken to complete requests
- Traffic: Number of requests served per second
- Errors: Application errors that occur while accessing resources or serving client requests
- Saturation: Percentage/amount of resources under use at the moment
In the case of multi-server systems and their inter-communication, here’s how you can utilize these four metrics:
- Latency: Time taken for the system to respond to requests or coordinate with peers
- Traffic: Number of requests that the system processes every second
- Errors: App errors that occur while processing client requests, reaching peers, or accessing resources
- Saturation: Amount of resources currently being used, number of servers currently operating at total capacity, number of available servers, etc.
If your system has external dependencies and a dedicated deployment environment, here’s how you can define the four metrics:
- Latency: Time taken to receive a response from the system or provision new resources from a vendor
- Traffic: Amount of work regularly pushed to external services or the number of requests made to an external API
- Errors: General error rates for service requests to third party APIs
- Saturation: Amount of throttled resources (instances, API requests, etc.) under use
If you are looking to measure the overall functionality and end-to-end experience of your app, here’s how you can leverage the four metrics:
- Latency: Time taken to complete user requests
- Traffic: Number of user requests received per second
- Errors: Errors occurring while processing client requests or accessing resources
- Saturation: Percentage of resources currently under use
Apart from tracking physical resource usage, gathering data on operating system abstractions that enforce limits is also a good practice. File handles and thread counts are some of the examples that fall in this category. These are not traditional physical resources but virtual limits put in place by the operating system to prevent processes from hogging all system resources. You can adjust most of such limitations manually, but tracking changes in the usage under these limits can help you identify potentially harmful usage trends in your software’s use.
Proven Methods for Infrastructure Monitoring
With proper knowledge of metrics and how to use them in various scenarios, you are ready to build a robust infrastructure monitoring setup for your app environment. However, here are a couple of points you can take care of to get the most out of your setup.
Choose a Reliable Vendor Partner
Your infrastructure vendor plays a significant role in the end-user experience of your application. Vendors that offer comprehensive documentation and support gain an upper hand in this contest.
However, you also need to test availability and MTTR before finalizing on a vendor since downtime with infrastructure is inevitable, and no support or documentation can help you instantly get your system back up. A faster MTTR will ensure that your customers do not have to bear the brunt of it.
Prioritize Using Data
This is a vital part of setting up your infrastructure monitoring. You can not keep track of every little thing that happens in your system. It is simply impossible to get alerts on each issue and take action on them. Therefore, you must track only those issues that hold importance to your app’s normal functioning. You can choose to safely ignore warnings and other irrelevant issues that arise due to third-party peripherals.
However, determining which issues to track and which to ignore is a sensitive task. One small mistake in this process can lead to hundreds of ignored occurrences of breaking issues. Therefore you need to analyze the alert trends before narrowing down on a small group of frequently occurring issues.
Configure a Comprehensive Alert System
The next step in the process is to configure a comprehensive alert system. Your alert system should send out instant alerts for issues and be intelligent enough to group similar ones for easy viewing. The system should have high specificity and high coverage. You should also aim to generate an increased number of alerts to instantly bring any new issue to light.
At the same time, you need to ensure that your system does not generate noise in creating a high number of alerts. Some systems allow you to prioritize events to determine the intensity with which the alerts related to those events send. This simple feature can work wonders for your alert system when used correctly.
Design Effective Event Resolution Processes
Once you have information on issues that have occurred, the next thing you need is a plan to resolve them. You can follow the categorization from the alerts system to group how you can resolve issues. You can also consider adding escalation as a part of your alert process to ensure that you have maximum hands on deck right from the beginning.
Categorizing issues helps you develop a small number of ready-to-use, dedicated issue resolution processes that you can quickly implement to reduce damage caused by the issues. Without such processes, you will scramble to look for remedies right when the issue occurs, adding to the chaos created by the issue already.
Implement Redundancy
A good error-proofing measure to consider is redundancy. Redundancy means keeping a few extra identical elements in your system that can take over as soon as an active element goes down. In the case of infrastructure monitoring, you need to monitor the same infrastructure from multiple locations to ensure that if one of your monitors goes down, the tracking does not stop, and you do not lose out on essential data.
Combine Monitoring Tools
You can also consider combining multiple monitoring tools to get the best from your infrastructure monitoring setup. You can also consider mixing up on-premises and cloud-based tools to segregate the monitoring jobs based on the type of platform that helps you do it best.
For tasks requiring more profound control and higher bandwidth, an on-premise setup will lower costs since you will be providing the hardware for the monitoring setup yourself. For other tasks that require scalability and high availability, you can opt for cloud-based IT setups, which are taken care of by cloud vendors and offer convenient pay-as-you-go pricing models.
Keep An Eye On Your Monitors
A common mistake that IT people make is that they sometimes rely too much on alerts. This means that instead of checking up on their system every once in a while, they wait for an alert to arrive, indicating that an issue that needs attention has occurred.
With prioritized alerting in place, this seems quite convenient but can go wrong in so many ways. You might mistakenly place a critical issue with a lower priority and miss out on its alerts. Or, you might mistakenly put a frequently-occurring error of low importance in a higher priority and fill up your alert box with noise.
Therefore, you should make it a habit to regularly check your monitoring dashboard for issues and incidents instead of relying on outbound alerts.
Prefer Buying Over Building Infrastructure Monitoring Tools
While setting up your monitoring system, you will face the question of buying or building the monitoring components. It is quite tempting to avoid the cost of purchasing a tool and getting locked in with a vendor. It has its benefits; your talent and support for the tool are entirely in-house, so there is no need to wait in queues to receive product support or wait for feature rollouts.
However, buying pre-built solutions from vendors is also a considerable alternative. You do not need to dedicate workforces to maintaining and developing yet another product. Most modern IT systems are complex, and it takes far more effort to replicate such an intricate system for your use in contrast to purchasing a monthly subscription of the same system from a vendor.
Review Metrics Regularly
Once you have an effective monitoring solution, your job is far from done. You need to constantly track and review the performance of your metrics to make sure that they are performing as expected. You might be missing out on important alerts due to the noise generated by alerts from too low thresholds, or worse, you might not be receiving alerts on critical issues due to too high thresholds for their metrics.
Therefore a regular review of metrics is crucial. As time progresses and your monitoring setup matures, you will be able to reduce the frequency of these reviews since your monitoring system will start to adapt to the requirements of your application infrastructure.
Conduct End-to-End Tests
The final piece to the infrastructure monitoring puzzle is to conduct end-to-end tests for testing the readiness of your error handling measures. Starting from active monitoring to instant alerts & escalation, and finally triggering workflows to resolve the issue. This needs to be done via effectiveness drills to ensure that your system is completely ready in the time of an actual issue.
In most cases, systems need fine-tuning after every update. Conduction regular drills ensure that you can track and analyze the effectiveness of your system like you would track any other metric in your application.
Infrastructure Monitoring Tools
Having seen the various ways in which you can set up an adequate infrastructure monitoring system, it is time to look at some of the popular tools in the domain that can help finish the job for you easily.
The Elastic Stack
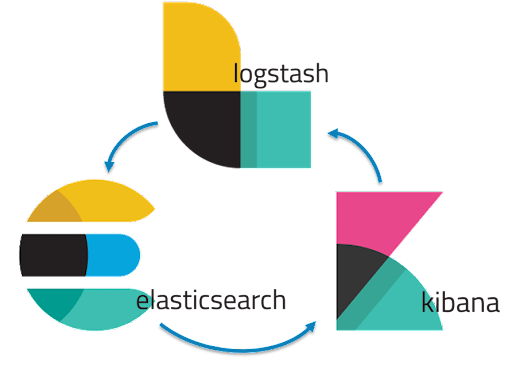
The Elastic Stack (ELK Stack) is one of the most popular combinations for monitoring and analyzing performance data. You can use this setup to instrument and log data from your infrastructure. ELK stands for ElasticSearch, Logstash, and Kibana. ElasticSearch takes care of search and analytics, Logstash helps inject and transform data from multiple sources, and Kibana helps visualize the data through the help of charts and graphs.
You can host ELK on-premises or in a hosted setup. Kibana dashboard allows you to view CPU or memory utilization and process-level statistics. You can customize, analyze, and visualize data in real-time to deliver in-depth insights. ELK is one of the few monitoring constructs that allows you to analyze telemetry data from distributed infrastructure in near real-time.
However, the ELK stack is a little complex to set up. It has a multi-step deployment process that needs time and experience to complete correctly. To ensure resiliency, data usability, and high availability, you need to configure a complex infrastructure setup that can be intimidating for smaller teams.
Nagios
Nagios is among the oldest infrastructure monitoring tools available. You can access it as an open-source tool (Nagios Core) and a paid enterprise solution (Nagios XI). The open-source tool (Nagios Core) is Linux-based and quite popular since you can extend it through official and community plugins.
Nagios can help you with centralized monitoring of your applications, system metrics, operating systems, and other components. Features such as availability and historical reports can be extended using third-party add-ons. Nagios is a highly available service for continuous infrastructure monitoring. You can view the visibility into your IT infrastructure through a single-pane dashboard. You can go so far as to set up automated remediation abilities using event handlers.
However, not all of these features are available in the free, open-source version. Additionally, you will need multiple add-ons for gaining access to the full suite of features.
PRTG Network Monitor
PRTG Network Monitor is an open-source monitoring tool that provides users with detailed infrastructure monitoring abilities for servers, virtual machines, applications, and networks. PRTG offers both agent-based and agentless monitoring alternatives
PRTG is relatively fast and easier to set up than most tools. It also provides you with a proprietary database. It offers a built-in dashboard for deep visibility to see outages, warnings, and alerts, all in the same place. With PRTG, you get a built-in map designer that you can use to visualize the network and connected components.
However, you can not install PRTG in a Linux environment, which most efficient applications run on. You also get sensor-based licensing with PRTG, which can get quite expensive for large environments.
Sematext Monitoring
Sematext Monitoring is an IT infrastructure monitoring tool that lets you gain real-time visibility into your on-premises and cloud deployments. You can view the health status of your infrastructure and monitor apps, servers, processes, events, databases, and much more. You can also use Sematext for gaining visibility into containerized apps that run in Docker or Kubernetes.
Sematext Monitoring supports automated discovery of issues. You can set up the Sematext agent to observe your environment for services that can be easily onboarded to the tool automatically to reduce the hassle in onboarding.
With Sematext, you get over 100 integrations for the most popular app stacks such as Apache Cassandra, Apache Spark, MongoDB, etc. You can collect server inventory and monitor for deviations, discrepancies, and obsolete packages. However, Sematext offers limited transaction tracing support and does not provide you with a full-featured profiler.
WhatsUp Gold
WhatsUp Gold is a network monitoring solution that can extend itself through modules to monitor other infrastructure components and apps. It offers comprehensive monitoring capabilities for virtual infrastructure hosted on Hyper-V or VMWare. Using this tool, you can get information on CPU, memory, network, disk, storage, etc.
WhatsUp Gold offers a reliable set of extensible plugins to add additional functionality to the tool. You get access to automated inventory reporting for servers, and the tool provides threshold-based alerting. You can also create custom dashboards to track the health of your infrastructure however you want to.
However, WhatsUp Gold is currently supported only on Windows. Also, you need to install and set up the WhatsUp Gold client locally in your infrastructure; it is not available as a hosted service.
Key Takeaways
Maintaining complete visibility into your IT infrastructure is just as crucial as gaining observability into your application's performance. It can help you make informed decisions about the growth of your app and prevent issues right in their tracks.
Managing the infrastructure monitoring setup of a medium to large network is not easy without software. You need to regularly assess your infrastructure's requirements to determine the right tools and resources to monitor your system perfectly.
As far as developer experience, cost-efficiency, and customer service for application performance monitoring, Scout APM provides you value for your money. Our products’ simplicity in terms of the user interface, initial set-up, and customer support is unmatched, considering our pricing models. You can try out the product for a 14-day free trial without any credit cards.
For more in-depth content around web development and a reliable tool for optimizing your application’s performance, navigate our blog and feel free to explore Scout APM with a free 14-day trial!

