Super-charge ActiveRecord#explain with pg-eyeballs 👀
When I have a slow Postgres ActiveRecord query, one of the first tools I reach for EXPLAIN
Those of you that know your way around ActiveRecord might be confused. ActiveRecord comes with #explainpg-eyeballs
- ActiveRecord just
runs EXPLAIN, not EXPLAIN ANALYZEon the query.Without ANALYZE, the query isn't actually executed, which means you can't compare the query planner's estimates with what actually happened. - The
Postgres EXPLAINoutput is noisy. It is difficult to grok if you aren't running the command frequently.pg-eyeballsmakes it easy to export the output to tools that provide a more user-friendly view of the query plan.
Let's look pg-eyeballs
Visualizing queries in rails console
I pg-eyeballsEXPLAINrails consolepg-eyeballs plays well with the
Here's an example:
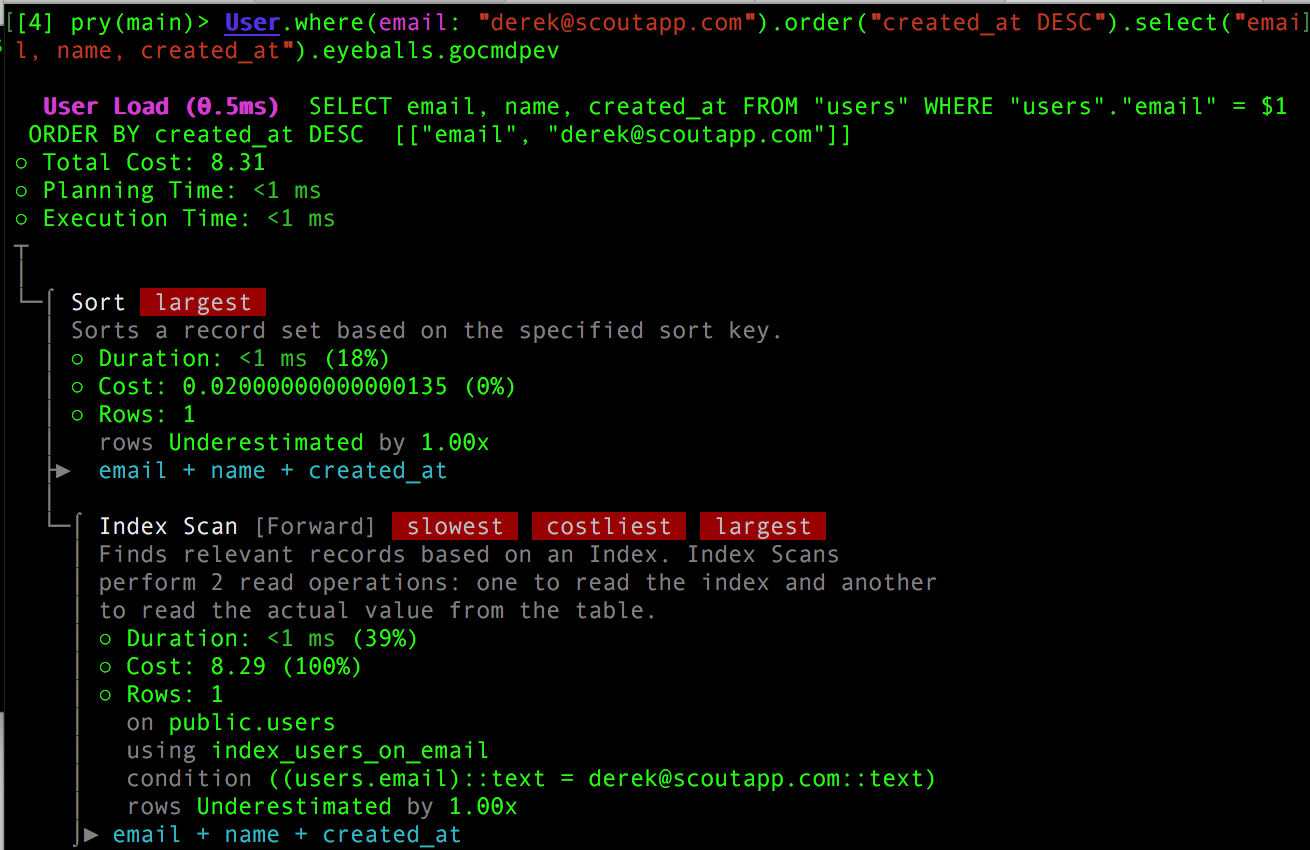
Notice gocmdpev
gocmdpev is a command-line Go app. You'll need to install this separately.
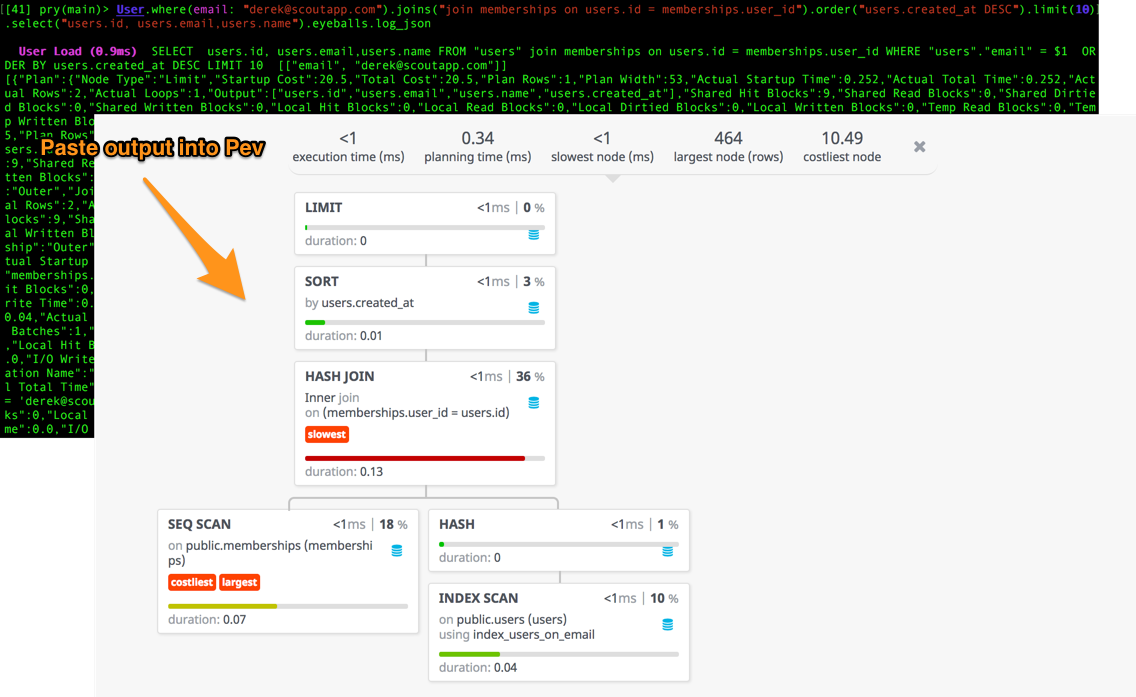
Outputing EXPLAIN results to Pev
While gocmdpev is my default eyeballs flavor, there are a couple of cases where I need a different visualization tool:
- There are many nodes in the query plan.
The gocmdpevoutput , which is displayed in the terminal, doesn't have the interactivity that a web UI can provide. - The ops team isn't excited about installing another binary on app servers.
In the above cases, I reach for Pev, the inspiration gocmdpev#log_json:
TL;DR
pg-eyeballs + EXPLAIN output. Find it at your nearest Ruby gem store.
Subscribe for more ActiveRecord optimization tips👇.