Alerting: A Key Part of Application Performance Monitoring
 Ganesh Mani
on
August 11, 2022
Ganesh Mani
on
August 11, 2022

In today’s digital world, users expect to have a seamless experience in their day-to-day applications. To achieve such reliability and stability in our application, information about the health and performance of an application has become necessary for developers to gain insights and fix bottlenecks to provide a seamless user experience.
One of the best ways to gain such insights into an application is to use a monitoring system. A monitoring system gathers metrics and analyzes, visualizes data, and alerts about the broken things.
Feel free to use these links to find your way around the guide:
- What is Monitoring
- What is Alerting
- Why Alerting is Crucial in APM
- Get Performance Alerts When They Matter Most
- Frequently Asked Questions
What is Monitoring?
Monitoring is a process of collecting metrics, visualizing the data, and identifying bottlenecks to fix potential issues. Metrics are the core element of monitoring. But, metrics are just raw data, whereas a monitoring system provides insights, or information, to the consumers. Therefore, it’s essential to understand the meaning of data and how it differs.
Monitoring takes the data, aggregates it, and represents it in various formats that allow us to extract insights from it. However, having just a monitoring system is not enough for a healthy production infrastructure. The team needs to disengage the engineer from monitoring a system 24/7. It’s almost impossible to keep monitoring a system for errors or traffic spikes. Let’s discuss how we can solve that issue using Alerts.
What is Alerting?
It’s difficult and time-consuming to monitor a system all the time. To solve that issue, alerting comes into play. It is a crucial element of a monitoring system. It performs an action based on the changes in metric values. Alerting allows us to disengage from the system and notify when needed.
Alerting is based on two major components.
- Metrics based
- Threshold-based
It’s also important to understand that not all situations require immediate attention. There are different levels of urgency in alerting.
Low Urgency
It’s a low urgency alert that records the metrics for future reference or investigation but does not require immediate attention. For instance, one of the services in the application is serving a slower response time for specific queries but not slow enough to affect the application. Such scenarios require future investigation, and we can avoid paying immediate attention.
Medium Urgency
The next level of alert requires attention but not immediate attention. We can consider it as a warning. For instance, It can be insufficient disk space, key expiry, or renewal in several days. The alerting system can send an email or notification to warn the user about the situation. It’s still an important alert to keep in mind and can be a potential problem if we miss it. At the same time, we don’t need to pay immediate attention to such warnings.
High Urgency
These urgent alerts require immediate attention, and teams need to consider this alert as a higher priority. Consider it as a message in “pager” for immediate attention. For instance, scenarios like high memory usage and slow response in the application or service can crash after a health check. These all require immediate attention and are fixed as soon as possible.
Why Alerting is Crucial in APM
Believe it or not, Alerting is one of the crucial elements of a monitoring system. It acts as a passive monitoring system that helps the engineers avoid actively monitoring the services. Let’s discuss why alerting is a crucial part of application performance monitoring.
Reason #1: Collect the Data You Want
The monitoring system starts by collecting low-level usage metrics by an operating system, such as disk space, CPU load, and memory usage. On top of that, you can add metrics that can be important for an application.
The efficiency of the monitoring system depends on the type of metrics that your system collects. So, it’s important to monitor the kind of metrics that the system collects. There are different levels of metrics available in the service. They are,
Host-based Metrics
These metrics are from a low level of a service or application. It helps to evaluate the health and performance of a hosting machine. Metric contains,
- CPU usage
- Memory Usage
- Storage
- Processes
Application Metrics
These metrics are application or service level. It depends on the type of service and its dependency. Application metrics are indicators of the health and performance of specific services. Some of the application metrics are:
- Error and Success rates
- Resource usage
- Network latency and response time
Dependency Metrics
Dependency metrics are for tracking the services that have an external dependency. Tracking service with external dependency can help avoid system failure if the service is down. Some of the metrics are:
- Error and Success rates.
- Resource usage.
- Network latency and response time.
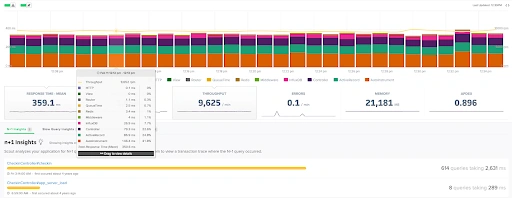
Scout APM traces some crucial metrics that help for great insights into the monitoring process.
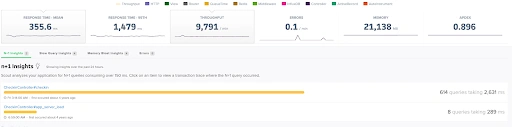
Scout collects metrics such as response time, throughput, errors, memory, and apdex of a specific service. In addition, it also tracks the host-based metrics such as memory usage and CPU usage.
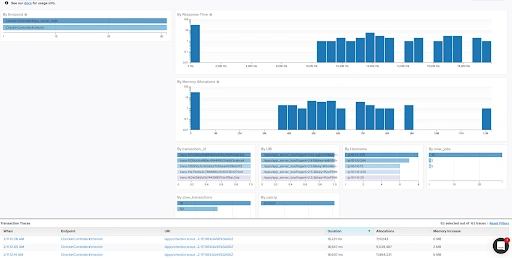
It also provides an in-depth analysis of response time and memory allocation of a service or application that we will discuss in data visualization in detail.
Reason #2 - Visualize the Data
One of the main reasons to collect metrics is to take action against it. For that, the metrics collection should be visualizable in an understandable way. Visualizing the data in a human-understandable format helps recognize trends and understand how the application performs when different components fit together. It also helps predict and identify the performance bottleneck by analyzing the pattern with historical data.
It’s important that a monitoring system addresses it and helps us visualize the data in an understandable format.
For example, here, ScoutAPM provides an intuitive dashboard with important metrics such as response time throughput on each specific component. Visualization like this can help identify the bottleneck or issue at first glance.
Visualization doesn’t always mean representing metrics in charts and graphs. It entirely depends on the type of metrics and choosing a suitable visualization format that users can understand easily.
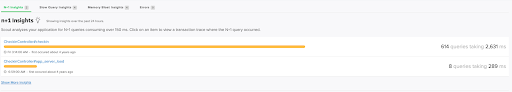
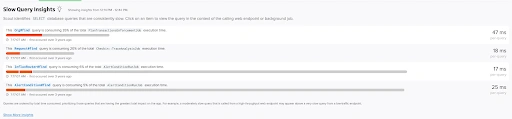
Here, ScoutAPM analyzes the slow N+1 queries and memory bloats. Data like this are better with listings than representing them in a chart or graph.
Reason #3 - Identify Issues Within the Application
Data can originate from various inputs. It’s important that monitoring systems process, organize, and correlate them to make it more efficient to analyze the data. For example, if an application experiences a spike in traffic, the monitoring system should discover that such an event can coincide with resource exhaustion of related resources. One of the benefits of a monitoring system is identifying the issues within an application or service. Let’s say that we collect the data from the service and store it. It’s difficult for us to identify the issues ourselves without a monitoring system.
A monitoring system identifies some crucial issues that we can miss. For instance, ScoutAPM analyzes and determines the SELECT data queries that are consistently slow. Furthermore, we can see that the ScoutAPM processes the collected metrics and visualizes them by comparing them with the total execution time. Another feature is that it lists all the queries ordered by total time consumed, prioritizing those queries having the highest impact on the app.
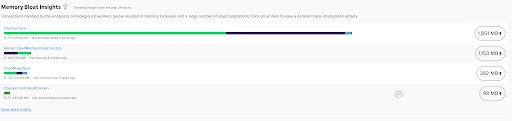
Memory Bloat insights from Scout is another excellent example of identifying issues within the application.
Reason #4 - Apply Alerts To Reduce Future Issues
As we discussed, alerting is a crucial element of a monitoring system. It helps us to disengage active engagement with the system. It notifies us based on the urgency level of an issue. But, it’s our job to determine and configure the severity level of an alert. It helps to avoid false signals and unnecessary interruptions.
Some of the context rules to configure the severity of alerts are:
- Severity depends on the application environment. If it’s staging, then it doesn’t require immediate attention. If it’s production, it might require immediate attention.
- It depends on the severity of resource renewal, expiry, and disk usage alerts. It doesn't require immediate attention if it’s happening in several days, and it can be medium severity.
- If a service is down or impacting user experience, it requires immediate attention. Because it impacts the customer experience and thus affects the business.
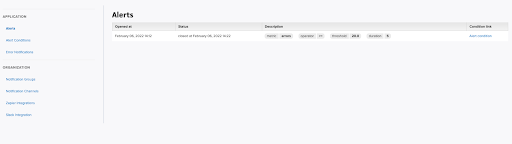
Configuring severity for alerts differs for each monitoring system. For example, Scout has Alerts, Alert conditions, and Error notification configuration.
The Alerts section shows all the alerts we have and can configure for the application or service. For example, we have an alert to notify us if the threshold reaches more than or equal to 20.
Once we configure the alert condition, we can choose a notification channel for an alert.
To add a notification group, we need to select the group and click `Add Notification Group.` On top of that, we can also create a new notification group and add them here.
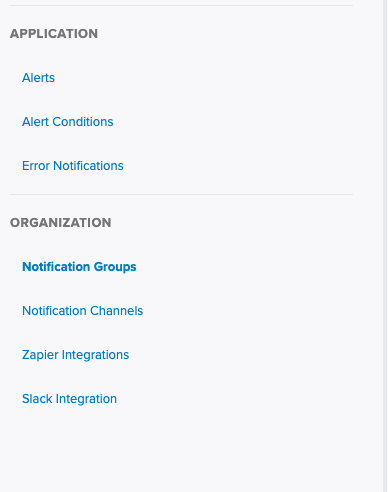
To create a new notification group, goto Notification Groups can select different channels such as Email channels, Slack channels, Webhook, etc.
Get Performance Alerts When They Matter Most
A monitoring system has become an essential part of managing a robust application. Collecting metrics, analyzing, visualizing the data, and gathering insights into your infrastructure are key to a healthy production environment.
Once the application starts to grow, it will become difficult to monitor the system all by ourselves. That’s when and why we need an efficient alerting system because we can’t keep engaging engineers to monitor a system. A reliable monitoring system helps engineers solve issues faster and impress customers with a seamless user experience.


