Appdynamics vs. Splunk vs. Scout | Key Features Compared
 Kumar Harsh
on
August 24, 2021
Kumar Harsh
on
August 24, 2021
Application Performance Monitoring is a crucial necessity for modern businesses. No application can survive without a proper monitoring system. There are way too many things that can go wrong, so you must put your best foot forward in terms of choosing a monitoring system that is effective and economical at the same time.
This guide aims to help you decide between three top application performance monitoring tools in the market - AppDynamics, Splunk, and Scout. Here, we have put forward the most critical bits of the three platforms in one place to help you see through them. We have also shared concise bottom lines to help you out of any confusion that you may encounter in the process.
Feel free to navigate the guide using these links:
- Background
- Comparison Summary
- Core APM Product Features
- Pricing Comparison
- Usability and Dashboards
- Integration Options
- Installation
- Make an Informed Decision
Background
Before we compare the three platforms, let us take a moment to gain some background knowledge on the subject. To choose the best APM provider, we must first understand the aim and intent of APM and how the three alternatives discussed above fulfill them.
What is an APM?
Application Performance Monitoring (APM) is a software-based approach to monitoring and observing other software solutions in real-time production environments. APM tools help keep a record of an application’s usage and performance history over time and help you find relations between performance trends and external factors like traffic, time of the day, etc.
APMs help identify and resolve incoming performance issues as fast as possible. In preparing to handle problems, APMs have evolved to become much more than conventional monitoring solutions. Some APMs have gone so far as to incorporate artificial intelligence to predict issues well before they arise!
Why do you need an APM?
As mentioned before, monitoring is a crucial component of the modern operations process. Modern services demand minimal issues and near to zero downtime. To keep up with these standards, it is vital to have an eye on the status of your application.
APM helps in this process by keeping a real-time check on the various trends in the health of your application. Many impending issues show some abnormalities in the metrics before taking your application down. If you read these correctly, you can save a lot of time you would have spent otherwise in after-breakdown reconnaissance.
APMs are also used to track user approval of your application. This data helps in making scientific, reason-backed product decisions. Such decisions are bound to be adopted well by the users and enhance your application’s revenues.
What is AppDynamics?
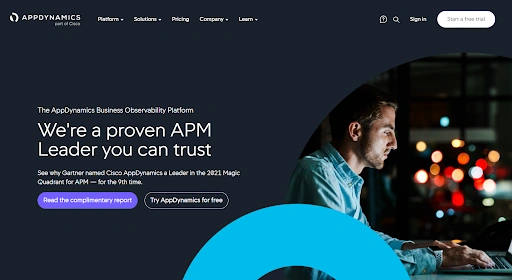
AppDynamics, also known as AppD, is a suite of intelligent application performance monitoring solutions. AppD has tools for covering the application, user, and business performance of an application. This setup helps ops teams traverse through reports and insights quickly. Teams can follow an intricate, software-driven approach to analyze the performance data.
AppD offers a wide range of services, including Real User Monitoring, Business Monitoring, and more. These services are used hand-in-hand in real-time scenarios.
What is Splunk?
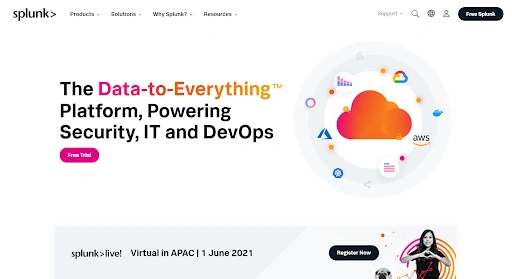
Splunk is an APM solution that allows users to monitor applications using machine data. Splunk emphasizes real-time streaming of application data via its dashboards. With Splunk, you can view the resources that are up or down or face any performance issues. Splunk also helps in converting log data into metrics.
Splunk integrates with external services well, and you can easily stream real-time data from services like AWS Firehose Kinesis and Apache Kafka.
What is Scout?
Scout APM is an application performance monitoring solution built to solve developers’ common problems and provide the best analytics experience in class. Scout presents a developer-friendly interface, powerful tracing features, and real-time alerting to always keep you in the loop on what’s happening inside your apps. Scout makes debugging highly simple by tying bottlenecks directly to the lines in the source code which cause them.
Scout is famous for the dedicated APM experience that it offers for Rails applications. With features like N+1 and slow queries detection, ActiveRecord metrics, and more, it feels effortless to identify and fix performance bottlenecks using Scout. On top of all this, Scout fares well on pricing. There is a pricing plan for all scales of organizations so that it does not stop you from getting a top-class APM experience.
Comparison Summary
AppDynamics, Splunk, and Scout turn out to be close competitors in terms of the service that each of them offers. It is essential to understand your requirements and scale before choosing any one of these.
If you are comfortable with a large budget and need a good amount of features, AppDynamics is the perfect alternative for you. If you are looking for just a single APM service, such as log management or real-user monitoring at the best price possible, Splunk is your APM platform. Other than that, Scout offers a dedicated experience and quality customer service to organizations of all scales looking for an easy-to-use APM solution.
Core APM Product Features
Core APM features offered by any APM platform usually matter the most in deciding which solution is worth investing your money in. A platform may provide hundreds of features but not the one that you are looking for. It will be a waste of time and resources if you set your application up using an APM and realize that it lacks something later.
Another essential thing to keep in mind while glancing down the list of features is to ensure that it does not “over-offer”. This is because if an APM product offers way more features than you are looking for, there are high chances that you will have a complex dashboard to use every day. Hence it is essential to find a product whose features align with your needs to the maximum extent possible.
Appdynamics Core Features
AppDynamics caters to a broad international audience. This is why it offers a long line of features that can help meet every client’s needs. Going deep into each of them is out of the scope of this article. Here are some of the most popular core features offered by AppD.
Application Performance Monitoring
AppDynamics is a strong contender in the competition of the most popular application performance monitoring offerings in the industry. With AppDynamics, you can monitor every swipe, tap, click, and other interactions that happen inside your applications. AppDynamics offers a collection of tools large enough to observe every aspect of your application and establish complete observability.
Additionally, AppD leverages the power of machine learning to help analyze irregularities and trace them back to an upcoming issue quickly. Because of its intelligent diagnostic systems, reducing MTTR is very easy.
End-User Experience Monitoring
End-User Experience Monitoring refers to analyzing the experience of the app’s users. While detecting internal issues of an application is essential, it is also vital to check whether users get the intended experience.
AppDynamics covers End-User Experience Monitoring via three different products—Browser Real-User, Browser Synthetic, and Mobile Real-Time.
Browser Real-User makes use of a JavaScript injection in the browser to record the end-user experiences. This helps in viewing the application as the user did and identifying the UX and performance irregularities.
Browser Synthetic emulates traffic from real-time browsers to monitor the availability of an application. It does so from different regions worldwide to check on high latency causing bad experiences to your users.
Mobile Real-Time helps to monitor mobile application performance. It enables developers to understand the cause behind a mobile application’s crash. On top of that, it also collects data on metrics like latency details, application issues, warnings, etc.
Customized Transaction Profiling
AppD allows developers to mark and observe specific transactions throughout applications using a feature called User-Defined Transaction Profiling. This helps track the progress of custom transactions to understand the impact of custom code on the application. Other than that, AppD also captures business transaction performance spikes and provides detailed stack traces for each event.
Component Deep Dive Monitoring
Component Deep Dive Monitoring is a feature that helps developers to understand the smaller components of an application in detail. With this feature, developers can observe the performance or anomalies occurring in individual components quickly. This often helps in getting to the bottom of bottlenecks and fixing them.
AppD can capture such data for applications built using Java, .NET, PHP, iOS, Android, Scala, Node.JS, and C/C++. The stack traces provided in this case are highly detailed and can help you identify which class or object is causing an issue.
Analytics & Logging
Analytics and logging are vital to making use of the data that APMs collect over time. AppD offers a dedicated product for this use—Log Analytics. Log Analytics helps developers to index and analyze the log files that are generated by APM tools. Such an approach is also popular among other APM solutions like Splunk and ELK.
AppD supports the collection of structured and unstructured data alike and can display issues independent of each other. AppD also supports streaming errors in real-time so that you can track issues as they occur in your application. Searching through the logs of error records and creating custom alerts or dashboards is also easy.
Splunk Core Features
Splunk is a top APM solution for businesses around the world. To maintain its position, Splunk offers a wide variety of services as well as top-class customer service. Here are some of the top features provided by Splunk.
Application Performance Monitoring
Splunk offers a detailed view of the application’s performance and health. Its APM UI feels so intuitive yet precise that you quickly tell if there is an anomaly in the trends with just a glance.
Splunk reinforces its performance monitoring with machine learning to detect patterns in the performance data and establish useful baselines. Machine learning helps to plan your application’s growth for the future and provides you with the data to ensure your app’s success in the future.
Cloud Monitoring
Splunk offers services to manage cloud and hybrid services and cloud migration. Cloud monitoring offered by Splunk also looks into the costs that you are incurring on the services used on the cloud. This helps you to optimize your usage, both performance-wise and cost-wise. Having an idea of where you’re spending more enables you to look for cheaper alternatives or to judge the viability of using that type of service at all.
Server Monitoring
Server Monitoring is one of the features offered by Splunk that lets you look into your physical and virtual servers for performance issues or bottlenecks. Latencies and load hogs become easy to spot, and you can take action before a server succumbs to these issues.
With Splunk, you can also view the activity of connected servers housed in data centers and distributed infrastructures. You can quickly look through multiple tiers of infrastructure to find the cause of a server issue to address it.
Machine Learning Toolkit
Splunk offers a Machine Learning Toolkit to help users detect anomalies in their application performance data. MLT can see when performance runs out of a set norm and alert you instantly. This helps in stopping problems before they even occur.
Splunk’s MLT offers predictive analysis too, which helps project the future performance of the application. This helps to detect long-term trends and address them well before they break something.
Scout Core Features
Scout APM is a leading-edge, dedicated APM solution that caters best to the needs of start-up, small, and medium organizations alike. Scout offers top-class monitoring solutions for Rails, Python, PHP, Elixr and Node.JS applications.
Scout specializes in application and database monitoring and delivers commendable findings in the fields of memory consumption, database querying, endpoint performance, and much more. Given below is a list of some of the most popular features offered by Scout.
Application Performance Monitoring
Scout APM is known to be one of the most customized and affordable APM solutions in the industry. Scout brings together in-depth monitoring, tracking, and real-time alerting that provides the best observability results possible.
Scout also believes in keeping things as simple as they can be. This is why Scout’s APM solution lays out monitoring features and metrics in a minimalistic style, which helps developers get the best out of the data quickly.
Detailed SQL Analytics
SQL is an integral part of modern applications. Many companies prefer SQL due to its highly structured design and reliability. But more often than not, SQL becomes the source of application performance bottlenecks. Scout helps you see through your SQL databases and enable capturing a sanitized version of queries.
Scout collects transaction traces across all web endpoints and background jobs. When coupled with the SQL metrics, these traces help provide a clear idea of where your application is losing performance and leaking resources.
Memory Bloat Detection
Memory bloat is defined as the memory consumption of an application rising unexpectedly over multiple executions. This is a common issue among apps that are not tested adequately before deploying to a real-world user pool.
In environments like Ruby, garbage-collected objects do not release memory instantly. This delay gets magnified over the high number of executions in a real-time scenario and can bring down the entire server. Scout’s memory bloat detection metrics help keep a check on the memory consumption of applications and notifies in the case of a high memory usage event.
Database Monitoring
Database monitoring helps to analyze database query performance and extract detailed information on each query individually. These two, when put together, assist in locating the source of slow query performance and other related bottlenecks.
Zooming and capacity overload are some prominent database issues that take down applications. Scout’s database monitoring helps in keeping a check on these things.
Endpoint Performance Monitoring
If the database is doing well, and yet your application is reporting bottlenecks, maybe it is time to check your endpoints. There are times when an endpoint cannot handle all of the incoming requests, which results in some of the requests going unfulfilled. This ultimately results in a broken user experience.
Scout can help you view metrics for specific controller-actions and background job workers. It allows you to sort traces by the response time, date, object allocations, etc.
Auto Instrumentation
Most applications use custom code for a small number of transactions. This can sometimes be a cause of bottlenecks since custom code can misuse resources if not tested properly. When tracking the performance of these segments of the application, the traces show up as “Controller” or “Job”. The AutoInstruments feature offered by Scout can help in breaking down the time spent in the custom code segment without the hassle of adding custom instrumentation manually.
At the moment, this feature is in beta and is available for specific languages and frameworks only.
Analytics & Logging
Another strong point of Scout APM is analytics. Scout offers high-speed, noise-free real-time logging for all performance-related events. You can drill deep down in your traces using the dashboard, and you can also view the line of source code causing an issue along with the problem itself.
Scout overlays backtraces with git blame output, enabling the team to quickly identify the developer who had contributed to the faulty segment to address the remedy.
Bottom Line
After analyzing the core features of the three APM platforms, the essence comes out to be:
- Scout offers dedicated features and is, therefore, best suited for small to midsize companies.
- AppDynamics is well suited to the requirements of large organizations and enterprises.
- Splunk offers service to organizations of all scales.
Pricing Comparison
The next benchmark to look out for after considering the features offered by each of these is pricing. Pricing is an important filter to determine if a product is viable for your business. If more than one solution turns out to be affordable, it is essential to choose the one that gives the maximum value for your dollar and fits your business size.
More often than not, features and pricing go together. Prices rise with an increasing number of features and customizations. Hence, flexibility in pricing is one of the most important characteristics to look out for.
As far as pricing is concerned, Scout APM is versatile and flexible making it ideal for small to midsize companies. AppDynamics tends to be suitable for large, enterprise organizations and Splunk’s pricing varies due to the level of customization it offers in its pricing models.
Usability and Dashboards
Sometimes, the APMs with the best features and pricing can lag behind their competitors because of the complexity involved in using them. If a software team finds it difficult to engage with the tool quickly, it will lower their productivity to a great extent.
As soon as the number of features goes up, the usability of any application gets affected. This is where good design can save the day. It is evident that APMs need to strike a balance between features and usability.
Appdynamics UI
AppD’s user interface is known to be among the best in the APM lineup. AppDynamics offers multiple graphical tools to drill deep into the collected data and visualize the connections among various metrics.
However, this wide variety of available features is sometimes known to hamper the developer experience. As a beginner, it can get challenging to digest all of the information available on the AppD dashboard at once. Hence, it can get challenging to get a hold of things if you are new to AppD.
Splunk UI
Customers report that they find Splunk’s interface and design ‘awesome’ to fulfill their APM needs. Splunk helps to correlate data across multiple systems using one interface. This further helps to know your application’s environment and status better and utilize incident data in ways never imagined before.
The interface is easy to understand, graphs are good to view insights, and Splunk makes it easy for users to export reports. The simplicity of the UI enhances troubleshooting and makes debugging super easy. However, the UI tends to get slow over time with increasing data. Some users have reported slow query search results due to the sluggishness of data-heavy UI.
Scout APM UI
Scout is a popular APM solution, mainly for its simplistic design and incredible ease of use. Scout APM prioritizes developer experience and offers the most reasonable and clutter-free user interface. Scout provides a web-based interface that you can access using any web browser. The interface displays complete details of your application’s performance and is accessible without installing any software.
Scout believes in keeping concise yet on-point. It does not clutter your screen with too many services or views at once. Instead, the essential and most popular views and dashboards are enabled by default. You can then choose to update them with your preferences. Scout’s dashboard is easy enough for every beginner.
Bottom Line
As far as the user interface is considered, AppDynamics beats the other two fair and square. Splunk gets close, but the issue of sluggish UI on large data operations takes it back. However, if you are a fan of low clutter and ease of use, Scout is worth a shot.
Integration Options
The prime use of an APM application is to monitor the performance and usage of other applications. However, APMs are also required to be compatible with other applications where teams collaborate and share information. This helps developers get notified of what is happening in their applications while working with other tools.
Offering a large number of third-party integrations is crucial for an APM solution to be comfortable to use. Integrations help teams receive updates in their communication channels directly, as they supply APM’s data to third-party applications quickly via webhooks and APIs. These can help your team increase their productivity as well as maintain visibility over an app easily.
Appdynamics Integrations
AppD offers an open-for-all community to enable developers to share their plugins with other developers. Known as the AppDynamics Exchange, the marketplace contains around 137 articles when writing this article. The marketplace also allows users to request plugins that are not available at the moment.
If you glance through the list, you will realize that most essential plugins are already available, like alerting, Big Data, AWS, etc. In case you feel something is missing, you can always request it.
Splunk Integrations
Splunk offers a collection of plugins called Apps. This collection includes various integrations such as Amazon Web Services, VMWare, Linux, DB Connect, and more. Each of these integrations helps users connect with more and more services to smoothen the cross-product experience.
Scout APM Integrations
Scout offers multiple essential plugins to help customers get started with monitoring easily. The plugins provided by Scout cover git, alerting, error monitoring, and sso. All of these are well-tested and are used by APM users all around the world.
Bottom Line
While Splunk and AppDynamics offer more integrations than Scout, if you consider the direct customer base of these three products, you will find that Scout serves just the correct number of integrations needed by their customers.
Installation
Having analyzed all other benchmarks, the last criterion is the simplicity of the installation process. The installation process affects your impression of the tools even before you start using them.
The complexity in the process also indicates the priorities of the APM providers. Some choose to go all out, increasing the number of features that their APM offers. In this process, they forget to make it simple for those new to the software or are looking to use only one or two core features. This often leads to customers getting turned off in the installation process only and thus never reaching the plethora of services that the tools have to offer.
Appdynamics Installation
AppDynamics offers a slightly unconventional installation process. Installation is a 4-step process, but there is an unaccounted delay in the middle. This delay is reported by many users to take up around one hour and is most probably the time that AppD takes to set things running in the background.
Due to this delay, the process seems a little unguided. The documentation does not seem to make the purpose and occurrence of this issue clear enough, which causes anxiety among many people who go through the process.
Splunk Installation
Splunk is no doubt a vast tool. Therefore with every increasing feature, the installation process tends to get more advanced. It is recommended to learn as much as you can before you set down for a large Splunk installation.
Starting with a small set of services is excellent since there are not many things to worry about. But as the installation matures, you need to put more and more effort into understanding the various moving parts of the process like folder structure, permissions, app installations, etc.
The good thing is that Splunk offers a great deal of documentation to help along the process. But people tend to remain indifferent and thus keep making lots of mistakes that further complicate the process. With an advanced tool like Splunk, it is essential to follow instructions when setting things up by yourself.
Scout APM Installation
The Scout APM experience is best in class for developers since Scout’s processes are built keeping developers in mind. The installation process is much more straightforward than other tools, and there are no unexpected delays or gaps along the way. Some people report that setting up Scout APM for their Ruby apps took them around 30 seconds!
Bottom Line
Among the three, Scout offers the most comfortable and safe installation experience. Scout’s quality of customer support and documentation is commendable, and if you are a fan of good customer service, Scout is the way to go!
Make an Informed Decision
This article analyzed three popular application performance monitoring solutions - AppDynamics, Splunk, and Scout. We set these against one another to understand their differences and their importance to observability in modern applications. We analyzed these solutions independently and then defined five criteria to judge them by - Features, Pricing, UI, Integration, and Installation. For each benchmark, we made a list of what every APM had to contribute and which one of the three stood apart with its offerings.
Scout APM tended to rise on the top due to its developer-friendly interface and apt features in all of our comparisons. The simplicity that Scout offers in interfaces, alerting, and navigation is top-class, considering its pricing. You can try it out for a 14-day free trial (no credit card required).
For more in-depth content around web development and a reliable tool for optimizing your application’s performance, navigate our blog and feel free to explore ScoutAPM with a free 14-day trial!