What is Cloud-Native Monitoring?
 Scout APM
on
April 05, 2022
Scout APM
on
April 05, 2022
Cloud and cloud-based technologies are at their peak today. More and more organizations are turning to intelligent architectures and systems to deploy their apps. And they are not wrong—the cloud has proven to be a great way of performance optimization and cost-cutting. However, there are issues to address with this growing trend. One of those is monitoring.
Monitoring is a vital part of application maintenance. With the growing cloud adoption trend, monitoring distributed apps based on remote cloud infrastructure has become quite an issue. However, many platforms and vendors have tried to solve this problem, giving birth to the concept of cloud-native monitoring.
In this guide, we will talk about cloud-native monitoring and how it is different from traditional monolithic app monitoring. We will also discuss the various areas on which it focuses. Without further ado, let’s begin!
Feel free to navigate this guide using the links below:
- How Do We Define “Cloud-Native Monitoring”?
- High-Impact Metrics: What Should We Monitor?
- Tools For Monitoring Cloud-Based Applications
- How To Scale Cloud-Native Monitoring Efforts
- Closing Thoughts
How Do We Define “Cloud-Native Monitoring?”
Cloud-native monitoring is the process of leveraging cloud systems to monitor cloud-native or distributed applications. Cloud-native monitoring mainly focuses on microservices-based or distributed monolithic applications. Naturally, it utilizes the cloud for storing and processing logs.
Cloud-native monitoring aims at improving the traditional DevOps process, and machine learning is a powerful tool it implements to track possible issues before they happen. The other thing that cloud-native monitoring is crazy about is the real-time, consistent data availability. The closely-knit structure of cloud-native monitoring does not allow for any issues or events to pass under the radar—everything must be tracked and analyzed.
Monitoring Cloud-Based vs. Monolithic Applications
Monitoring has always been about applications and services. Most leading monitoring solutions of today were born in a time when cloud or cloud-native was not prevalent. Hence they were meant for monolithic applications deployed on conventional servers. However, today’s apps are not built as monolithic instances on a single server; they are broken down and composed using services and microservices.
Therefore monitoring has had to grow and adapt to such architectures. Modern cloud-native monitoring is much more than just tracking and logging each system component. It is an ecosystem of observing each aspect of your system components aided with machine-learning-enabled tools that help you look into the past, present, and the predicted future of your system.
High-Impact Metrics: What Should We Monitor?
Before getting started with Cloud-Native monitoring, you should understand your monitoring aims and benchmarks. Without a well-defined set of metrics and methods, it can be challenging to understand if your cloud-monitoring efforts are going in the right direction. This section will discuss the four pillars of monitoring and how you can apply them to cloud-native monitoring for optimal results.
The Four Golden Signals
Monitoring of any kind relies on four standard, highly extensible metrics. These metrics, when put together, can give you all the information that you need about your system’s performance and health.
These four metrics are latency, traffic, errors, and saturation (Google’s SRE handbook.) They are used in all aspects of monitoring to gain actionable insights.
Latency
You can view latency as the time it takes for a system or a service to fulfill a request. Latency is a broad term that covers the time taken for the request to travel to and from the service via the network and the time taken to process and return a result for the request. In case of a failure, the time taken for the service to produce an appropriate response can be unpredictable due to irregular error management practices.
Therefore it is crucial that you understand and analyze the latency numbers for successful and unsuccessful results separately. This, in no way, means that you should ignore error latency. Error latency helps you understand which segments of your app do not handle errors appropriately. Hence tracking them can help you improve the error management measures implemented in your application.
Traffic
You can view traffic as a measure of how much workload is being sent to your system regularly. There are various ways to measure this metric depending upon the system under consideration. For instance, database-specific systems will define traffic as the number of database transactions made every second. A REST API would define traffic as the number of HTTP requests it receives per second. For a video streaming service, traffic can be both bytes downloaded per second or concurrent streaming connections.
In any case, you must monitor the health and performance of your application with rising and falling traffic values to understand how well your system can scale and adapt to users’ needs.
Errors
You can view errors as the number of requests that fail to provide the right results to the end-users. This failure could be in multiple forms—an explicit failure of HTTP requests, a successful HTTP request that returns undesired results, or slow requests that exceed the set service standards. Monitoring these forms can be a daunting task in itself, as even though all of these are errors, they occur at different places and require various measures to identify.
Error tracking is an independent segment of monitoring with dedicated techniques and solutions. Many solutions simplify this process by collecting stack traces and environment information to identify the cause of errors and aid in the resolution process. Keeping an eye on this metric ensures that you strive to deliver the promised level of services to your users.
Saturation
You can view saturation as how full or loaded your system is. It can measure what fraction of your memory or CPU is utilized constantly. It can also indicate how much of your processing bandwidth (network or I/O) is used by your end-users continuously. Saturation is an important metric because system performance changes according to changing utilization numbers. Your system might not behave the same at 80% utilization as it did at 40%. Therefore you need to set a target for how much your system should stay saturated for best performance.
Saturation can help you set realistic workload targets. For instance, you could aim for building a service that can automatically handle a 10-20% change in incoming traffic. Or a service that can scale automatically to handle double or half of its target workload. Such systems are difficult to build and even more challenging to monitor and test. Tracking saturation can give you an excellent place to start.
The USE Method
The USE method is a decade-old technique used to analyze and improve the performance of cloud computing environments. Brendan Gregg talked about it at length in the paper Thinking Methodically About Performance published in ACMQ. The USE method is:“For every resource, check the Utilization, Saturation, and Errors”.
In the above expansion, this is what the terms stand for:
- Resource: Physical and virtual server components, including processing and memory units, storage devices, controllers, etc.
- Utilization: Average time for which the said resource was busy handling requests.
- Saturation: The amount of extra work that the resource has queued up already.
- Errors: The number of error-related events.
In a nutshell, you create a checklist of metrics as suggested above and troubleshoot issues in a fixed order following the list. Brendan has also published an extensive blog on this technique and its implementation, where you can learn more about it.
The RED Method
The RED Method is based on the USE method but is constrained to service monitoring only. Coined at Weaveworks by Tom Wilkie and the team, the RED method focuses on monitoring your application from the end user’s point of view. Here’s what the terms in the abbreviation stand for:
- Rate: The number of requests served by your service every second.
- Errors: The number of failed requests every second
- Duration: The time it takes for your system to respond to an average request.
Instead of adapting to the needs of every microservice uniquely, the RED method suggests standardizing the process and metrics. This will give you numerous opportunities to automate tasks and reduce your DevOps workload. You can read more about it on the Weaveworks blog.
Tools for Monitoring Cloud-Based Applications
Once you understand what to look for, all you need is the right set of tools. This section will discuss some essential tools to easily monitor cloud-native and cloud-based applications.
NetData.Cloud
NetData.Cloud is an open-source distributed systems monitoring platform for cloud ecosystems. The most striking feature of this tool is that it is entirely free to use. NetData provides real-time insights into infrastructure and applications, and it also monitors vulnerabilities inside the systems. You can instantly diagnose slow-down and anomalies with many metrics, visualizations, and insightful health alarms.
Features
- Provides real-time event and performance metrics at scale
- Detects and monitors thousands of metrics automatically from various services and apps
- Available as open-source software for free use
- Seamless, quick installation process
Pros
- Has a real-time, consistent data collection mechanism
- Monitors for all possible data sources
- Can include thousands of metrics per node
- Dashboards optimized for visual anomaly detection
- Has an alarm-type notification system for detecting and alerting for issues
- Employs machine learning for reducing noise and improving data quality
- Has a custom database engine that stores and manages your data intelligently
Cons
- Does not provide a mobile application
- Has limited documentation as of now
- Creating custom dashboards requires writing HTML manually
Dynatrace
Dynatrace is one of the few full-stack observability solutions that prioritize users in their monitoring methodology. With Dynatrace, you can also monitor your cloud apps, infrastructures, and logs. You need to install a single running agent that you can control with the Dynatrace UI, and this makes installation and usage of the tool relatively easy. Dynatrace is available in SaaS, Managed, and On-Premise models.
Features
- Top-quality log analysis
- Automatically detects common log types
- Powerful dashboards and rich integration options for common tools
- Offers Real User Monitoring (RUM) and Synthetic Monitoring
- Integrates with Docker, Kubernetes, and OpenShift
- Compatible with popular cloud platforms like AWS, Microsoft Azure, GCP, etc.
- Provides a virtual assistant that answers FAQs quickly
Pros
- Offers a simple agent installation process and guides new users through its installation UI
- The tool's rich integration options enable monitoring everything inside your app through the Dynatrace UI itself.
- Offers problem-solving functionalities to find solutions quicker
- Provides a top-to-bottom view of the complete app stack in one place
- Offers a 15 day trial period to test out the service in production
Cons
- Offers way too many options at once; it can be overwhelming for beginners
- Business metrics analysis are still not as effective as that of AppDynamics or DataDog
- Does not offer much on the serverless front
- Does not feature a public pricing model
New Relic
New Relic is a cloud monitoring solution that aims to easily help you manage advanced and ever-changing cloud infrastructure. It can let you know how your cloud infrastructure and apps are running in real-time. You can also gain valuable insights into your app stack, view them in rich dashboards, avail distributed tracing support, and more. The installation process might be a little complex compared to other tools, but there are steps outlined in their documentation.
Features
- Monitors all kinds of apps in one place, with support for viewing error rates, page loads, slow transactions, and more.
- Offers database performance monitoring too
- Provides a rich and powerful query language - NRQL
- Offers Real User Monitoring (RUM) and Synthetic Monitoring
- Supports distributed tracing for tracking requests from start to end
- You can set custom alerts and warnings for errors
- Integrates well with most well-known cloud providers such as AWS, Microsoft Azure, GCP, etc.
Pros
- Connects business-level metrics with performance to correlate them easily
- Offers granularity in metrics and information
- Provides error analytics tools for quick and efficient analysis of issues
- Implements measures to reduce alert noise
Cons
- Metrics can get a little confusing at the beginning
- The mobile app is not advanced enough for complex tasks
- Log management feels relatively young and immature
- Has an inconsistent UI
DataDog
DataDog is a SaaS-based monitoring solution that began as an infrastructure monitoring service but later expanded into application performance and other forms of monitoring. DataDog’s service can easily integrate with hundreds of cloud apps and software platforms. However, its configuration-based agent installation service is time-consuming to complete, and getting started with the tool requires some time and effort.
Features
- Provide cloud app performance monitoring with distributed tracing support
- Centralizes log storage and analysis
- Offers Real User Monitoring (RUM) and Synthetic Monitoring
- Offers network and host monitoring
- Offers more than 450 built-in integration to connect with your workflow system and tools seamlessly
- Uses a single unified agent to correlate all three pillars of observability: metrics, traces, and logs.
- Exposes an API to allow working with the data and dashboards
- Offers collaboration tools for team discussions
- Alerting is reinforced with machine learning
Pros
- Acts as a complete observability solution in one tool
- Offers detailed infrastructure monitoring that covers hosts, containers, networks, and more
- Provides rich logs integration with apps, containers, clients, and log shippers
- Provides robust log analysis and visualization features
Cons
- Does not have an extensive collection of pre-built, ready-to-use dashboards
- The interface and installation process can be a little too overwhelming for beginners.
SolarWinds
SolarWinds is another full-stack cloud performance monitoring platform that offers network monitoring and database monitoring solutions. It monitors the health and performance status of apps, servers, data storage, and virtual machines. SolarWinds provides an interactive visualization platform with which you can quickly receive insights from thousands of metrics collected from your infrastructure. The platform also includes troubleshooting and error remediation tools for real-time responses to detected issues.
Features
- Provides a complete view of your infrastructure and apps
- Offers distributed tracing, exception tracking, live code profiling, and root cause summary features
- Has infrastructure dependency mapping to visualize how your services fit together
- Offers Real User Monitoring (RUM) and Synthetic Monitoring
- Has the ability to aggregate logs and search through and analyze the stored data
- Supports multiple log sources
Pros
- Is easy to get started with
- Has powerful application performance monitoring capabilities
- Helps in reducing mean time to repair and also supports speed triaging
Cons
- SolarWinds offers multiple products, such as AppOptics, Pingdom, etc., that have overlapping functionality. These can be confusing to some people.
How to Scale Cloud-Native Monitoring Efforts
As your cloud-native setup starts to grow, you will need to scale your monitoring setup. And we are not talking about provisioning another virtual machine or physical server. We are talking about hundreds and thousands of containers provisioned and scraped based on user demands.
There are two possible approaches to scaling your cloud-native monitoring efforts. The first one is to opt for a federated monitoring infrastructure. In this case, a tree of monitoring servers deploys. The monitoring server at each branch collects monitoring results from its lower branches, and the lowermost servers are attached directly to each data center of the cloud-native infrastructure. This is how it looks:
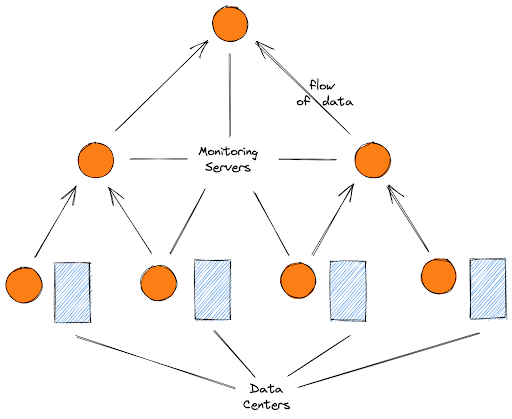
While such a structure achieves coverage, the breakdown of one of the monitoring servers can result in vast and irreparable loss of monitoring data. This is where High Availability (HA) distribution comes in. HA distribution suggests using two monitoring servers at each location instead of one to maintain a redundant copy of data. You can then use this to recreate the lost data.
Another solution to the cloud-native monitoring scaling problem is reorganizing your human resources. You should consider splitting your engineering workforce into explicit, dedicated teams such as frontend, backend, DevOps, etc. You can then provide these teams with their unique monitoring tools and techniques. If these teams have their roles defined clearly from the start, it becomes easy to find the right person who can help the situation in times of an outage.
Closing Thoughts
Cloud-native is on the rise in today’s world. More and more companies are adopting Kubernetes and Docker to speed up their development and improve the quality of services. In times like these, monitoring techniques and solutions need to keep up with the growing technologies.
This article showed you the significance of cloud-native monitoring and compared it with monitoring monolithic applications hosted on the cloud. We also mentioned an array of methods that you can use to monitor and analyze your cloud-native applications effectively. Then we provided a quick roundup of the popular tools used for cloud-native monitoring. Finally, we brought our discussion to a close by stating two methods to scale up your monitoring efforts quickly. We hope that this article may help you find the proper monitoring tool and technique for your next cloud-native application.
Scout can help you achieve the 99.99% availability mark when it comes to monitoring. Try the tool out today with a 14-day free trial (and by free, we mean no credit card, too!) and test it yourself!
For more in-depth content around web development and performance, navigate our blog and feel free to explore Scout APM with a free 14-day trial!


