The Case for Frontend Performance Monitoring
 Kumar Harsh
on
January 04, 2022
Kumar Harsh
on
January 04, 2022
Application Performance Monitoring has been a popular concept among developers and companies alike. APM data has helped product teams increase their growth and revenue manifold. Whether it is an issue affecting the availability of a service or a trend that suggests an incoming increase in user engagement, monitoring has always helped organizations get the best out of their product strategies.
However, APM or monitoring is quite a vague term. It covers many aspects and holds unique value to every company more often than not. In general terms, app monitoring has two monitoring segments — front-end and back-end. Frontend monitoring deals with the performance of the visible parts of your application. Backend monitoring is referred to as APM and deals with the performance of backend services and servers.
This article will focus on the benefits of implementing frontend performance monitoring in your apps, how to take the next step towards improvement, and what popular frontend performance monitoring tools you should consider to help you get started.
Feel free to use these links to navigate the guide:
- What is Frontend Application Performance Monitoring?
- What are the Business Advantages of Frontend Performance Monitoring?
- How Can I Improve My Frontend Performance?
- Tools for Frontend Performance Monitoring
- Improve Visibility Into Your Application’s Performance
What is Frontend Application Performance Monitoring?
Frontend application performance monitoring refers to the ecosystem of tools and measures adopted by developers to track and monitor the health of the presentation layer of applications. This layer comprises everything that a user would interact with, ranging from the app contents and menus to other client-facing components.
Application performance monitoring, or APM, focuses on observing users’ experience instead of simply tracking the internal communications between the server and the client. Frontend performance monitoring is a segment of APM that focuses only on the front end of the apps. The backend services and servers do not fall in the scope of this monitoring setup.
Why Implement Frontend Monitoring?
The next topic to address in our discussion is why you should opt for a frontend performance monitoring setup. Apps with interfaces exposed directly to end-users tend to be more complex than straightforward backend services. With this complexity comes an increased possibility of going wrong. Any downtime in a front-end app can lead to severe revenue losses, customer churn, and wasted engineering resources.
Front-end performance monitoring tools help prevent such losses by letting you know when an issue occurs in your app and how to fix it before it affects your users.
What are the Business Advantages of Frontend Performance Monitoring?
Now, let us shift our focus to understanding the impact of frontend performance monitoring on the business end of applications.
Enhanced App Speed
One of the most significant benefits of monitoring your frontend app’s performance is the chance and scope that you get to improve it. And the faster your app is, the easier it is for your users to find their way around it and gain value. Slow loading resources almost always cause bottlenecks and lead to bad user experiences.
To measure if your frontend app is performing up to the contemporary speed standards, you can run a performance audit from an online tool like LightHouse or PageSpeed. You can then compare the results against the ApDex performance index for web applications and check if your app makes the cut.
Your page speed is significantly affected by your resource sizes and the number of requests your app receives. To get the maximum performance possible from your web apps, you should continuously optimize your resource sizes and reduce your server’s response time to as low as possible.
Frontend monitoring helps by constantly providing numbers that determine your position in the optimization journey. Without monitoring and logging, all of your optimization efforts would be aimless. You would not even know if they worked since you would have no historical data to compare it with.
Faster Error Diagnosis & Smoother Usage
Apart from maintaining a high-performance standard, the next benchmark to master is your MTTR, or Mean Time To Resolution. While MTTR is a broad term and covers the resolution process in detail, it begins with diagnosis. Without a quick and correct diagnosis, it would not be possible to resolve issues efficiently. Hence, setting up a front-end performance monitoring system helps notify you quickly about any problems in your app.
Frontend performance monitoring tools can alert you whenever your app faces any kind of issue, including but not limited to JavaScript errors, network failures, framework-specific issues, etc. If you choose a tool that does log monitoring and management under the same hood, you will find it easier to identify and fix incoming issues.
Frontend performance monitoring tools also help you while resolving the issues. While some fundamental issues can be resolved quickly by developers, other more complicated ones can require extensive background details to figure out. Logs generated by performance monitoring tools help immensely in these cases.
However, you need to have a tool that stores, archives, and controls the quality of such logs. Without proper maintenance of your monitoring data, it is nearly impossible to draw valuable insights from it. Therefore, opting for a front-end performance monitoring tool that fits your purpose aptly is crucial to building a reliable user experience.
Increased App Availability
Availability is one of the critical factors in determining the quality of your services to your end-users. However, it can also be one of the most challenging aspects to take care of, mainly when your application and your customer base have grown quite large. Additionally, the more scattered your users are across the globe, the difficult it is to maintain high availability for all of them.
Having an insight into how your users experience your website throughout the world can help you optimize your services to a great extent. This is the perfect use case for frontend performance monitoring tools. These tools track the users’ journey throughout your application. Such tracking can easily detect a malfunctioning feature since the very first few users will help you know that something’s off. You can utilize such early detection to decrease your MTTR and restore normalcy faster.
With an early alarm system, you can also quickly implement measures to keep users out of the faulty section before most users experience the same issue while your team works to fix the issue. This ensures a seamless experience both for your users and your development team.
Productivity Gains
Using a frontend performance monitoring tool can help increase the productivity of your software team in many ways. First, you gain insights into what goes well with your users and what is not liked much. Using this data, you can shape your product’s roadmap and focus more on the features that are accepted well by the users. You can quickly roll out updates that help you grow your customer base and enhance their experience manifold.
With proper monitoring measures in place, you can evaluate your development strategy’s effectiveness with updates and other maintenance attempts. By measuring the user activity and update reception after each update, you get to know if the desired effects of the update have been achieved or not. If they are, well and good; if not, you will end up either making changes in your strategy or improving the way your team executes the set strategy. Either way, you will gain productivity that will ultimately convert to better business output.
Another aspect to take into consideration is finding the right cause for downtimes. Your cloud or other infrastructure vendor is responsible for app downtimes in many cases. Appropriate monitoring measures help to distinguish the cause of downtimes at the earliest so that you can make the right decisions while finding and fixing issues.
Analytics For Data-driven Decisions
One of the most significant benefits of recording your app’s front-end performance data is running analysis and drawing insights from it. You can easily use data from stack traces, console logs, errors, network activities, resource loads, app state changes, page speed metrics, etc., to visualize the experience delivered to your users. Then you can notice trends in the changes of these metrics to identify when and where your product is lacking to provide.
Running analytics on performance data, like page load time, helps you understand what impacts them. You can focus your development around these trends and insights to ensure that introducing new features or running maintenance activities does not affect the standard functionalities of your application.
Monitoring and drawing insights from your frontend applications give you beneficial information about how your users use the app. Apart from adapting features to user trends, you can check usage issues like rage-clicks and oblivious interfaces. These can be a major turnoff for your users if not checked properly. Even if any part of your app is not malfunctioning, it might be challenging to understand due to design issues. Monitoring helps you identify such cases to research why users are avioding certain sections of your app even though they are not down.
How Can I Improve My Frontend Performance?
After understanding the long array of benefits that frontend performance monitoring offers, most people often wonder how they can do it effectively? While the majority of frontend monitoring tools do the dirty work for you, here are some ways in which you can extract the most out of your user sessions.
Listen To Route Changes
Implementing smooth transitions between different sections of a web app is vital for creating a good user experience. Slow loading images can often frustrate users as they paint an incomplete picture of your web pages. Therefore measuring and optimizing page load times is very important to build a lasting connection with your users.
An excellent way to measure site transitions is by tracking a metric called Largest Contentful Paint (LCP). LCP estimates how long a page takes to load by waiting for the largest image, video, or SVG element to become completely visible on the screen.
While this works well for static and server-side rendered apps, it does not translate well for single-page apps. Single page apps modify the browser route and re-render the components instead of navigating to a new page altogether. This might not necessarily reload the largest element of the previous route on the new one. Therefore measuring the correct values of LCP requires a method to detect such changes in the page that does not depend on standard loading events.
In this case, instead of tracking page load events, it is more advisable to listen to route changes and use this event to track performance metrics. To do this, you will need to instrument your code and manually watch for various browser events rather than simply waiting for a full page load. APIs like User Timing have functions that enable developers to define their loading indicators and precisely measure page and resource loading times.
Here is a simple way to use it in your app. First, listen for the popstate event using the History API, fired when the browser route changes. Then, set a window.performance.mark() using the User Timing API to indicate that a route change has started.
window.onpopstate = function(e) {
  window.performance.mark('route_change_started');
}
Once the components of the new view have been rendered, you can pass the mark to the window.performance.measure() function. This function will then create a finish mark and calculate the difference between the two marks.
// once the component renders

window.performance.measure('route_change','route_change_started')
You can now easily log the loading time of your app’s route changes. For analyzing it over time, you can forward this data to a logging service like DataDog. While timing such route change events, it is also wise to track the loading times of individual resources to identify exactly where the slowdowns are occurring.
However, manually marking and tracking route changes can become cumbersome if you have to do it for every page transition. Another way to time such transitions is to create a loop that triggers right after a route change is detected. You can set a loop to trigger every 100 ms, for instance. It will check every 100 ms if a network request of DOM mutation has been completed after a route change trigger. If not, it will wait for another 100 ms. If yes, it will take the previous 100 ms mark as the loading time. Popular services like DataDog use similar methods to track page load times for single-page app route changes.
Monitor End-to-End Experience
Monitoring fundamental user interactions can reveal a lot of bottlenecks in your app’s performance. It is vital to collect as much granular data as possible to optimize the user experience. Tracking simple operations, like rendering a model popup, can give you insight into the users’ browser activities. This can include a series of API calls, updates in data state, and then the re-rendering of the components. A slight delay or holdup in any of these tasks can quickly cascade through and turn into a performance bottleneck. This is even more probable in smaller, less powerful devices like mobile browsers. If the said popup takes longer than usual to load, it can lead to the web app losing customers.
Like the instrumentation you saw for route changes, you can add relevant event listeners to important UI elements like buttons, keypresses, modal popups, etc., which trigger any form of state changes. This enables you to track load times for these critical user interactions effortlessly and point out those that take longer than usual to complete. You can take 100ms as a yardstick to determine if an action is taking too long—anything taking longer than 100ms to complete usually drives away the feeling of the app being natural and fluid.
Another little measure that you can implement to track the performance of your frontend app even better is to watch for Long Tasks. Long Tasks are defined as sections of JavaScript code that block the main UI thread for a minimum of 50ms. While some heavy rendering operations may cross the 50ms mark usually, it is not normal for most parts of your app to be taking more than 50ms for every operation.
You can catch the Long Tasks either in the code itself or in your browser profiler. Once you have an idea of when and where it occurs, you can quickly implement fixes for it in your code and reduce the workload from the main UI thread of your application.
Implement Error Tracking
Error tracking is another useful measure that you can implement in your modern SPA to track and analyze errors. Since SPAs run complex code directly on the users’ devices, you will not usually find out about the errors that occurred during the runtime unless you explicitly instrument your code to log them. If you choose not to, you will only learn about such errors when support tickets are created or, worse, when revenue goes down.
If you run an e-commerce website, and your user tries to check out, but the button in the app does not work, the users will get frustrated and might leave your app altogether. However, you won’t know if a button is causing errors upon being clicked. You would only notice a dip in the number of users making a purchase from your website, which, sadly, will not give you any contextual information on why it is happening. Implementing an active error monitoring solution with proper instrumentation can help you save your business in such cases.
You can easily do this using a GlobalEventHandler like window.onError() to catch and log all error events. While logging these events, you must collect information about the affected users’ browser, host operating system, app version, etc. This will come in handy when the development team debug and resolve this issue.
Additionally, you also need to be tracking valuable error data. Your error management tool needs to be intelligent enough to tell signals from noise. For instance, third-party dependencies, browser extensions, etc., might sometimes generate errors unrelated to your app’s general performance. It can become challenging to filter through all this data for valuable and actionable information. You should prefer a monitoring solution that supports intelligent grouping and can distinguish between general warnings and critical bugs.
You should also consider creating and maintaining an end-to-end testing workflow to test your apps in real-world scenarios. Such a workflow can help you detect browser errors and other issues before they affect a large portion of your user base. Synthetic monitoring is a popular measure employed for this exact purpose. It works by simulating API requests and app interactions to help test complex user journeys like adding items to an e-commerce cart or initiating a checkout.
When it comes to error monitoring, make sure to check out Scout’s latest offering in this domain—Scout Error Monitoring. The Scout Error Monitoring tool can seamlessly pair with the APM offering of the provider and help you create connections between performance trends and error occurrences of your application. You can easily view and classify your errors to find out the issues that need your quickest attention.
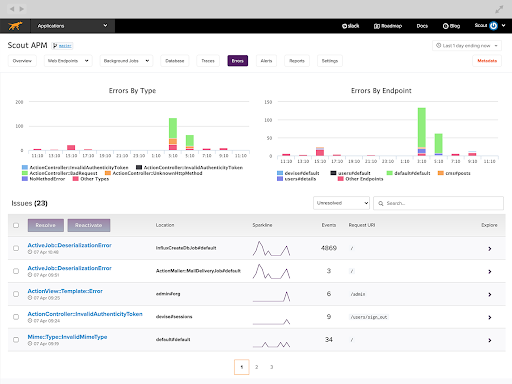
Scout Error Monitoring Interface
Tools for Frontend Performance Monitoring
Let’s take a quick look at some of the top frontend performance monitoring tools available in the market at the moment.
Sematext

Sematext is one of the few monitoring providers that offers a complete set of tools for monitoring your frontend and infrastructure. It also offers good documentation on setting up and using its tools. Here are some of the prominent services that it offers:
- Sematext Synthetics: This service helps to create synthetic monitors for your web resources. It then pings your resources from various locations in the world to check latency, speed, certificate errors, API availability, and more.
- Sematext Experience: This service implements real-user monitoring techniques to generate user experience and satisfaction reports. You also get critical insights on your app’s performance based on client location, devices, and network speeds.
- Sematext Logs: This service helps to store and analyze all logs generated by other Sematext services. It can help you drill deep into data and find insights like never before.
Sematext can help you track performance history, debug incoming errors, and monitor your complete infrastructure from one place. Its alerting game is quite strong too.
Pingdom

Pingdom is a monitoring service owned by SolarWinds, which provides a wide range of services including SSL monitoring, real-user monitoring, uptime monitoring, and more. It is especially popular for its uptime monitoring, PageSpeed offering, and alerting capabilities.
- Uptime Monitoring: This feature gives you insights into how long your pages or resources take to load completely. It also offers root cause analyses using its extensive reports.
- PageSpeed: This tool is the go-to whenever you need detailed performance information about your app, such as load time, requests count, Performance scores, page sizes, etc.
- Alerting: Pingdom does a great job at quickly notifying you whenever an anomaly is detected. You can customize these alerts by choosing when team members receive the alerts and who gets notified. Pingdom also offers the option to receive alerts via SMS and email.
RayGun
Raygun is an application performance monitoring tool that enables you to observe and fix your performance bottlenecks by discovering valuable and actionable data from your apps. You can easily identify sections of bad user experience and, in turn, boost frontend performance.
One of the best features of Raygun is that it allows you to walk through individual user sessions in real-time. You can use this ability to identify which page takes time to load and which ones don’t load at all. Raygun offers a very simple and easy-to-understand pricing model and a wide variety of integrations too.
However, Raygun does not offer a log management solution yet. You can still use its Error View to gain details about each error, like full stack trace, browser, operating system, environment, etc. You should consider pairing it with a log management solution to get the most out of it.
LogRocket
LogRocket is a real user monitoring tool that allows you to record user sessions and play them back to check issues faced by users from a first-person perspective. It provides a developer mode that enables you to break down and check every resource that a user loaded. You also get a console log that records everything the user saw at the time of the incident. This helps you see the issue directly without replicating it yourself.
LogRockets features a simple alerting system that notifies you and your team about incoming issues via Slack or email. You can customize this to fire alerts on certain types of errors or after the same error occurs a certain number of times. LogRocket offers integrations with Intercom and Zendesk for easy ticketing and escalation.
SpeedCurve

SpeedCurve is a front-end performance monitoring tool that can capture data from real user interactions. It can then benchmark this data against your competitors as well! This provides a unique way of staying ahead of the competition. Here are some of its other prominent offerings:
- Live User Monitoring: As SpeedCurve’s real user monitoring tool, LUX gives you all the standard RUM metrics like first input delay, Cumulative Layout Shift, Largest Contentful Paint, etc., in one place.
- Synthetic Monitoring: It compiles all of your metrics into a single view where you can quickly check out performance indicators to understand your web app’s intricacies in detail. You can then break this data down into other views to gain information on how the website loads in various browsers and devices, its responsiveness on those devices, etc.
- Thresholds and Alerting: You can set thresholds (called budgets) for all of your metrics and then receive alerts if and when you exceed them. These alerts are sent via email or a webhook integrated with Slack, Microsoft Teams, HipChat, etc.
SpeedCurve also houses a section where your performance metrics are displayed and graded with the help of Lighthouse. Apart from that, it provides recommendations on various actions you can take to improve your app’s overall performance.
Improve Visibility into Your Application’s Performance
If you are interested in learning the usage pattern of your users and adapting to their needs, improving visibility into your frontend applications is compulsory. Without a proper frontend monitoring solution setup, you will be missing out on the precious data that your users generate as they move through your app’s pages. While your competitors will be adjusting their product roadmaps to their customers’ engagement trends, you will be moving in the dark.
This article has presented a perfect case for adopting frontend performance monitoring if you haven’t already. You have before yourself crystal clear advantages that frontend application performance tools provide to your business, followed by a couple of tips to help you get the most out of your frontend performance monitoring strategy. Then you get a roundup of some of the best frontend performance monitoring tools in the market right now. We hope this guide serves as the ultimate resource for you to get started with frontend performance monitoring!
As long as developer experience and cost-efficiency are involved, Scout APM is the way to go for most application performance monitoring use-cases. The simplicity that it offers in terms of interfaces and dashboards is unmatched, keeping its pricing model in mind. You can try it out for a 14-day free trial (no credit card required).
For more in-depth content around web development and a reliable tool for optimizing your application’s performance, navigate our blog.


