The Real Benefits of HTTP Monitoring for Businesses

HTTP is one of the most popularly used protocols on the internet. Most user-facing applications expose HTTP APIs or apps of some form. The HTTP protocol is the basis for the World Wide Web or the tangible, visible part of the internet. However, you can also utilize this technology to test the performance and availability of your web apps.
HTTP monitoring is one of the most innovative ways of monitoring an HTTP-based web application. It allows you to keep an eye on your app from the user’s perspective. You can simulate user activity based on various conditions, which will help you understand if everything’s fine in your system. This guide will help you understand what HTTP monitoring is and how you can implement it to reinforce your application performance monitoring strategies.
Feel free to navigate the guide using these links:
- What is HTTP Monitoring?
- Why HTTP Monitoring is So Important
- HTTP Monitoring Tools
- Key HTTP Monitoring Metrics to Know
- Keep an Eye on Critical Endpoints with HTTP Monitoring
What is HTTP Monitoring?
HTTP monitoring is the practice of sending HTTP requests to your web applications and servers from a synthetic client and checking if the right response is received. Synthetic client refers to computer scripts or software applications that act as clients to test your target application’s performance.
In fact, HTTP monitoring is a part of a larger group of monitoring practices known as synthetic monitoring. Synthetic monitoring aims at simulating user actions through computer scripts to evaluate the performance of target applications. It also incorporates automating web browsers to test your application's user interface.
Types of HTTP Monitoring
Coming back to HTTP monitoring, there are multiple types of HTTP monitoring practices aimed at achieving varied results. Here are some of them:
Availability Monitoring
As the name suggests, this type of HTTP monitoring focuses on checking the availability of its target resources. It can test if the resource is accessed in a set time range or not. Apart from that, you can set up additional filters to check if the right size of the payload was returned, if the payload follows the pre-set format, if it contains all the necessary elements, etc.
Availability monitoring is one of the most commonly used types of HTTP monitoring. It is quite simple to set up as most of the metrics are tangible and easily measurable.
Content Monitoring
Content monitoring is another way of deploying HTTP monitoring on your website. It repeatedly accesses a resource and checks if a certain content element in its payload has changed or not. The focus here shifts from checking the infrastructure and app wellness to content integrity.
Performance Monitoring
Performance monitoring is one of the advanced types of HTTP monitoring. The aim here is to test out application user flows by simulating a user going through the process. This method is usually employed in the case of apps with long, complex user flows such as registration, authentication, placing orders, checking out, etc.
Security Monitoring
Security monitoring is one of the most useful types of HTTP monitoring. You can monitor various aspects of your web app’s security implementations using security monitoring. You can monitor the validity of the SSL certificate of your web app and the SSL connectivity to your app’s port using HTTP monitoring.
Why HTTP Monitoring is So Important
HTTP Monitoring is one of the latest and most innovative methods of checking what’s up with your web servers. Here are a couple of reasons why you should consider implementing HTTP monitoring for your web servers.
Helps to Simulate End-User Activity Easily
One of the most important ways HTTP monitoring is different from other monitoring methods is that it replicates end-user behavior. Most monitoring techniques rely on internal instrumentation to draw insights about each app component. By simulating a real user, HTTP monitoring can act as an effective testing mechanism for the complex workflows in your application.
You can deploy HTTP monitoring to regularly test if your users can easily and consistently access basic services such as registration, log-in, etc. Furthermore, you can set your HTTP monitors to be based at various locations scattered across the world to ensure that your application is served the same to everyone, irrespective of their geographical location.
Alerts You On Errors Before Your Customers Find Out
One of the biggest reasons to implement HTTP monitoring is to know about the errors occurring in your application much before your customers start experiencing them. With properly timed monitors, you can keep an eye on your app’s availability round the clock from all possible locations. There’s a high chance that any errors will be picked by your routine monitors before your users run into them.
You can set up alerts on custom thresholds and fine-tune them according to your app for the best results. These custom thresholds could be anything—slow responses, missing values in the payload, etc. This type of alerting will help screen out any false positives that might arise due to network or device anomalies and provide you with reliable, actionable data.
These alerts can be coupled with a lot of contextual data easily—data arising from the thresholds—which will give you a head start on your reconnaissance and remedial process.
Helps Predict Incoming Issues
As is the use of any other form of monitoring, HTTP monitoring enables you to predict major issues before they hit your system. Most of such issues usually have a tell — some particulate metrics would start to go haywire way before something goes wrong. If you can monitor and analyze the trends of these metrics at regular intervals, you can easily predict and stop major issues from happening.
Even if an issue is not breaking functionality but only resulting in poor performance, long-term trend analysis can help you identify and fix those as well. This is because, unlike other forms of monitoring, HTTP monitoring tests your systems from the point of view of an end-user. This exposes any performance issues that your users might face and helps you fix those before they reach your users.
Keeps an Eye on Your SSL Certificate Availability
SSL certificates are proof of authenticity for most web-based resources. The presence of an SSL certificate indicates that the connection between your server and the client is encrypted, thus, secure. It ensures that the communication occurring between your client and server is not leaked to any unauthorized personnel.
But SSL certificates come with a certain validity. And once this validity expires, the certificate becomes invalid, and your connection becomes insecure. Most browsers notify users when the SSL certificate of a website is not present or expired. This can result in you losing your users as they do not trust your website anymore. You can configure HTTP monitoring to check for the validity of your SSL certificates regularly.
As soon as the certificate expires, your monitor can pick it up before any user does and provide you with ample time to renew it before it can impact your business.
HTTP Monitoring Tools
Now that you understand the importance of HTTP monitoring, here is a quick list of popular HTTP monitoring tools to help you get started.
UpTrends
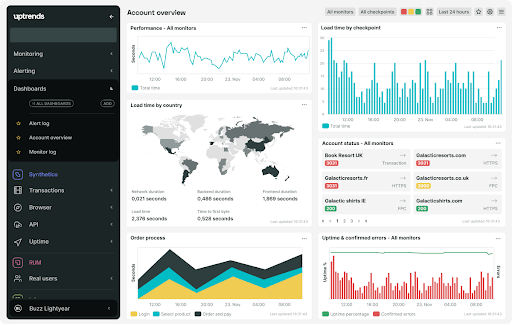
Uptrends is one of the most powerful HTTP monitoring solutions at the moment. This is because it monitors your app from over 150 different locations in the world! You can configure the tool to ping your website at intervals ranging from 1 to 60 minutes. Uptrends also offers other monitoring services such as real-user monitoring, SSL monitoring, web performance monitoring, etc.
Uptrends offers a limited free tier that provides users with just the right amount of features to get started with. To top it all off, the Uptrends interface is clean and easy to use.
Site24x7
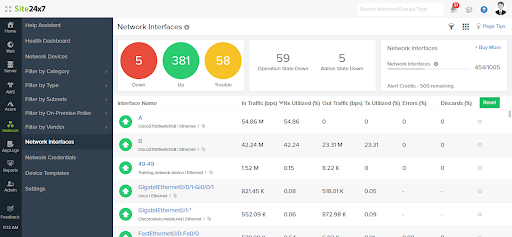
As another paid solution on the list, Site24x7 is a premier HTTP monitoring platform. It supports several protocols such as HTTP, HTTPS, REST, etc., and offers a wide range of third-party plugins to integrate with easily. One of the most striking features of this tool is that it notifies you every time your web app faces an issue such as network failure, server CPU usage cap, resource loading failure, etc.
Site24x7 offers a simple and easy setup experience and supports almost all types of server environments. It also offers a mobile application for easy access to its dashboards.
Dynatrace
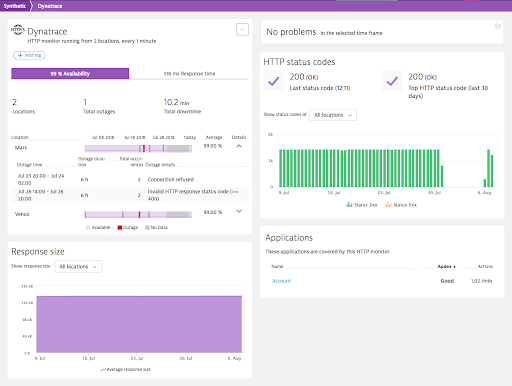
Dynatrace offers a freemium model of pricing to help organizations of all scales get started. Apart from generic external HTTP monitoring, Dynatrace can also monitor the performance of your internal resources, which makes it easy for you to understand your end-user's experience.
Dynatrace is one of the most affordable solutions on the list. The solution is designed to keep GDPR and other data privacy concerns in mind. It offers three kinds of synthetic monitors — single-URL browser monitors, browser click paths, and HTTP monitors.
DataDog Synthetics
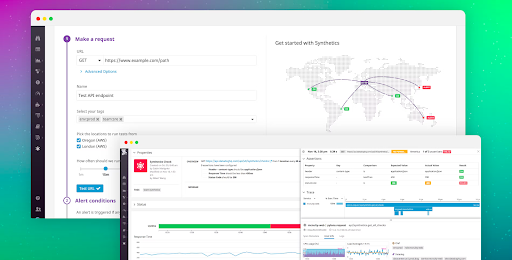
Another affordable solution with a freemium offering is DataDog Synthetics. Like every other HTTP monitoring tool, DataDog Synthetics helps you set up proactive monitors for your API endpoints and generate alerts based on predefined parameters. The added benefit with Datadog synthetics is that you can integrate its tests straight into your pipeline to detect problems early and eliminate them before your users get to see them.
You can use Datadog Synthetics to monitor critical transactions in your app without writing a single line of code. Tests written in Datadog Synthetics are AI-driven and self-maintaining.
Sematext Synthetics
Sematext is a premier log-management and monitoring platform. As part of its monitoring suite, Sematext offers Sematext Synthetics, a synthetic monitoring solution that helps you to create a complex set of monitors for all of your web-based resources with a few clicks. Monitors set up via Sematext Synthetics will ping your web resources from various locations around the globe and record metrics like uptime, error rates, SSL certificate validity, etc.
Sematext offers a very simple installation experience and a common platform for your monitoring and analysis needs. It offers ample documentation and supports all major frameworks. Each of its plans offers a 14-day free trial period so you can test it out before committing.
Key HTTP Monitoring Metrics to Know
To get the most out of the HTTP monitoring tool that you pick, you need to know what to look out for when setting up HTTP monitors. Here’s a collection of useful metrics to help you get started.
HTTP Response Codes
One of the most important and simple metrics that you can easily track is the HTTP response code returned with every request. Normally, you would expect the response code to be 200 or similar for successful requests. Anything other than 200 indicates an error and will only be helpful for troubleshooting, not monitoring.
However, you can set up monitors that simulate failing requests and match if the correct error code returns. It can help you test your authentication and security constructs from time to time.
Response Payload
There are a variety of checks you can implement on the payload returned by HTTP requests. A simple check for emptiness can indicate if anything is wrong with your server. Furthermore, you can monitor payload sizes to check if the right amount of content returns for the requests.
The format is another aspect that you can pay attention to. Malformed payloads often indicate an improperly-handled crash in your server. Moreover, you can set up log keywords such as error, warning, etc., in the payload that your server returns in such cases. This will help you identify the occurrences of such anomalies in the normal usage of your application, even if the server handles these issues internally.
To take things up a level, you can try searching for elements in the response payload that are always bound to be present. For instance, if your payload is the homepage of your app, you can count on the navigation bar always being present, or the footer always containing your company’s name, etc.
Response Times
Response time is an excellent indicator of how well your server manages things on the inside. Various types of requests have their own standard response times. The exact time taken each time for similar requests can vary due to network latency and other factors, but it will still stay in a short range.
For web pages, normal response times would lie between 1s and 2s, while APIs should return responses in 300-400 ms; again, it can vary based on your server’s workload. Typically, your monitor should raise an alert when the response times go out of the specified range.
There are multiple types of response times involved when handling HTTP requests.
DNS Lookup Time
DNS lookup time stands for the amount of time it takes for the host name of the server to resolve. While this is normally short, it can become noticeable in some cases. For instance, if a request redirects to another server, the host name of the new server will need to be resolved. Additional DNS lookup time would be added to your final response time for each redirect.
TCP Connect Time
TCP connect time stands for the amount of time taken for establishing a TCP connection between the server and the client. Once again, the TCP connect time multiplies in the case of a redirect since each redirect requires a new TCP connection to be established.
TLS Handshake Time
TLS handshake time is simple—the time taken for the TLS handshake to be completed. In the case of redirection, this time adds up as well.
Time to First Byte/Waiting Time
Time to first byte is a popular metric used to compare application performance. Time to first byte is the time taken by your server to return the first byte of the response. This metric is beneficial as it judges only the time taken by your server to handle the request and generate the response.
The complete response time can vary based on network speeds, payload size, etc., but measuring only the first byte will remove these factors from play.
Download Time
Download time is the amount of time it takes for the client to download the request payload. This can vary from zero (for responses contained in a single packet) to anything, based on the payload’s size. The download time can also be zero in cases where the network times out since no download actually happens. Waiting time and download time together make up the complete response time.
Keep an Eye on Critical Endpoints with HTTP Monitoring
HTTP monitoring is one of the high-level ways to track and analyze the performance of your end-user application. It keeps an eye on the performance of your application from the perspective of an end-user and notifies you in case any issues occur before they are discovered by your users.
With proper usage, HTTP monitoring can also help you predict issues before they occur and cause damage to your business. This guide helped you identify how HTTP monitoring can help your project and the important metrics you should look out for when setting up your HTTP monitors.
For more in-depth content around web development and a reliable tool for optimizing your application’s performance, navigate our blog and feel free to explore Scout APM with a free 14-day trial!

