How to Improve Flask Performance
 Mukul Khanna
on
April 26, 2022
Mukul Khanna
on
April 26, 2022

Flask is the most popular micro-framework for web programming in Python. Known for its lightweight build and flexibility, it is a fan favorite amongst beginners because of how easy it is to get started with, especially for building prototypes and small-scale projects.
Even though Flask is one of the faster frameworks out there, there’s almost always scope for improving performance in web applications. Things might run fine when you serve minimal, static websites with ample compute resources. However, as things scale – in terms of the number of users, the amount of data you are working with, or just the complexity of your application, the same web app can be a sluggish nightmare.
This post will look at some tips you can keep in mind to improve performance and get the most out of your Flask applications. Here’s an outline of what we’ll be covering so you can easily navigate or skip ahead in the guide –
- What is Flask?
- Ways to Improve Flask Performance
- Measure and Monitor Performance with APM Tools
- Profiling Flask applications
- Cache
- Don’t use Flask’s Dev Server in Production
- Stay in the Know with Scout APM
What is Flask?
Flask is a micro web framework for Python that came out in 2010. Here, the word ‘micro’ refers to how Flask comes equipped with a (relatively) minimal set of features most essential to getting an effective back-end up and running. This includes features like routing, templating, request/response handling, a development server, unit testing support, and a few more.
Flask is lightweight, fast, and scalable and is therefore used to power huge web apps such as Netflix, Reddit, Lyft, and many more.
Flask’s Web Framework Characteristics
Flask is primarily associated with the following keywords: simple, micro, minimal, lightweight, fast, and flexible.
The simplicity and minimality make it easy for beginners to jump on the Flask wagon. Even with zero-to-limited web development experience, people can easily import Flask into a software prototype or pet project and quickly get the job done.
Flask Provides Developers with Flexibility
Another key trait of Flask (perhaps the most useful) is its flexibility.
Flask’s philosophy is to do the best job at providing its users with the core web-dev features and is happy to let them work with external tools of their liking (or develop custom ones) for integrating additional functionality. In the same spirit, unlike several other web development frameworks (across different programming languages), Flask also doesn’t impose any constraints on the scaffolding of your project. This extensibility and flexibility make Flask an excellent choice for developers who want more control over the structure and composition of their applications.
If you are interested in learning more about Flask, take a look at our detailed tutorial on getting started with Flask for beginners. To learn more about how Flask contrasts against Django, Python’s other prevalent web framework, check out our Flask vs Django post.
Ways to Improve Flask Performance
Measure and Monitor Performance with APM Tools
There could be various factors pulling your application’s performance down – slow database queries, memory bloat, leaks, lack of sufficient compute (CPU, memory, storage), and whatnot.
The first step towards improving application performance is to figure out what’s slowing things down – to identify bottlenecks in your stack to make amends accordingly. This is where Application Performance Monitoring tools swoop in and make things effortless.
APM tools like Scout APM 24x7 monitor and track your application’s performance —
on the lookout for potential bottlenecks and other issues that can bring your application down before you know it. They quantify performance using metrics like request rates, response times, CPU and memory usage, throughput, error rates, ApDex scores, and much more. Moreover, they offer real-time insights and alerts about where things have gone wrong so you can pinpoint issues to the very line of code causing them and clean up. You can read more about ScoutAPM’s support for monitoring Flask applications here.
Profiling Flask Applications
Measuring and understanding current limitations in performance helps you prioritize what aspects of your infrastructure need the most attention — your code, the frameworks or libraries you are using, your database ORMs, your compute resources, or something else.
You can also manually profile your application’s performance using Flask’s in-built werkzeug profiler. To integrate this into your application, you can simply add the following couple of lines in your code:
from werkzeug.middleware.profiler import ProfilerMiddleware

app.wsgi_app = ProfilerMiddleware(app.wsgi_app, profile_dir="/path/to/profiles")
This profiles each request your application receives. Here’s what the profiler’s analysis of a minimal “hello world” returning end-point looks like.
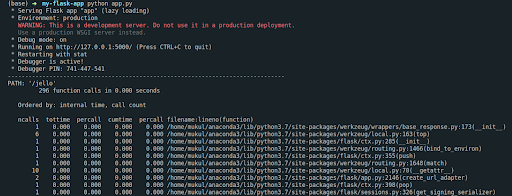
Because we are only profiling a bare-bones request here, there’s not much of interest in the logs above. However, suppose this end-point here made a bunch of external API calls, executed some database queries, and called some external library’s functions. In that case, we’d have much more interesting insights into how these processes are faring.
Additionally, the profiler also spits out .prof files that we save wherever into a directory of our choice. These files contain the statistics mentioned above, which we can then visualize using popular open-source libraries such as Snakeviz.
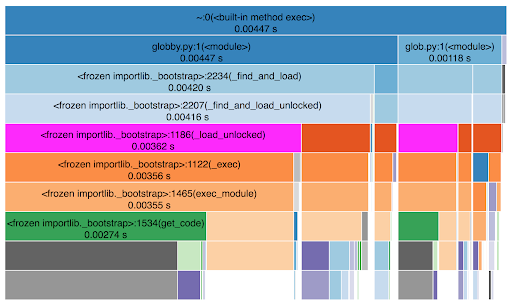
Source: https://jiffyclub.github.io/snakeviz/#interpreting-results
Snakeviz parses your .prof files and converts the dull logs we saw above into fancy visualizations (along with stats tables, filters, call stack information, and more) that can make inference and debugging a whole lot easier.
There are also several other external open source solutions for profiling your application, such as Flask Profiler and Flask-DebugToolbar. Even though the former is a little outdated at this point, the latter offers a fancy toolbar overlay on your application’s UI that can be plenty useful in inspecting requests and overall performance.
With useful insights from these profilers and the corresponding visualizations, you can nail down functions, requests, and queries taking the longest to execute and optimize your code accordingly. You can also consider alternative libraries, data structures, database services, cache your outputs (more on this below), etc.
Cache
Flask doesn’t ship with caching support (unlike Django). Caching is one of the most straightforward ways to reduce any web app's response rates and page load times.
What it does is precompute the output of an operation that usually takes a lot of time otherwise. Once this precomputed output is stored somewhere, the next user request doesn’t involve rerunning all the sub-processes of that operation but instead just serving the precomputed output (instead of rerunning the same piece of expensive code).
However, when you cache, you also want to think about the cache timeout period, i.e., how long do you want the server to respond with the (outdated) output. You don’t want to serve the cached response indefinitely.
The most popular caching extension for Flask (also recommended in its documentation) is Flask-Caching. Here’s an elementary example of how you can cache your view functions using the @cache decorator after initializing the Cache instance.
from flask import Flask

from flask_caching import Cache

config={'CACHE_TYPE': 'SimpleCache'}

app = Flask(__name__)

app.config.from_mapping(config)

cache = Cache(app)

@app.route('/')

@cache.cached(timeout=50)

def index():

   # cached for 50 seconds

   return 'Hello world!'
Don’t use Flask’s Dev Server in Production
In your Flask projects so far, I hope you haven’t been using Flask’s in-built development server for deployment in production.
Flask’s development (Werkzeug's WSGI) server is only a convenient tool for developers to build, run, and debug their projects quickly. It isn’t secure or scalable enough to deploy to production. You’ll see that Flask itself warns you against using their development server in production — in their documentation as in their server outputs (in red).
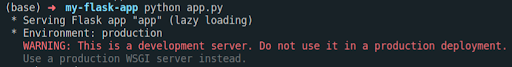
The more secure and performant alternative for deploying your Flask application is to use a standalone WSGI server (like Gunicorn or uWSGI) and a proxy Nginx server. You can read more about deployment options for Flask in their documentation here.
Stay in the Know with Scout APM
Now that you have a good sense of things you could look into for boosting your Flask application’s performance, go ahead and identify areas of improvement in your project.
As we discussed, the first step towards improving performance is identifying the current bottlenecks and pain points holding your application down.
Get a headstart in understanding how your application’s internal processes are faring with Scout APM. Scout automatically monitors the performance of your controller actions, records transaction traces, detects expensive database queries, detects memory bloat and leaks, and instruments many Python libraries out of the box. Get started with a 14-day free trial (no credit card needed!) or schedule a demo with our experts to learn more.


