Instrumenting Your Custom Application Code with OpenTelemetry
 Dave Anderson
on
May 06, 2022
Dave Anderson
on
May 06, 2022
OVERVIEW
Application Monitoring, or Application Tracing, is an important piece of Observability within your application and stack. Application tracing involves installing an API and/or SDK in your application which then instruments, or wraps your application code with other code that measures the time spent in certain areas of your code, and adds important contextual information to the traces. In this post, we’ll cover what different types of instrumentation are available, why it’s important to add your own instrumentation, how to enrich those traces with context, as well as which places in your code you should add custom instrumentation.
WHAT IS INSTRUMENTATION?
In software, instrumentation is code which measures other code. When you add an Application Performance Monitoring (APM) library, like the Scout APM agents, or an application tracing API/SDK from OpenTelemetry, these tools will provide APIs that will allow you to add instrumentation to your custom application code in order to measure its timing and add context to those measurements (called spans). The logical collection of the related spans from a single transaction (say, your application server handling a request from an end-user to load a web page from your servers) results in a trace.
TYPES OF INSTRUMENTATION
Vendor Provided (Out of the Box)
Vendor provided instrumentation is as it sounds. An APM provider like Scout writes instrumentation for commonly used libraries and includes that instrumentation in their Agent/SDK. When you install the Agent/SDK and then boot your application, the instrumentation is applied to the frameworks/libraries you use in your application, and spans are gathered from those libraries automatically. This instrumentation is dynamic and automatic, typically with no need for you to configure it. Common framework/library examples in Ruby are:
- Rails (ActionController, ActiveRecord, ActionView)
- HTTP (HTTPClient, NetHTTP)
- Redis
- MongoDB (Mongoid, Moped)
- ElasticSearch
- Background job frameworks (Sidekiq, Rescue)
- And more…
OpenTelemetry provides this type of out of the box instrumentation in the Instrumentation Contrib repo.
Custom Instrumentation
Out of the box instrumentation is great, but that only covers a portion of what your application might be doing. Custom instrumentation is instrumentation you add to your own code, using the API provided by OpenTelemetry. This allows you to gather spans within your own application code paths.
Native Instrumentation
Vendor supplied instrumentation is hard and delicate work - making sure the instruments are doing what they are supposed to, supporting all of the different versions of a library without conflict, and not adding overhead to your application. One of the goals of OpenTelemetry is to provide library authors an API to allow them to add the instrumentation directly into their library code. See the What is OpenTelemetry and Why is Scout All In? for how the OpenTelemetry API is intended for use by library developers.
Other
The above methods for instrumentation are the main approaches, but not all. For example, Scout’s Ruby agent has a feature called AutoInstruments (naming fail, I know) which applies Instrumentation to custom code methods in ActionController files when your code is loaded. It works by parsing your application code into an Abstract Syntax Tree (AST) and programmatically identifies which lines of code should be automatically instrumented. You can read more about AutoInstruments in our post, Introducing AutoInstruments: zero-effort performance monitoring of custom Ruby code.
WHY IS IT IMPORTANT TO INSTRUMENT YOUR OWN CODE
If you read the “Introducing AutoInstruments” blog post from above, you’ve already read why this is important:
… we've found that the time spent in custom code during a typical web request is second only to database calls:
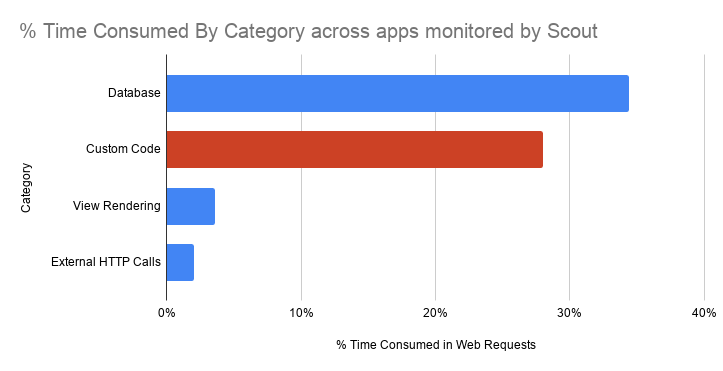
In spite of all of the out of the box instrumentation supplied by an APM vendor or OpenTelemetry, there’s still a massive blind spot in measuring your application without you, as the developer of your application, adding instrumentation within your own application code. Adding custom instrumentation from an APM vendor means using an API that’s specific to that vendor, which in turn means if you switch vendors you need to re-do the instrumentation you’ve added. Some vendors hope that friction to change locks you into their service. OpenTelemetry is vendor agnostic, so you can instrument your code with OpenTelemetry API hooks and send the telemetry data to any number of providers or back-ends, switching as often as you like, without having to re-do your application instrumentation. We like that.
INSTRUMENTING CODE IN RUBY
Before we get started, you’ll need to make sure you have OpenTelemetry installed and configured, as outlined in our Configuring OpenTelemetry in Ruby blog post.
It’s super simple to add your own instrumentation with OpenTelemetry. To measure code within a method, just wrap it with in_span from OpenTelemetry.tracer_provider:
def process_data(data)
  tracer = OpenTelemetry.tracer_provider.tracer('my-tracer')
  tracer.in_span("process_data") do |span|
    # your application code
  end
end
ADDING CONTEXT
Context is information attached to telemetry data describing the telemetry data. Context is crucial for Observability. Context is what allows you to correlate traces, metrics, and logs, and uncover previously unknown patterns, correlations, and causations across services and your stack.
OpenTelemetry has a standard for naming conventions used in setting context on spans and traces: Semantic Conventions. Get familiar with the conventions and make sure you’re adding context and attributes that take advantage of this standardization - check out the Semantic Conventions Gem for Ruby.
You can add context attributes to spans like this:
# you can set attributes when you call in_span
tracer.in_span('process_data', attributes: {  "account_id" => data.account.id, data_length => data.length, "tags" => [ "foo", "bar"] }) do |span|

  # you can also modify them within the span
  span.set_attribute("tags", ["other"])

  # and add new attributes within the span
  span.add_attributes({ "data_type" => "some value" })
end
WHERE TO ADD INSTRUMENTATION
Instrumentation is not zero cost, so you should add it strategically. It’s best to put instrumentation around higher-level methods that are called a handful of times per transaction. Don’t add instrumentation within tight loops or where it would get called thousands of times per transaction.
WRAPPING UP
We’ve covered what instrumentation does, what types there are, why it’s important to add it to your own application code, and why it’s important to attach context to the instrumentation. If you’re interested in learning more about Observability and what we’re working on at Scout, sign up for our Observability newsletter at scoutapm.com/observability.


