Monitorama 2019 - Portland, Oregon
 Erik Jacobsen
on
June 05, 2019
Erik Jacobsen
on
June 05, 2019
Monitorama, the What
A few members of the Scout team had the chance to head to Monitorama in Portland, Oregon this week. For those who do not know what Monitorama is, it is a 3-day, open-source monitoring conference with a single track. There is plenty of time during the breaks to chat with attendees, ask the speakers questions or just catch up on some email.
Many well-known names in the industry that provide services for network, cloud, on-prem, infrastructure and architecture, and application performance monitoring were present. From Scout’s perspective, it is a great conference to attend as it gives a breadth of knowledge and a chance to connect with other passionate people in the monitoring industry and hear some fresh takes on what is happening in the space.
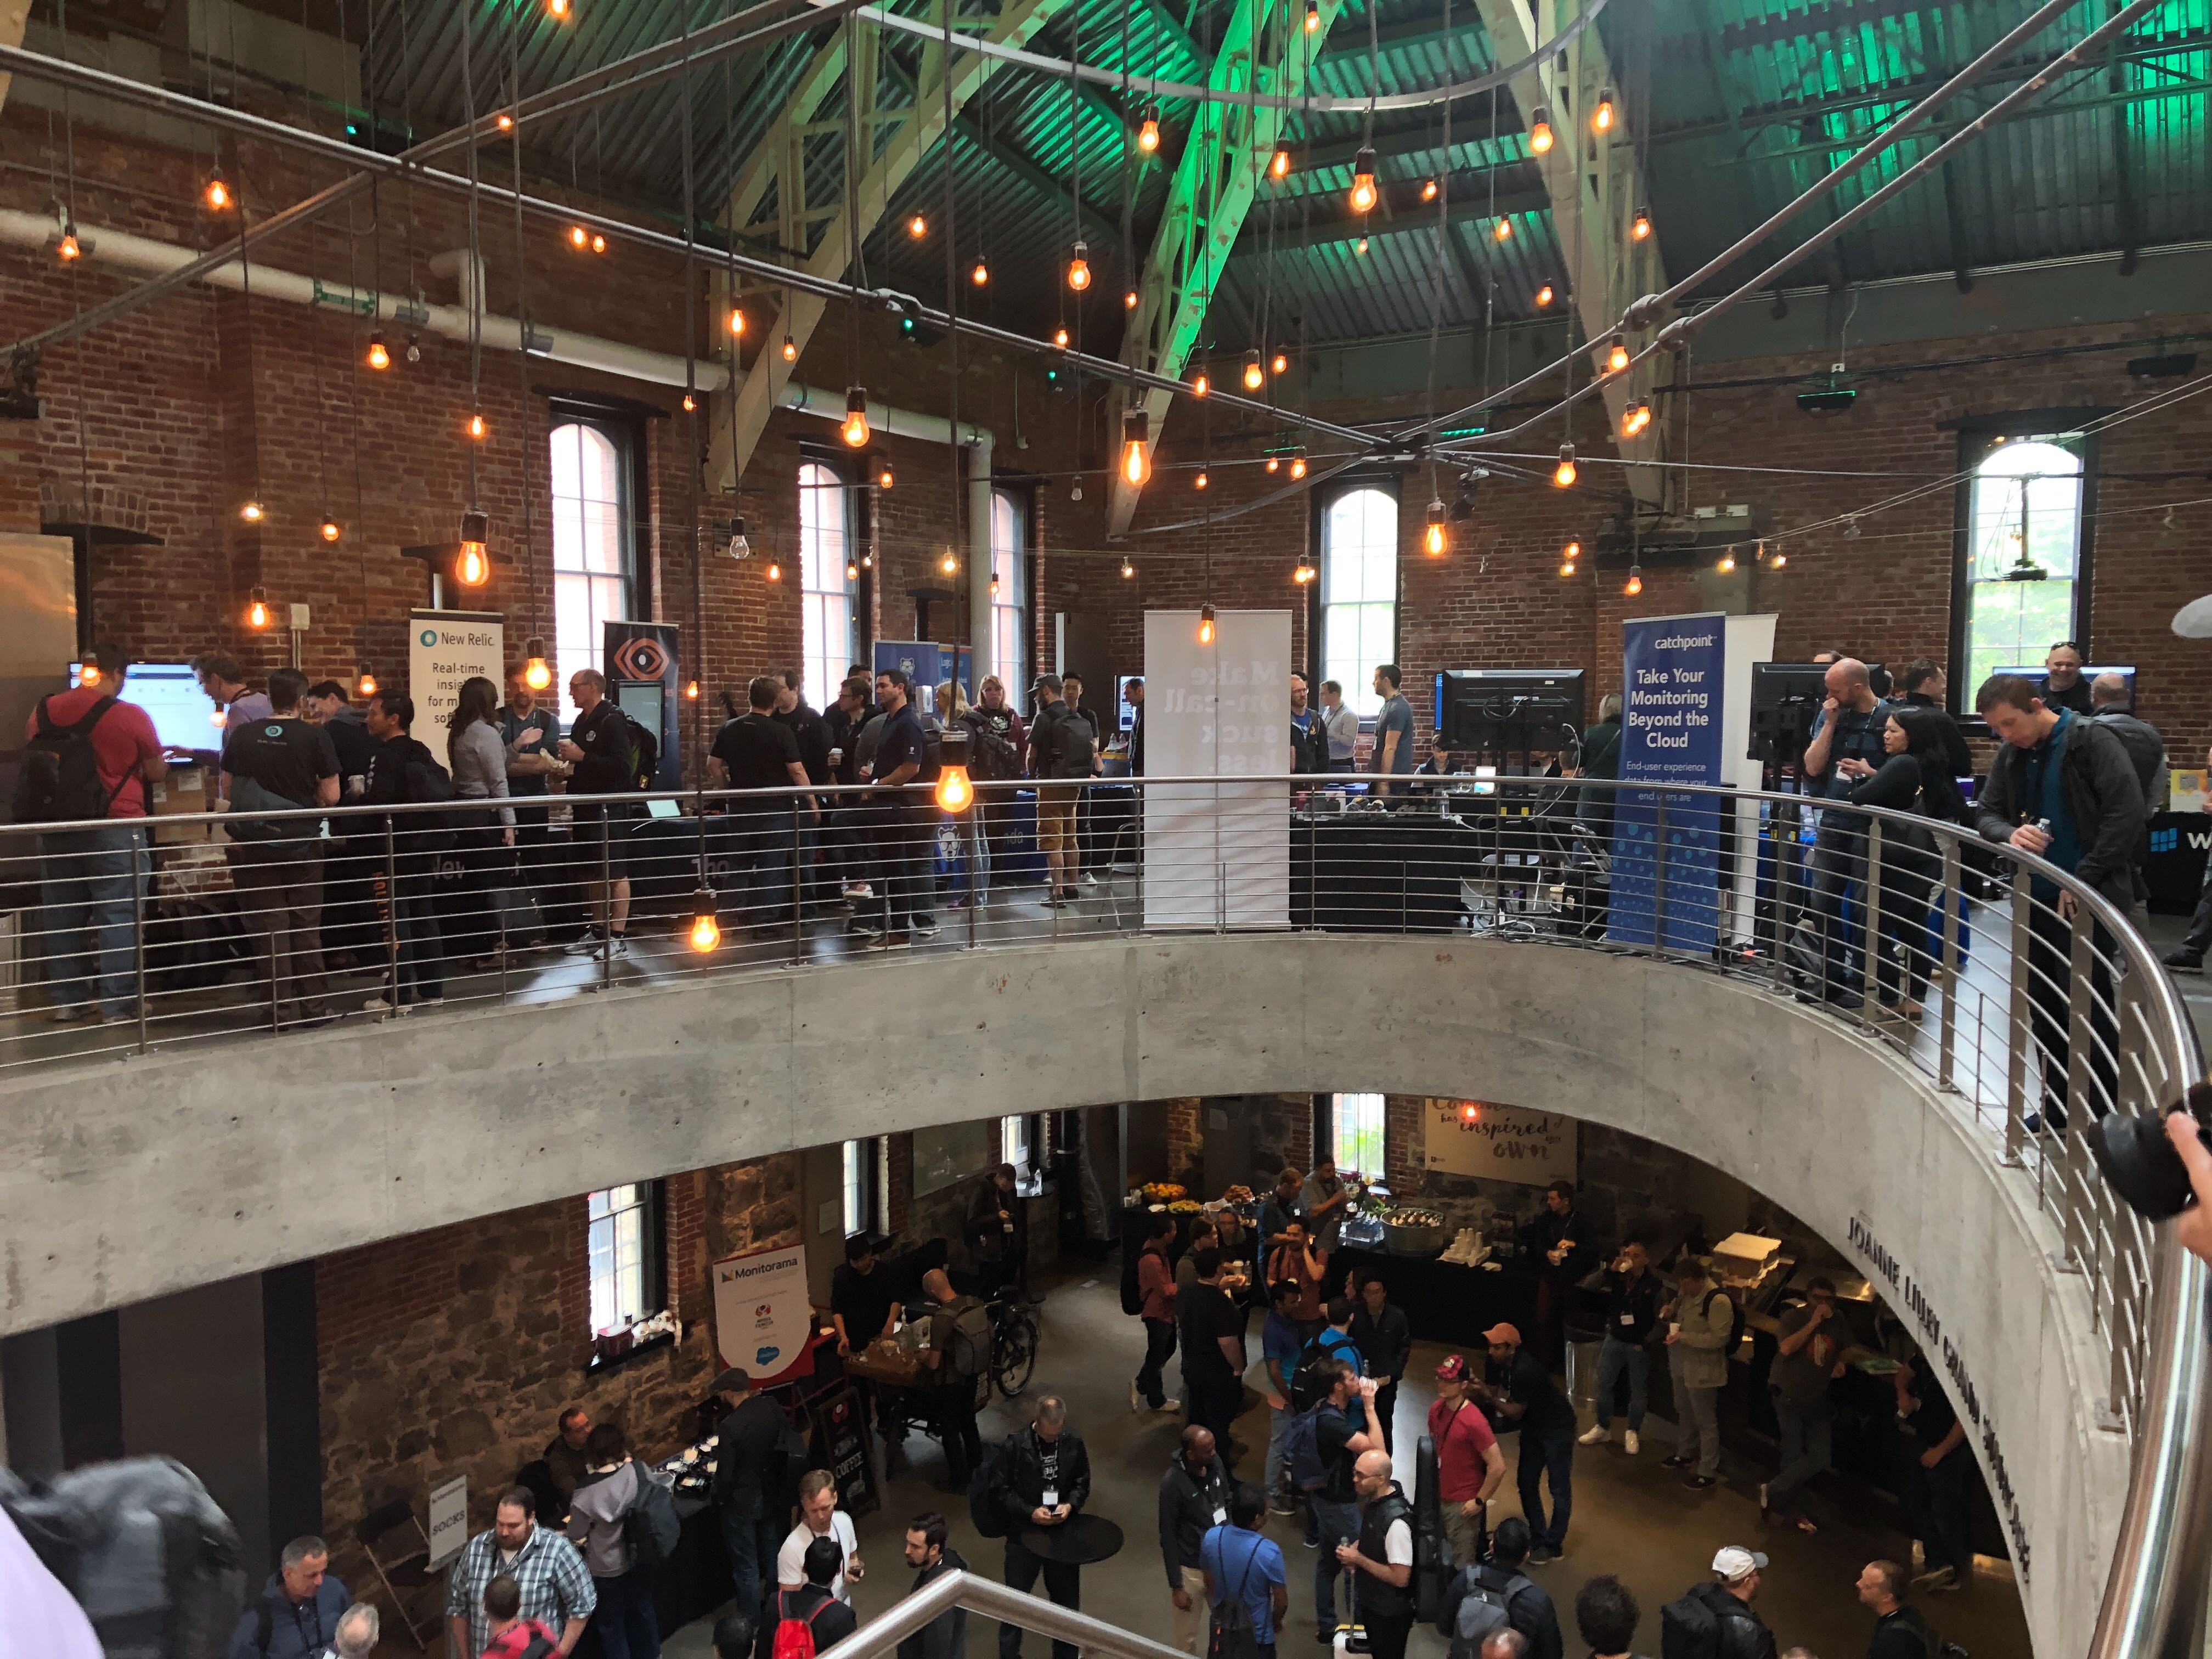
The Conference and Why You Should Go
As I said above, this is a friendly, fun conference to come to, especially if monitoring (of any kind) and logs are your jam. All of the speakers we heard give a talk at the conference seemed to have the same goal: Make getting your monitoring data to you as efficiently and quickly as possible. There is not a “Perfect Tool” that solves all problems all the time. Secondly, people seem to be conscious of not creating new standards for standard's sake. Our friends at xkcd captured this brilliantly below:
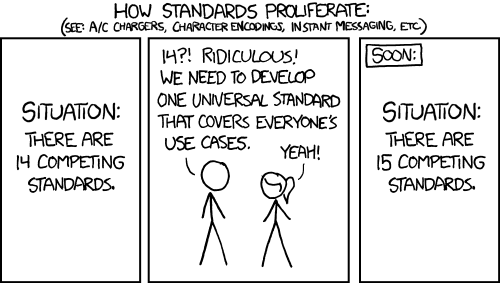
More than anything the various vendors, developers, and engineers we ran into are all creating solutions to provide interesting and intriguing solutions to address these issues. This is where Scout APM fits in as well. We love technology and even more, we love technology that works and allows developers to work with their DevOps team(s) to improve their own products.
Some Cool Stuff We Saw And Heard About
While there were a lot of great talks (especially some of the more animated lightning talks) there were a few topics I would like to share here. We had the chance to learn more about the OpenTelemetry project and what is happening with OpenTracing and OpenCensus and some neat new projects from Grafana Labs and Netflix. I have included the links to the GitHub repos below if you are interested.
Probnik is a simple but powerful measurement framework, allowing you to compare various alternatives for your network configuration. It is easy to integrate into your application code, performs tests in the background, sending a summary for analysis upon completion.
Loki is a horizontally-scalable, highly-available, multi-tenant log aggregation system inspired by Prometheus. It is designed to be very cost effective and easy to operate. It does not index the contents of the logs, but rather a set of labels for each log stream.
OpenTelemetry is made up of an integrated set of APIs and libraries as well as a collection mechanism via an agent and collector. These components are used to generate, collect, and describe telemetry about distributed systems. This data includes basic context propagation, distributed traces, metrics, and other signals in the future. OpenTelemetry is designed to make it easy to get critical telemetry data out of your services and into your backend(s) of choice. For each supported language it offers a single set of APIs, libraries, and data specifications, and developers can take advantage of whichever components they see fit.
Best Vendor Name / Mascot

Gremlin provides you with the framework to safely, securely, and simply simulate real outages with an ever-growing library of attacks. Using Chaos Engineering to improve system resilience, Gremlin’s “Failure as a Service” makes it easy to find weaknesses in your system before they cause problems for your customers. They are like an advanced Chaos Monkey on speed. The demo I saw was very intuitive with a clean UI.
As someone who breaks code on a regular basis, I am looking forward to playing with this a bit when I get back to the office as they offer a free plan to let you check it out. For the first time in my career, I do not have to be afraid of breaking stuff and asking for forgiveness. They also had arguably the best swag in the game. Any mascot based on a fictional character you cannot feed after midnight is alright in my book. My grandson loves his little stuffed Gremlin and our team has a solid piece of software to check out and possibly add to our CI/CD regimen.
Portland As A Whole Is Just a Cool Place to Be

If you have not been to Portland you should go. Seriously, put it on a list somewhere and check it out. There are tons of great boutique hotels as well as some of the normal chains. The coffee is great (as someone who has a huge caffeine addiction, the coffee is fantastic), the breweries are fun and aplenty and it’s easy to get around for a medium-sized city. You can walk around a lot of the downtown area, but there are also a lot of different transportation options if you don't want to Flintstone it. The last, and maybe the best reason to come check out Portland is that Portlandia was created because of this city and all of its idiosyncrasies. The bottom line is that Portland is a cool, quirky place to hang out in with something for everyone.
See You Next Time?
Were you able to go to Monitorama in Portland? If so give us a shout and let us know what you got out of the conference. Bummed you missed it? Check out the new East Coast show in October in Baltimore. The venue (Pearlstone Theater at Baltimore Center Stage) should be another good one. It will be intimate and should present opportunities for connections and some great talks. If you are going, let us know as we would love to catch up.