When it comes to getting to the root of a performance problem, nothing beats the lightning-fast speed and precision of Application Performance Management (APM). But choosing between New Relic and Scout can be like navigating a labyrinth of options and considerations.
With New Relic, you'll get a top-of-the-line tool that's perfect for some situations, while Scout's streamlined approach fits like a glove in others. But in the murky middle, where the choice isn't quite so clear, you'll need to channel your inner Sherlock Holmes to uncover the clues that will guide you to the right decision.
So where do you fall in this epic battle of the monitoring tools? Are you a master sleuth who can deduce the perfect fit for your needs, or will you need to call in the big guns (and some coffee) to make your decision? Either way, one thing is certain: with APM on your side, you'll always be one step ahead of any performance problem.
Below, I'll summarize the factors to consider when choosing your best APM product.
Pricing
Scout's monthly fee is about 30% lower than the monthly fee in a New Relic annual contract. In some cases, Scout will also buy your New Relic contract.
Language Support
Scout supports Ruby, Elixir, PHP, Node.js and Python with a Core Agent API that can be used to instrument any language. New Relic supports Ruby, Java, Node.js, PHP, .NET, Python, and Go.
Let's start digging through the products, starting with the app overview.
App Overview
This is the first page you see when checking the health of your app. Scout's version is on top and New Relic is below:
SCOUT APM OVERVIEW


The top portion of the page is similar between New Relic and Scout: a breakdown of time spent by category (ex: Ruby, Database, External HTTP services, etc) over time. You can view data across similar timeframes in both Scout and New Relic (New Relic offers three months of data in their Pro package and Scout can do the same in their custom plans).
Both let you compare data to the past. Scout gives a few more options than New Relic, which is restricted to yesterday and last week comparisons.
The biggest difference with Scout's approach: several algorithms dig through your data and generate insights on performance directly on this page. For example, Scout identifies slow database queries, N+1 database queries, and memory bloat. These are ordered by impact, which help you decide where to get most improvements in the least amount of time.
Scout short-circuits the work a Site Reliability Engineer (SRE) often performs when investigating the health of an app.
We're about to go beyond the surface-level features and explore the essence of application monitoring.
Transaction Traces
The soul of app monitoring is the transaction trace: all the metrics and analysis an APM platform delivers originate from data collected in a trace. A transaction trace is a breakdown of time spent in a single web request or execution of a single background job.
A New Relic trace is on the left and Scout is on the right:

There are some differences here as well:
- Scout provides a breakdown of memory allocations in addition to timing metrics. New Relic does not.
- New Relic offers cross-application tracing if your app touches another app you've monitored with New Relic. Scout does not.
- Scout is more likely to provide backtraces to slow method calls and can also display the code directly in the browser.
- Scout indicates the number of rows returned by SQL queries
- Scout can breakdown the time spent in custom code via ScoutProf. New Relic requires custom instrumentation.
Scout typically collects more traces than New Relic. Both New Relic and Scout have similar, one-week retention periods for traces.
Web Endpoints
Both New Relic and Scout let you view summary data on web endpoints in list format. Scout's version is on top and New Relic is below:
SCOUT WEB ENDPOINT INSIGHTS


New Relic opts for several different visualizations on this page. Scout goes with a filterable, sortable view.
Both sort web endpoints by percent time consumed by default, helping you focus on the controller actions that consume the greatest amount of time.
Web Endpoint Detail
In the same way the app overview provides a breakdown of time spent, both New Relic and Scout offer endpoint-specific views for this:
SCOUT WEB ENDPOINT DETAIL

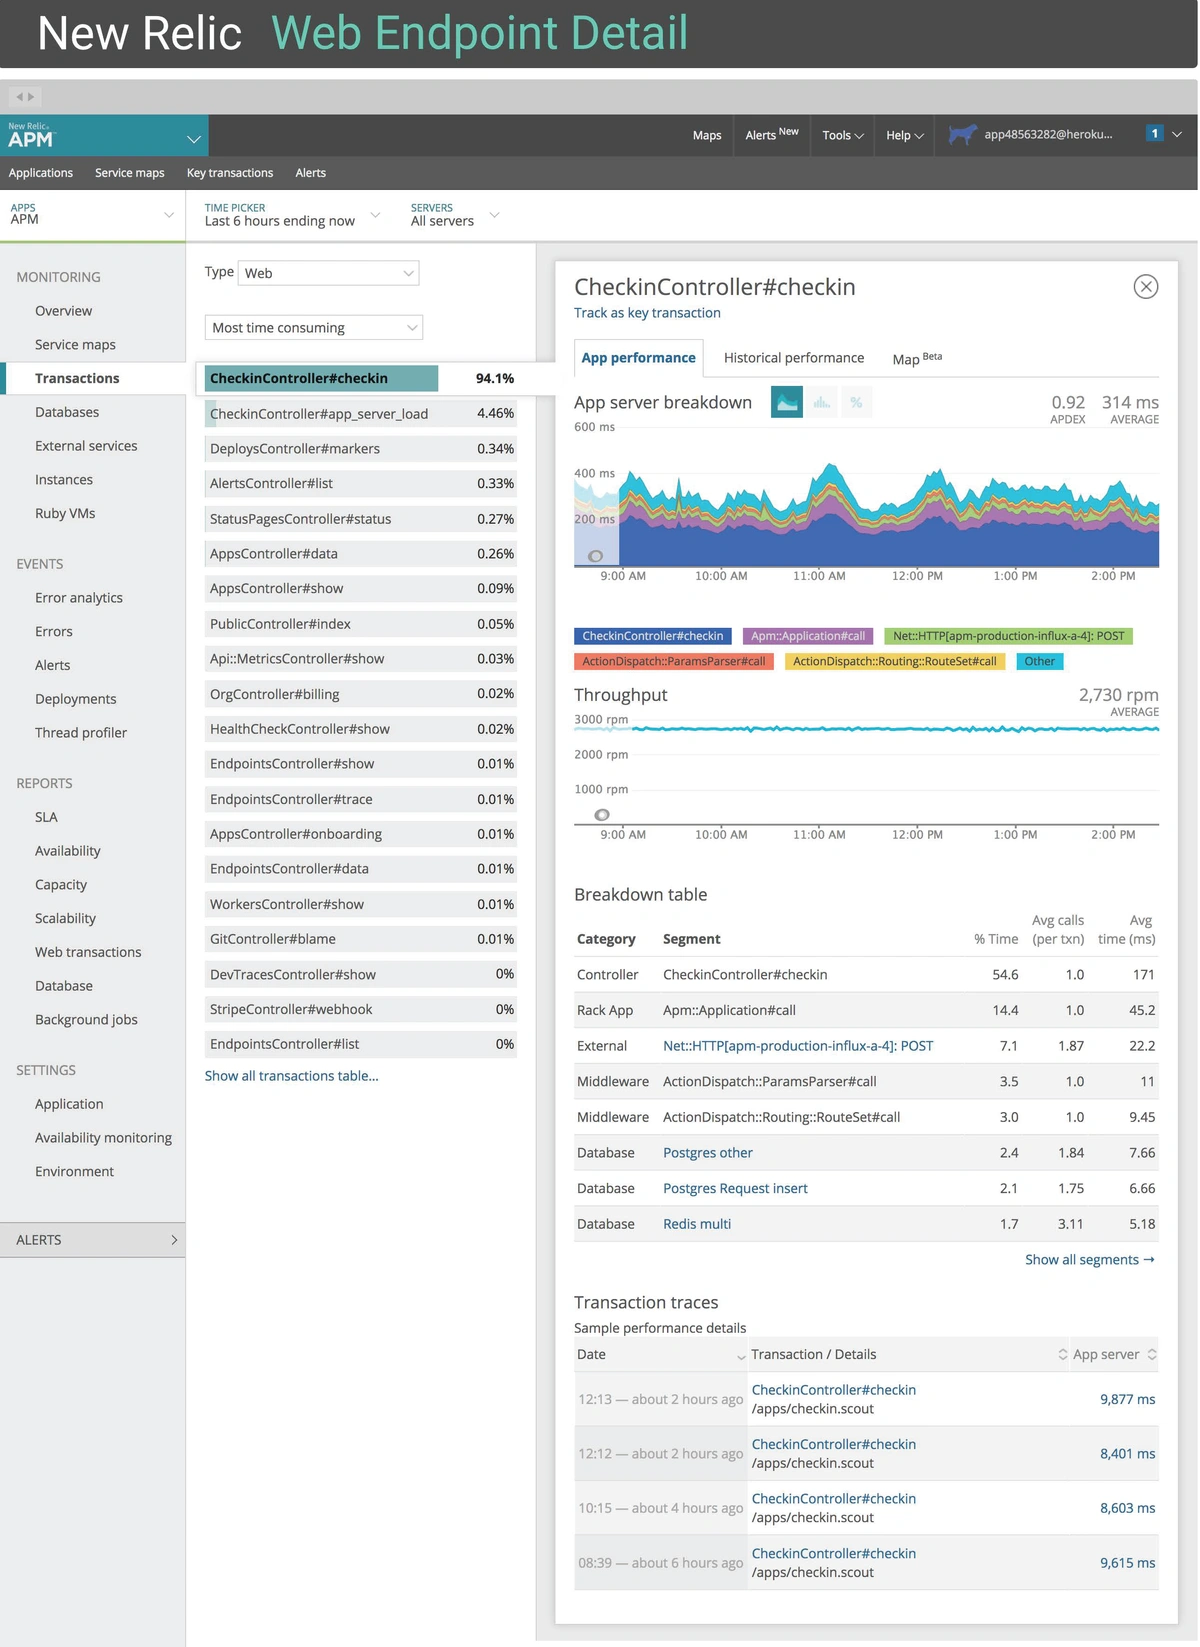
There are some differences on this page:
- New Relic offers a histogram display option of response times and Scout does not.
- Scout offers memory allocation metrics (more allocations lead to increased memory usage) while New Relic does not.
- New Relic's breakdown provides more categories, while Scout focuses the breakdown on database queries.
- Scout typically provides more transaction traces (up to 10 per-minute) and more options for sorting and selecting traces.
Background Jobs
Both New Relic and Scout monitor the core Ruby background job frameworks: Sidekiq, Delayed Job, and Resque. The UI is similar to endpoints, so I haven't provided a screenshot here.
Database Monitoring
The database is the most common bottleneck for web applications. Since a database is a shared resource, one expensive query may cause many other types of queries to run slower. New Relic and Scout provide additional analytics around database query performance:
SCOUT DATABASE MONITORING


Both of the UIs resemble each tool's web endpoints display, but made specific for database queries. There are some subtle yet important differences between the two:
- Scout's chart displays data across every query - not just the top five most expensive queries - by combining less expensive queries into an "other queries" metric. This gives a more complete picture of performance.
- New Relic provides monitoring beyond ActiveRecord. Scout focuses on ActiveRecord.
- Scout's list of queries includes the calling controller-action or background job. Expensive queriers are frequently triggered by a few hotspots in the code: this makes it easier to identify those spots at a glance.
Finally, Scout makes it easy to compare performance in a small slice of time to the normal performance. This isn't possible with New Relic - you can change the entire timezone, but you can't compare between a small slice of time and a larger one. Here's how this looks within Scout:

Weekly Trends Email
A regular report on your application's health is an effective way for managers to stay informed about its performance and detect any underlying issues that may be slowly building up. While New Relic prioritizes high-level numbers, Scout takes a deeper dive into the root of problems and trends:

Alerting
When it comes to alerting functionality, Scout and New Relic are neck and neck. Both platforms offer comparable capabilities that enable you to receive timely alerts for performance issues, so you can take quick action and keep your application running smoothly.
Agent
Both the New Relic and Scout agents are battle-tested. In Scout's open-sourced benchmarks, Scout's agent was shown to have lower overhead:
APMAGENTRESPONSE TIME
(MEAN)
RESPONSE TIME
(95TH PERCENTILE)
RESPONSE TIME
(MAX)
OVERHEADNone55.6 ms106.4 ms2,174.1 msNew Relic80.4 ms149.5 ms2,263.5 ms44.5%
Scout56.8 ms102.7 ms2,168.7 ms2.2%
The impact of agent overhead increases as CPU resources on your app servers becomes more scarce.
Error Analytics
Scout tracks error rates and integrates with third-party services like Rollbar to provide details on exceptions. New Relic can provide this data, including backtraces to exceptions.
Why don't you just tell me which to use?
New Relic and Scout require little configuration - outside adding a dependency - to try. You can run Scout and New Relic at the same time without causing conflicts.
My suggestion? Try Scout alongside New Relic, then ask: "which tool helps our team solve performance issues faster?"
Join our developer community on Slack to get expert guidance on application monitoring best practices. Our team is always happy to help. Come say hello!