How to Find, Fix, and Prevent Node.js Memory Leaks
 Ganesh Mani
on
December 14, 2021
Ganesh Mani
on
December 14, 2021

When your application starts to grow, one of the essential factors to consider while scaling is memory management. Poor memory management leads to memory leaks, thus affecting application performance. When the performance degrades, it will directly affect the business. So, it is essential to look out for and fix memory leaks in time.
This blog post will look at what memory leaks are and how to avoid them in Node.js applications. Feel free to navigate the post using these links:
- What are Memory Leaks?
- Why Do Memory Leaks Happen in Node.js?
- What About Garbage Collection?
- The Real Business Cost of Memory Leaks
- How to Detect Memory Leaks?
- How to Fix the Memory Leak Once it’s Located
- Can We Avoid Memory Leaks to Begin With?
- Closing Thoughts
What are Memory Leaks?
Before getting into the details of memory leaks, it is worthwhile to understand what memory lifecycle is. Regardless of the programming languages, the memory lifecycle is always the same:
- Allocation of memory for the defined variable
- Manipulation operations such as read, write on the allocated memory
- After usage, releasing the allocated memory
A memory leak is a condition that occurs when a program doesn't release the memory it allocates, i.e., step 3 of the lifecycle is not carried out. For instance, the system assigns memory locations to store values for the variables that we declare inside our program. In programming languages such as C/C++, we can allocate additional memory to hold the data and variables required. But, it's our responsibility to deallocate the memory after usage.
High-level programming languages such as JavaScript utilize automatic memory management, known as garbage collection. Garbage collection allocates the memory to a variable once we declare it and reclaims the memory once it is no longer needed. Unfortunately, even though JavaScript uses a garbage collector to release the memory, sometimes determining whether to free the memory or not is undecidable.
So, in certain conditions, the Garbage collector misses reclaiming the allocated memory, leading to a memory leak in Node.js (Javascript ecosystem). Now let us look into why it happens and how we can avoid them.
Why Do Memory Leaks Happen in Node.js?
To understand what causes a memory leak in JavaScript applications, we need to learn about scopes, variables, and closures in JavaScript. Let’s take a quick look at these to understand why memory leaks happen in Node.js.
Accidental Global Variables
Scopes in JavaScript determine the visibility of a variable, function, or object during runtime. Javascript has two types of scope: local and global.
Variables that we declare inside a function or a block have local scope. Hence, they are known as local scope variables. We can access those variables only inside that function or block.
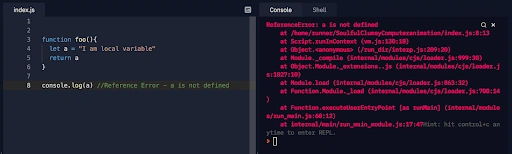
Local Scope Variables
There are also global scope variables in the JavaScript root document (window object). This means that all functions of the document can access the variable defined in the window/root document in JavaScript.
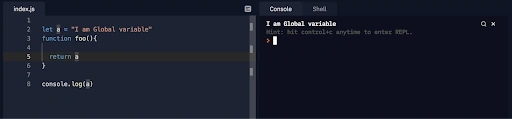
Global Scope Variables
Now, if we use a variable inside a function without declaring it, it will create an automatic or accidental global variable.
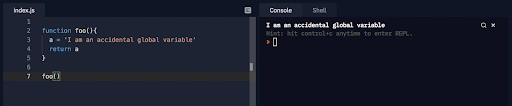
Accidental Global Variables
Since the root node has reference to the global variables in JavaScript (i.e., global this or window), they are never garbage collected throughout the entire lifecycle of the application. So, they will not release the memory as long as the application is running.
Closures
In JavaScript, we can define a function inside another function. Inner functions can access the variables inside the outer functions. The process of accessing the parent function's variables inside an inner function is called closure.
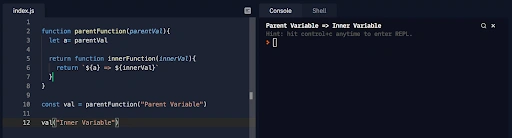
Let's walk through each step in the above example and understand the potential sources of memory leaks. First, we call the parent function that creates a local variable "a" and returns to the inner function with a pointer.
Inner function holds a reference to the parent function scope variable. Because of that, the garbage collector will not reclaim the memory for the variable even though the parent function completes the execution. Thus, it causes a memory leak in Nodejs applications.
Timers
Timer functions are higher-order functions that are meant to delay or repeat the execution of other functions. There are two timer functions in Nodejs runtime. They are:
- setTimeout
- setInterval
setTimeout basically executes the function after some delay. Thus, we can configure the delay time, whereas setInterval executes the function repeatedly with a time interval.
Here, we can see that the ‘runTimer’ function has setTimeout timer with an object reference. So, every time it executes the callback, it gets re-initialized. Because of that, the garbage collector doesn't reclaim the object’s memory even though we remove the object reference. So, it can potentially lead to a memory leak in the application.
Event Listeners
Javascript uses event listeners to handle events in DOM elements. For example, we can add an event handler to the “onClick '' event of a component. However, if a DOM event and its corresponding event listener do not match the event lifecycle, it may lead to a memory leak.
Upstream Code
Sometimes, a memory leak can also be due to upstream or remote code that our application depends on for execution. There may be a code/package as our application’s dependency with memory leakage, affecting the application performance. Therefore, if you cannot determine the exact cause of the memory leak in your application’s code, checking the performance of its dependencies is a shot worth taking.
What about Garbage Collection?
In high-level languages like JavaScript, automatic memory management, known as garbage collection, is used. The utility relies on the concept of reference.
The Garbage Collector (GC) traces the object reference from the root and marks all the nodes that are reachable from the root. If there are non-reachable objects by the root object, it considers them garbage and reclaims their memory. GC mainly uses two algorithms. They are:
- Reference Counting
- Mark and Sweep
Reference Counting Algorithm
Reference Counting is a native garbage collection algorithm. It first checks if an object has any references to it. If there are none, those objects are marked garbage collectible and collected in the next cycle.
Mark and Sweep Algorithm
The Mark and Sweep Algorithm is different from the Reference Counting algorithm. This algorithm checks if an object is reachable from the root node in the memory. If not, the GC releases the memory for the object.
This algorithm is more efficient than the previous one because an object with zero references from the root node will be unreachable. But, you can have objects that are circularly referenced and still unreachable from the root node. The Reference Counting algorithm will find references in those objects and leave them be, even though it would not use them due to lack of reference to the root. The Mark and Sweep algorithm will identify that they are unreachable from the root and dispose of them.
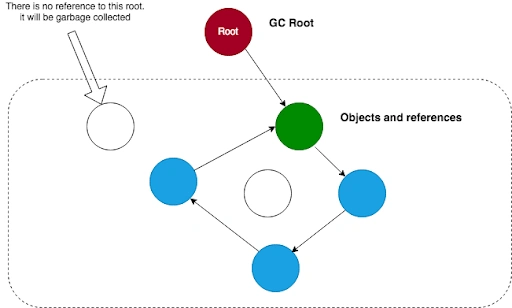
Objects as memory nodes
While the improvement brought by the Mark and Sweep algorithm improves memory management, it does not prevent leaks entirely. There can be objects that are reachable by the root but not in use anymore. There is no way for the algorithm to mark those as garbage collectible.
Another downside of GC is that it consumes additional resources to process the automatic memory management and decide which memory space to free. Therefore it can slow down the application because of its resource requirements.
The Real Business Cost of Memory Leaks
To understand the business cost of memory leaks, let me share my experience from my previous organization. The company that I worked for was building a SaaS product, and it had thousands of customers on the platform. In addition, there was a development team working on building the initial version of the product.
By accident or following lousy practice, they shipped some code with a memory leak in the application. After some time, The application started acting strange. For example, the application crashed randomly for some users. Whenever there was more than average traffic in the application, it started crashing.
Eventually, customers started complaining because of the bad user experience, and the churn rate became high.
Adding to the complexity of the situation, identifying the memory leak became difficult for us. It used to vanish after we restarted the server. But we knew that the crash was happening because there were not enough resources such as memory or CPU for the application. So to fix that temporarily, we threw more RAM into it.
It affected our business negatively. It cost us more money as well as posed a terrible experience for our customers. So, a memory leak as such holds the potential to affect a business quite direly. This issue has wreaked havoc in environments as large as Amazon Web Services.
How to Detect Memory Leaks
You can detect memory leaks using many methods. Also, it is important to diagnose a memory leak in the codebase before you can fix it. To do that, you have several language-specific libraries, tools, and APMs to your aid. You can use these to track the application metrics such as memory and CPU usage and identify the fault.
Use Tools to Your Advantage
In this section, we will discuss a set of tools that you can use to identify memory leaks in Node.js.
Scout APM
Scout APM is a monitoring tool that can trace resource usage and memory bloat. Getting started with Scout is as simple as installing a package.
const scout = require("@scout_apm/scout-apm");
scout.install({
allowShutdown: true, // allow shutting down spawned scout-agent processes from this program
monitor: true, // enable monitoring
name: "", // Name comes here
key: "" // Key comes here
  });
After that, it is time to add a simple route in express.js with a memory leak.
const requests = new Map();
app.get("/", (req, res) => {

    requests.set(req.id, req);
    res.status(200).send("Hello World");
});
On load testing with 200 requests per second, we can see that resources become occupied, resulting in crashing the application.
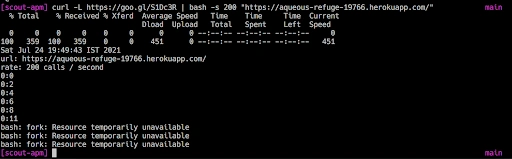
You can monitor that memory bloat in Scout with a simple and elegant user interface.
node-heapdump
Heapdump package dumps v8 heap for later inspection. It takes a memory snapshot using heapdump and helps to profile it for performance bottleneck and memory leak.
To begin, add the heapdump dependency in your project.
npm install heapdump --saveNow, add it to your root project.
var heapdump = require("heapdump");It captures the memory snapshot as a dump. Then, it stores it as a file, or you can use the console to see the results.
heapdump.writeSnapshot(function(err, filename){
    console.log("Sample dump written to", filename);
});
Node Inspector is a debugger interface for Node.js applications that uses the Blink Developer Tools. It is a powerful javascript debugger interface. It helps to navigate source files, set breakpoints, inspect scopes, variable and object properties, and CPU & heap profiling.H4: node-inspector
To get started with it, install node-inspector globally.
npm install -g node-inspectorNow, you can debug using this command.
node-debug app.jsProcess Memory Profiling
Nodejs runtime process provides a simple way of monitoring memory usage in the application. This is how you can log its details.
console.log(process.memoryUsage());
The method returns the data with the metrics. However, it’s not recommended in production since it opens as a page to show the data. These are the metrics that you get in the output.
{
  rss: 4935680
  heapTotal:1826816
  heapUsed:650472
  External: 49879
}- rss: refers to resident set size. It calculates the total amount of space occupied in the main memory. It includes heap, stack, and code segments.
- heapTotal: refers to the total memory available in a heap.
- heapUsed: refers to the total memory occupied in a heap.
- external: refers to memory consumed by Buffers in Nodejs. It refers to an object, string, and closures references.
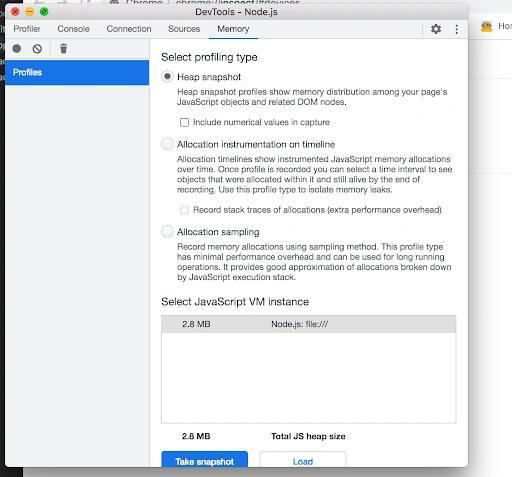
Chrome DevTools
Chrome DevTools provides a simpler way to debug memory leaks in Node.js applications. It captures the heap snapshot and records memory allocation using the sampling method.
Allocation sampling has minimal performance overhead, and you can use it to analyze long-running operations.
Use the following command to inspect the application.
node --inspectYou can then open DevTools for Node in chrome using.
chrome://inspect/#devices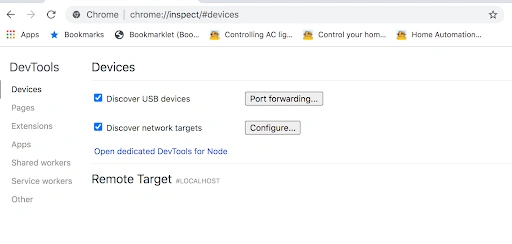
Finally, click on Open dedicated DevTools for Node to start debugging your code.
How to Fix the Memory Leak Once it’s Located
Now that we understand the reason behind the memory leak, we can fix it in our code. While doing so, you will realize fixing the memory leak is somewhat easier than diagnosing it.
Fixing Accidental Global variables
As discussed above, assigning a value to a variable without declaring it creates an accidental global variable. Javascript hoists it as a global variable that has value and is not in a local scope.
// This will be hoisted as a global variable
function foo() {
bar = "This is global";
}
To avoid that, you can use strict mode in javascript. Using the keyword 'use strict' will help prevent errors such as assigning value without declaring it. If you use a transpiler like a Typescript or Babel, you don't need to specify it as it is the default choice in the transpiler.
In the latest version of Nodejs, you can enable strict mode globally by passing --use-strict flag when running the commands.
Another situation where accidental global variables can occur is while using arrow functions. Here, a strict mode will not solve the problem. When defining 'this' in an arrow function, it refers to the global 'this' since there is no contextual scope for an arrow function. So, it is best to avoid 'this' inside an arrow function.
Use Global variables Effectively.
First and foremost, try to avoid using global variables as much as possible. It is good to use fewer global variables and use functions and local scope to share data and dynamic variables.
Using local variables helps the garbage collector to diagnose the references and reclaim the memory after usage. But, if you define them as global variables, they stay in the memory for the entire application lifetime. So, it is hard for the garbage collector to release the memory even though you are not technically using it. So, it is better to avoid global variables as much as possible.
Also, you can use global variables with 'const' instead of 'var.’ 'const' helps avoid accidental overwriting. Also, 'const' is block-scoped, whereas 'var' is the global scope.
Avoid storing big data types or objects in the global scope. If there is a situation where you need to store big objects in the global scope, make sure to nullify them after usage so that it can help avoid memory leaks.
Use Closures Effectively
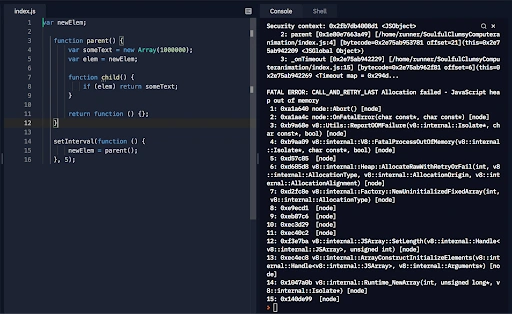
Closures can cause memory leaks in the application. Let us see how with an example.
var newElem;

function parent() {
    var someText = new Array(1000000);
    var elem = newElem;


    function child() {
        if (elem) return someText;
    }

    return function () {};
}

setInterval(function () {
    newElem = parent();
}, 5);
Here, we have a function 'parent', which has two functions: ‘child' and another unnamed function. We assign the global variable to the local scope 'elem’ and the parent function returns an empty function here.
Even though the returning function does not use any local scope variable, it references 'elem' here since it shares the same context as the 'child' function. This is because a Lexical environment is common for child functions. So, it causes a memory leak in the application.
We can fix it by nullifying the local variable that has to reference its global variables. In that way, we can avoid unused references inside the closure environment.
Efficient usage of Stack & Heap Memory
It is better to use stack variables whenever possible. Stack has a fixed amount of memory that avoids the dynamic memory allocation. Thus, it ensures that you do not accidentally cause a memory leak. It's also better to avoid accessing the objects, arrays, and other heap memory variables from stack variables. Try to reduce referencing heap variables from stack.
When using timers and closures, always make sure you pass the reference only if there is any use inside closures or timer events. If it's a large object or array, try to destructure and pass only the required fields.
Avoid mutation as much as possible. Immutability is better to avoid unnecessary reference that leads to a memory leak in the application. Use ‘Object.assign’ to copy the object to prevent mutations. We strongly recommend using local scope instead of global.
Can We Avoid Memory Leaks to Begin With?
We can follow the best practices and guidelines to avoid memory leaks in the first place. But, it is difficult to avoid it entirely at the beginning itself. In addition, there are chances that some codebase may have a potential memory leak once the application starts to grow. So, it is an aspect that we need to monitor and analyze constantly.
This is where tools like Scout APM come into the picture. Instead of monitoring and benchmarking the codebase manually, Scout can do that for us and save a lot of time. Here's an exciting story of how the meteor team diagnosed a memory leak and fixed it. This example shows that memory leaks can be weird and often random; therefore, it is best to have ample observability of your application’s performance all the time.
Closing Thoughts
A memory leak is one of the most common performance bottlenecks in modern applications. A potential memory leak can badly affect the application and business. So, it is essential to address such issues adequately to control the damage to your business.
However, the hardest part of the process is not fixing the memory leaks but diagnosing them. This is where performance monitoring tools come in handy. APM tools help detect the memory bloat early, which helps avoid potential memory leaks.
For more in-depth content around web development and a reliable tool for optimizing your application’s performance, navigate our blog and feel free to explore ScoutAPM with a free 14-day trial!


