StackProf: The Holy Grail of Ruby on Rails Performance Profiling

The holy grail of performance profiling is finding a tool that's safe to run in production. A tool that identifies slow code as it works "in the wild".
Profiling code locally is never as good as production profiling: the load is small, hardware specs are different, and I'd need to pull down a huge chunk of data to simulate things.
Enter StackProf, the production safe*, holy grail of Ruby profiling tools.
Setup
First, and most importantly, StackProf requires Ruby 2.1+. My sample application is using 2.2, so with that requirement met, it's a simple matter of adding StackProf to my gem file.
gem 'stackprof', '~> 0.2.7'
After running bundle install and I'm halfway there.
I'll use the middleware implementation for a Rails application and add this to myconfig/application.rb file:
class Application < Rails::Application
  ...
  config.middleware.use(StackProf::Middleware, enabled:true, mode: :wall, interval: 1000, save_every: 5)
end
Next, I'll restart my server. As I click around in a local version of my app, I see that StackProf has started populating data as .dump files in the tmp directory.
StackProf in Action
To validate StackProf, I'm going to add some latency to my application. Outside services (e.g. DBs, External API Calls) are frequent bottlenecks, so I'll use pg_sleep to simulate a slow DB request.
def slow
  ActiveRecord::Base.connection.execute "select pg_sleep(2)"
end
After running, stackprof tmp/stackprof-wall-*.dump, I get this:
==================================
  Mode: wall(200)
  Samples: 20248 (0.35% miss rate)
  GC: 18 (0.09%)
==================================
     TOTAL    (pct)     SAMPLES    (pct)     FRAME
     19996  (98.8%)       19996  (98.8%)     block in ActiveRecord::ConnectionAdapters::PostgreSQL::DatabaseStatements#execute
        15   (0.1%)          15   (0.1%)     block in ActiveRecord::ConnectionAdapters::PostgreSQLAdapter#exec_no_cache
        10   (0.0%)          10   (0.0%)     block in ActiveRecord::ConnectionAdapters::PostgreSQL::DatabaseStatements#query
        90   (0.4%)           7   (0.0%)     block in ActiveSupport::Dependencies#load_file
    ......
    ......
    ......
Boom! Almost all of the samples are from PostgreSQL::DatabaseStatements#execute. The application is spending all of it's time processing the slow PostgreSQL call.
Interpreting results
For each sample, StackProf is going to collect N stack frames and metadata about each frame:
- Samples
- Total Samples
At the top of the output, you'll see the mode used, and the number of samples collected.
Below the header, method calls are represented with the respective number of samples seen.
It's important to note, in the output above - samples do not represent timing information. They simply refer to the number of times a method was on top of the stack. Using this relative weighting, my slow method was at the top of the stack 98.8% of the time.
Wall Time Vs. CPU Time?
Let's start by talking about the parameters I used to configure StackProf.
As a refresher, I added this line:
config.middleware.use(StackProf::Middleware, enabled:true, mode: :wall, interval: 1000, save_every: 5)
First up: Mode. :wall is going to refer to wall clock, with the interval defining how long to measure. In my sample configuration, I setup StackProf to measure every second (1000 ms).
The save_every parameter refers to how many samples are taken before writing to disk.
To illustrate what a dramatic effect the mode can have, I'll change the mode from :wall to :cpu. Here's what I get:
==================================
  Mode: cpu(1000)
  Samples: 660 (0.30% miss rate)
  GC: 29 (4.39%)
==================================
     TOTAL    (pct)     SAMPLES    (pct)     FRAME
       263  (39.8%)         263  (39.8%)     Sprockets::PathUtils#stat
       182  (27.6%)         178  (27.0%)     Sprockets::PathUtils#entries
        55   (8.3%)          45   (6.8%)     Sprockets::Cache::FileStore#safe_open
        10   (1.5%)          10   (1.5%)     Sprockets::PathUtils#path_extnames
        10   (1.5%)          10   (1.5%)     URI::RFC3986_Parser#split
        17   (2.6%)           9   (1.4%)     ActionView::PathResolver#find_template_paths
    ......
    ......
    ......
         3   (0.5%)           3   (0.5%)     block in ActiveRecord::ConnectionAdapters::PostgreSQL::DatabaseStatements#execute
With CPU measuring, my slow DB query moved way down the list. In thinking about it, this makes sense. The CPU is simply waiting for a result to come back - it's not processing anything.
Is CPU time helpful for Rails apps? No.
CPU time doesn't paint the whole performance picture: the main choke points in web applications are frequently external services. As this example shows, by using the :wall measurement and looking at where the application is spending time vs. what the CPU is doing - I've got a clear picture of my application's bottleneck - the database.
In terms of speed and overall load, the interval and save_every parameters are the ones to tweak. I've found that an interval of 2000 and save setting of 5 have struck the right balance - but YMMV.
How can I peer thru the StackProf noise?
In the output above, Stackprof points to DatabaseStatements#execute as the culprit for my slow code. While technically correct, the framework isn't slow - it's my slow query that's bad. I'd rather have the sample count "bubble up" to point to the line in my controller that's running the slow query.
There's a couple of things I can do to find the line-of-code I wrote causing the slowness.
From the command line, I can run:
stackprof tmp/stackprof-wall-*.dump --method "<name of slow method>"
StackProf will report the callers and callees for the method.
I can do that over & over to dive deeper and deeper - but there's actually a better way. With a bit of ruby code, we can actually look at the source .dump files:
data = Marshal.load(File.new("tmp/stackprof-wall-XXXX-XXXXXXXXXXX.dump"))
My data variable is now a Hash that I can parse for the caller/callee information. Once I pretty print data, I get a better view:
{:version=>1.1,
 :mode=>:wall,
 :interval=>1000,
 :samples=>9,
 :gc_samples=>1,
 :missed_samples=>0,
 :frames=>
  {70135416024640=>
    {:name=>"Sprockets::URIUtils#encode_uri_query_params",
     :file=>
      "/usr/local/var/rbenv/versions/2.2.2/lib/ruby/gems/2.2.0/gems/sprockets-3.3.4/lib/sprockets/uri_utils.rb",
     :line=>154,
     :total_samples=>2,
     :samples=>1,
     :edges=>{70135416024440=>1},
     :lines=>{171=>[1, 1], 157=>[1, 0]}},
I get the name of the file being processed in the profiler. Edges refer to the methods called from this frame. Lines represent the samples per line number in this frame. If I traverse the tree, I'll eventually get to the line-of-code in my controller that is running the slow query.
More special Stackprof sauce?
The approaches above to find my slow custom code are still involved. We do this work for you in our new application monitoring service. Rather than seeing a mess of framework calls, you'll just see output like this:
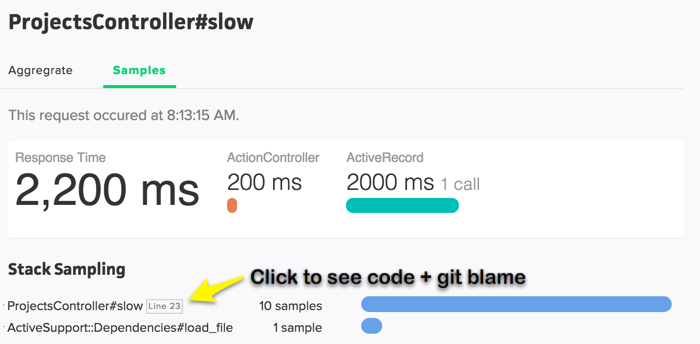
It's a big upgrade over traditional app monitoring services that only provide performance metrics on what you instrument.
Using Stackprof, we're able to gain visibility into uninstrumented, production code: a holy grail for performance work.
Sign up for our early access list to sample the goods.
StackProf: The Holy Grail of Ruby on Rails Performance Profiling
What is the best tool for performance profiling?
The holy grail of performance profiling is finding a tool that's safe to run in production. A tool that identifies slow code as it works "in the wild.”
Profiling code locally is never as good as production profiling: the load is small, hardware specs are different, and I'd need to pull down a huge chunk of data to simulate things.
Enter StackProf, the production safe*, holy grail of Ruby on Rails performance profiling tools.
How do I set up StackProf?
First, and most importantly, StackProf requires Ruby 2.1+. My sample application is using 2.2, so with that requirement met, it's a simple matter of adding StackProf to my gem file.
gem 'stackprof', '~> 0.2.7'
After running bundle install and I'm halfway there.
I'll use the middleware implementation for a Rails application and add this to my config/application.rb file:
→ [retain codeblock beginning with:
class Application < Rails::Application]
Next, I'll restart my server. As I click around in a local version of my app, I see that StackProf has started populating data as .dump files in the tmp directory.
How do I validate that StackProf is working?
To validate StackProf, I'm going to add some latency to my application. Outside services (e.g. DBs, External API Calls) are frequent bottlenecks, so I'll use pg_sleep to simulate a slow DB request.
→ [retain codeblock beginning with:
def slow]
After running, stackprof tmp/stackprof-wall-*.dump, I get this:
→ [retain codeblock beginning with:
==================================]
Boom! Almost all of the samples are from PostgreSQL::DatabaseStatements#execute. The application is spending all of its time processing the slow PostgreSQL call.
How do I interpret performance profiling results from StackProf?
For each sample, StackProf is going to collect N stack frames and metadata about each frame:
-
Samples
-
Total Samples
At the top of the output, you'll see the mode used, and the number of samples collected.
Below the header, method calls are represented with the respective number of samples seen.
It's important to note, in the output above, samples do not represent timing information; they simply refer to the number of times a method was on top of the stack. Using this relative weighting, my slow method was at the top of the stack 98.8% of the time.
How does using wall time vs. CPU time affect my performance profiling results?
Let's start by talking about the parameters I used to configure StackProf.
As a refresher, I added this line:
→ [retain codeblock beginning with:
config.middleware.use(StackProf::Middleware]
First up: Mode. :wall is going to refer to wall clock, with the interval defining how long to measure. In my sample configuration, I setup StackProf to measure every second (1000 ms).
The save_every parameter refers to how many samples are taken before writing to disk.
To illustrate what a dramatic effect the mode can have, I'll change the mode from :wall to :cpu. Here's what I get:
→ [retain codeblock beginning with:
==================================]
With CPU measuring, my slow DB query moved way down the list. In thinking about it, this makes sense. The CPU is simply waiting for a result to come back - it's not processing anything.
Is CPU time helpful for Rails apps?
CPU time doesn't paint the whole performance profiling picture: the main choke points in web applications are frequently external services. As this example shows, by using the :wall measurement and looking at where the Rails app is spending time vs. what the CPU is doing - I've got a clear picture of my application's bottleneck - the database.
In terms of speed and overall load, the interval and save_every parameters are the ones to tweak. I've found that an interval of 2000 and save setting of 5 have struck the right balance - but YMMV.
How do I confirm the accuracy of performance profiling results in StackProf?
In the output above, Stackprof points to DatabaseStatements#execute as the culprit for my slow code. While technically correct, the framework isn't slow - it's my slow query that's bad. I'd rather have the sample count "bubble up" to point to the line in my controller that's running the slow query.
There's a couple of things I can do to find the line-of-code I wrote causing the slowness.
From the command line, I can run:
→ [retain codeblock beginning with:
stackprof tmp/stackprof-wall-*.dump]
StackProf will report the callers and callees for the method.
I can do that over & over to dive deeper and deeper - but there's actually a better way. With a bit of ruby code, we can actually look at the source .dump files:
→ [retain codeblock beginning with:
data = Marshal.load(File.new]
My data variable is now a Hash that I can parse for the caller/callee information. Once I pretty print data, I get a better view:
→ [retain codeblock beginning with:
{:version=>1.1]
I get the name of the file being processed in the profiler. Edges refer to the methods called from this frame. Lines represent the samples per line number in this frame. If I traverse the tree, I'll eventually get to the line-of-code in my controller that is running the slow query.
How does ScoutProf compare to StackProf for application monitoring?
The approaches above to find my slow custom code are still involved. We do this work for you in our new application monitoring service. Rather than seeing a mess of framework calls, you'll just see output like this:

It's a big upgrade over traditional app monitoring services that only provide performance metrics on what you instrument.
Using Stackprof, we're able to gain visibility into uninstrumented, production code: a holy grail for performance work.