Prometheus Architecture Explained
 Prince Sinha
on
October 28, 2021
Prince Sinha
on
October 28, 2021

Monitoring of released software is an essential part of its lifecycle. There are various tools for monitoring software, but Prometheus is definitely a favorite tool for monitoring different metrics for your application. It allows you to collect metrics, process, filter, aggregate, and finally represent them in a human-readable format. In Prometheus, your whole project is centralized, and you can control the application from a single server and view the metrics on an HTTP endpoint on your web browser.
Although you can use Prometheus for any application, people mainly use it for the Kubernetes application because many features of Prometheus perfectly match with Kubernetes. For example, multi-dimensional data, the format of metrics and service discovery, etc. Hence most of the Kubernetes application is monitored using Prometheus.
Feel free to navigate through the post using these links.
- What is Prometheus?
- Prometheus Server
- Prometheus Gateway
- Alertmanager
- Prometheus Targets
- Client Libraries
- Prometheus Exporters
- Service Discovery
- Security at Prometheus
- Why Not Prometheus
- Key Takeaways
Prometheus consists of several elements that help provide excellent services like Prometheus servers, push gateway, alert manager, client libraries, etc. This article will discuss the Prometheus architecture in detail and see what each element does. Before discussing the architecture, let us take a look at Prometheus and its functionality in detail.
What is Prometheus?
Prometheus is an independent open-source tool for monitoring and maintaining your application. SoundCloud initially developed the tool, and due to adoption by several organizations after 2012, it has fostered a very active developer and user community. Later in 2016, it joined the Cloud Native Computing Foundation as a second-hosted project after Kubernetes. Currently, it is independent and not owned by any company.
Here are some of the main features of Prometheus:
- Multi-dimensional data model with time series data and metrics in the form of key-value pairs.
- PromQL, a flexible query language for multidimensional data.
- Autonomous single server nodes.
- Accessing your metrics via HTTP endpoint and showing them in a browser.
- Exceptional support and libraries for metrics of different stacks.
- Multiple nodes for graphing and dashboarding support.
- A pull-based metric system that helps in scraping metrics remotely also.
- Discovering targets via service discovery or static configuration.
Metrics in Prometheus
Metrics are a large amount of data through different aggregations of different types of events. But there usually is an infinite amount of such data; hence we cap this at about ten thousand metrics. The number of metrics is generally determined by the number of requests from a specific endpoint and pending or in-progress requests. During the calculation of metrics, Prometheus usually ignores the context.
This does not mean context is always ignored. We have the power to have metrics for each URL or endpoint. By checking the metrics, you can not directly see which user’s request is causing problems to the system, but you can see events from all your processes, and there you can see which subsystem is causing the slowdown. Then after some microanalysis of that subsystem, you can find out the exact user. As a monitoring-based system, Prometheus has to take care of everything, like requests performed in the last 15 minutes, number of successful calls, number of database calls, number of caches, and number of customers exactly gained.
Use Cases
People in the developer community know Prometheus as a perfect monitoring tool for performance monitoring, cloud monitoring, IoT monitoring, etc. Its ease of use and versatility make it suitable for many types of applications, be it a python web application or a Kubernetes application. It can handle almost any kind of metrics your application may push and fetch.
Prometheus is well suited when you are going to record purely numeric time-series data. It works well with machine-centric as well as highly dynamic service-oriented monitoring. Its support for querying multi-dimensional data is one of its specialties.
Prometheus server is standalone and helps you diagnose problems with your system quickly. Even if some part of architecture is broken, you can still rely on Prometheus for monitoring as it does not need extensive architecture.
Components in Prometheus Architecture
Prometheus has several components which help in the overall monitoring of your application. These components of the architecture are:
- Prometheus Server
- Push Gateway
- Alert Manager
- Prometheus Targets
- Client Libraries
- Prometheus Exporters
- Service Discovery
- Key Takeaways
First, Prometheus scrapes data using the Prometheus server and finds targets using the Service discovery. After that, the scraped data is sent to the dashboard and processed using PromQL and sends alerts to the alert manager, who will send notifications to the user.
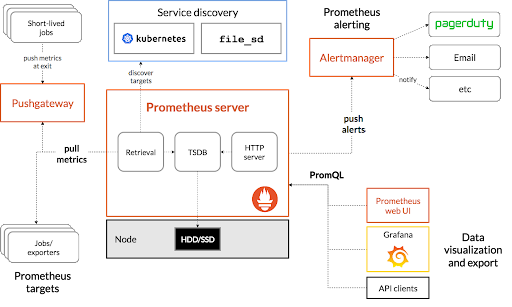
The Prometheus Architecture (source: Prometheus.io)
Prometheus Server
The server is the brain of any web or mobile application. Prometheus server does the same for Prometheus services or clusters. It collects multi-dimensional data in time series and then analyzes and aggregates the collected data. The process of collecting metrics is called scraping.
Time series format is when data is collected after successive or fixed time intervals. You can access the metrics by using the metric names or optional key-value pairs. Labels are often used for distinguishing between various metrics. This is very helpful when you want to drive some results based on a particular value. After doing some filters on collected metrics, you can make another time series.
Let say you want to track the HTTP requests of different URLs of your application. If you do it in a naive manner, you will create other metrics for each path like http_requests_login, http_requests_logout, http_requests_adduser, http_requests_comment to track requests for login, logout, and user, and comment, respectively. But when you want to see the total number of requests for the application, it will be difficult to do that. But using labels, you can make metrics by adding a path attribute like http_request__total(path=”/login”). This way, you can fetch data for separate endpoints, and if you want for the overall application, just remove the path variable.
The Prometheus server automatically pulls metrics from the targets; hence the user does not need to push metrics for analysis. This eases the client’s task to a great extent because pushing metrics every time is tedious. The only thing you have to do is to expose metrics such that Prometheus can access them. You just need to create an HTTP endpoint with /metrics, which returns the complete set of metrics.
Prometheus Gateway
The Prometheus server alone would not scrape all kinds of metrics; some require extra mechanics. Prometheus Gateway is the intermediary source used for metrics from those jobs which can not be scraped by usual methods. There are certain drawbacks to using Prometheus Gateway blindly:
- When you are opening multiple instances through a Prometheus Gateway, It creates a point of failure and can be a bottleneck.
- You could not use Prometheus automatic instance health monitoring.
- The push gateway always exposes the data collected to the Prometheus for any reason, and we can not delete that information manually from the Gateway’s API.
When multiple instances of a job use an instance label for differentiating their metrics in the push gateway, the metrics remain in the push gateway even after the original entity deletes. It happens because the lifecycle of an instance in the push gateway is different from the lifecycle of the actual process. On the other hand, in Prometheus classical pull, metrics also delete when the original instance gets deleted.
One case where push gateway is handy is when you want to capture service-level batch jobs. A service-level batch job is not semantically related to a particular job or machine, for example, deleting the number from the entire system. This kind of metrics should not include machine or instance labels that decouple the lifecycle of specific machines or instances from the pushed metrics.
Alertmanager
Alertmanager is responsible for managing the alerts sent by the clients. It checks for supplication, groups the signals, and routes them to the correct application like email, Pagerduty, Opsgenie, etc. It also checks for when it should keep alerts off and when not.
You can do various things with Alerts received from a client (Prometheus Server) to the Alertmanager. You can group similar types of notifications that prevent you from seeing similar notifications repetitively. You can mute notifications as well.
When a network partition occurs, there are hundreds of instances running. More than half of the instances could not reach the database, and there are alerting rules so that it sends an alert to the alert manager for every instance that did not reach the database. In the alert manager, you can configure that all alerts related to the same type of instance are compiled in a single alert and then sent to the alert manager.
Grouping
You may have noticed that notifications from the same app often come as a single notification on your smartphone. This is called grouping. Grouping clubs the notifications of a single nature into a single notification.
In the Prometheus server, hundreds of notifications come at once, and it may make the system fall as it has to fire hundreds of alerts simultaneously. Grouping converts a similar type of notification into a single one and thus reduces the server load. A routing tree in the configuration file controls the setting for grouping and their timing.
Inhibition
Inhibition is generally suppressing one notification when the other alerts are already firing. For example, an alert is firing, which notifies that the cluster is not reachable. Alertmanger then could pause all the alerts related to this cluster and prevent firing hundreds of alerts unrelated to the issue. The configuration file controls the properties of inhibition.
Silence
Silence is the property that mutes the alerts for a particular time. Silence occurs with the help of matches, like regex matching. The incoming alerts matched with the regular expression and properties of the previous alerts; if they do, then no notification will be sent to the system. Silence configures in the web interface of the Alertmanger.
Configuring Alert Manager
For configuring Alertmanager to Prometheus, you have to tell Prometheus how to communicate with the Alertmanager. For this, you have to add the following lines to the prometheus.yml file.
# Alertmanager configuration
alerting:
  alertmanagers:
  - static_configs:
    - targets:
      - alertmanager:9093   # host:part
Here you will provide the docker container name instead of localhost so that Prometheus Server can discover the alert manager via docker embedded DNS.
Prometheus Targets
Prometheus targets represent how Prometheus extracts metrics from a different resource. In many cases, the metrics are exposed by the services themselves, such as Kubernetes. In this case, Prometheus collects metrics directly. But in some instances, like in unexposed services, Prometheus has to use exporters. Exporters are some programs that extract data from a service and then convert them into Prometheus formats. Here are some examples of the exports below:
- Hardware: Node/system
- HTTP: HAProxy, NGINX, Apache.
- APIs: Github, Docker Hub.
- Other monitoring systems: Cloudwatch.
- Databases: MySQL, Elasticsearch.
- Messaging systems: RabbitMQ, Kafka.
- Miscellaneous: Blackbox, JMX.
In the multi-target export pattern, the metrics export via a network. They do not have to run on the parent machines of the metrics, and they can query from multiple targets. Blackbox and SNMP exporters use multi-target exporter patterns.
For configuring Prometheus targets to your server, you can use the following code:
global:
  scrape_interval: 15s

scrape_configs:
  - job_name: prometheus
    static_configs:
      - targets: ["localhost:9090"]
  - job_name: eventservice
    static_configs:
      - targets: ["events:9090"]
  - job_name: bookingservice
    static_configs:
      - targets: ["bookings:9090"]
After adding those scripts, you have to restart your Prometheus server by using docker container restart prometheus. After restarting, you will be able to see the new targets.
Client Libraries
As we all know, Prometheus collects data in time-series formats that are multi-dimensional. So clients are always asked to send in this form specifically. But in most cases, metrics rules are not automatically written; instead, you need to add them manually. So for making metrics in Prometheus-compatible formats, there are two ways. It can be done manually on the client-side or use third-party exporters to convert data in Prometheus formats. When you control the client’s source code, you can go ahead with the first option; otherwise, second.
Prometheus provides various client libraries, some are official, and some are unofficial. If you can control the source code, client libraries provide the client-specific instrumentation and metrics collection. The client library sends the current state of all tracked metrics to the server whenever Prometheus scrapes your instances’ HTTP endpoint.
Client libraries are generally available for all of the major programming languages. In response to HTTP requests, client libraries take care of the details such as safety of the threads, bookkeeping, and the format of Prometheus text exposition. Since metrics-based monitoring does not monitor individual events, the more events you have, the more client library storage you use.
Client libraries are not restricted to text output metrics from Prometheus. It is an open ecosystem that can be used by the same APIs used for creating text format for the creation of metrics in another format or for feeding into other instruments.
Client libraries for instrumenting your own code are available in Go, Java/JVM, C#/.Net, Python, Ruby, Node.js, Haskell, Erlang, and Rust, among other prominent languages and runtimes. Software like Kubernetes and Docker already include Prometheus client libraries. There are hundreds of integrations available for third-party software that offers metrics in a non-Prometheus format. HAProxy, MySQL, PostgreSQL, Redis, JMX, SNMP, Consul, and Kafka are examples of exporters.
Official client libraries:
- Go
- Java or Scala
- Python
- Ruby
Unofficial client libraries:
- Bash
- C
- C++
- Common Lisp
- Dart
- Elixir
- Erlang
- Haskell
- Lua for Nginx
- And much more
Prometheus Exporters
As mentioned above, in most cases, metrics are self-exposed by the service. In such cases, Prometheus automatically collects metrics. In other cases, Prometheus needs to scrape metrics. Exporters are third-party tools that help scrape metrics when it is not feasible to extract metrics directly. Some exporters are official, while others are not officially declared in the Prometheus Github organization.
Prometheus exporters can go into various categories such as database exporters, hardware related, issue trackers, storage, HTTP, APIs, logging, miscellaneous alert managers, and other official Prometheus exporters. Database exporters include Aerospike, Cickhouse, Couchbase, CouchDB, Druid, Elastic Search, etc. Hardware-related exporters include Accuse, Big-IP, Collins, Dell Hardware, etc. Other than that, various third-party software like Ansible Tower, Caddy, CRG, Doorman, Etcd, Kubernetes, Midonet-Kubernetes, Xandikos, etc.
Various language-specific utilities are not the exact exporters of Prometheus, but they use one of the exporters under the hood. For example, Iapetos is for Clojure, Gokit for Go, Jersey MetricsCollector for Java, Django-Prometheus for Python, Swagger-Stats for NodeJs.
Github hosts the majority of Prometheus exporters, and you can also make your exporters for instrumenting your code. While making your library, you should keep some general guidelines by Prometheus for instrumentation in mind.
Service Discovery
In the Prometheus Targets section, we discussed using static-config files to configure the dependencies manually. This process is ok when you have simple uses with the config file, but what if you have to do this in a large amount? Especially when some instances are added or removed every single minute?
This is where service discovery comes into play. Service discovery helps in providing Prometheus the information of what to escape in whichever database you want. Prometheus’ common service discovery resources are Consul, Amazon’s EC2, and Kubernetes out of the box.
For non-supported source resources, you have to use a file-based service discovery mechanism. This can be done using your configuration management system like Ansible or Chef and pass the script containing a list of sources from which you want to pull data.
Prometheus Data Visualization
Prometheus collects measurements and stores them locally in a time series database. A user can pick and aggregate existing time-series data in real-time using the Prometheus Query Language (PromQL). Prometheus Expression Browser can display the result as graphs or tabular data, or the data can feed an external visualization integration via an HTTP API. Grafana is the external integration of choice for Prometheus visualization.
A time series can be identified by a data model by its name and by an unordered set of key-value pairs known as labels. The PromQL query language supports aggregation across any of these labels, allowing you to look at data not just by process, but also by datacenter, service, and any other labels you've set up.
Security at Prometheus
The un-authorized on Prometheus have access to all time series data in the database, as well as a range of operational and debugging data. Only authorized people are able to edit the command line, configuration file, rule files, and other features of Prometheus' and other components' runtime environments.
The configuration file determines which targets Prometheus scrapes, how often, and with what other settings. The administrator may choose to employ data from service discovery systems, which, when paired with relabeling, might give anyone with access to the data in that service discovery system some control.
Untrusted users may run scraped targets but they will not be able to expose data that impersonates another target by default. The honor_labels option, as well as some relabeling setups, can disable this protection.
The data for sending alerts are accessible to anyone who has access to the Alertmanager's HTTP endpoint. They can create and resolve notifications, and they have the ability to create, modify, and eliminate silences.
The configuration file determines where notifications go. Notifications can wind up at an alert-defined destination with certain template setups. If the destination email address for notifications is an alert label, anyone who may submit alerts to the Alertmanager can send notifications to any email address.
There are many exporters that obtain their targets from URL parameters, such as the SNMP and Blackbox exporters. As a result, anyone with HTTP access to these exporters can force them to send queries to any endpoint they want. Because they also offer client-side authentication, secrets like HTTP Basic Auth passwords or SNMP community strings could be exposed. Security techniques like TLS and various authentication mechanisms are unable to cope with it.
Why Not Prometheus?
Now that you know where Prometheus fits into the larger monitoring landscape and its principal components, let's look at some cases for which Prometheus isn't an excellent decision.
You cannot use Prometheus as a metric system to store event logs or events. You can’t choose even high cardinal data such as email addresses or usernames. Prometheus is for operational monitoring where minor inaccuracies and race conditions are a part of life because of kernel planning and failed scrapings. Prometheus compromises and prefers to give you data that is 99.9% correct when waiting for accurate information. You should therefore use Prometheus with caution in applications involving money or billing.
When Prometheus is scaled up, it encounters difficulties (a situation that is often unavoidable in the era of highly distributed modern systems). Prometheus can’t query and aggregate metrics from numerous instances from the start. If Prometheus engineers try to solve this problem, it would require a lot of engineering effort and add complexity in Prometheus deployment. This can disrupt the overall importance of Prometheus as a management tool, which is essential for executing incident response at any degree of efficiency.
Finally, Prometheus cannot save metrics data for a long time. This type of historical data can be quite useful for firms that manage complicated ecosystems. For example, organizations may wish to examine these metrics to see if any patterns emerge over the course of a few months or even a year, in order to acquire a better knowledge of system utilization over time. When systems are pushed to their limitations, such insights can help choose scaling solutions.
The above cons of Prometheus happen only when Prometheus is used standalone, but when you pair Prometheus with some other tools like Grafana, SumoLogic etc, it can provide all those features you’re missing.
Key Takeaways
So far, we have discussed the different components of Prometheus architecture. Each architecture component has its importance and requirement. Prometheus server is considered the brain of your whole architecture because it is the one that collects multi-dimensional data, analyzes and aggregates it. The Prometheus server does most of the scraping, and Prometheus gateway provides an intermediary path for scraping metrics from those jobs that can’t be scraped normally.
You can use Alertmanager for pushing alerts to failed builds or issues in the application. Some of the terms we have discussed in alerting are Grouping, Inhibition, and Silence. Prometheus Targets helps extract metrics from unknown resources, and Client libraries help in doing client-specific instrumentation with the metrics collected. After that comes the exporters, which help export metrics that are not in Prometheus formats. There are various categories of exporters for different purposes.
If you want to have next-level experience in application performance management tools, try Scout APM today. You can use it for free for 14-days without a credit card.
Happy coding!


