Web Endpoint Monitoring
 Mukul Khanna
on
September 13, 2022
Mukul Khanna
on
September 13, 2022

In today’s world, a significant fraction of a software business’s reputation depends on its web application and its speed. It all comes down to how fast your server responds to client requests (assuming your application is reliable and reasonably user-friendly). Therefore, you could argue that the server endpoint is the centerpoint of all the server-side action — the operations here primarily determine the performance of your application.
And as a result, you’d want a setup that proactively monitors and keeps track of your endpoints' performance, identifies bottlenecks, analyses trends, and provides actionable insights for boosting performance.
This post will double-click on this essential piece of your application’s setup and execution. We will talk about web endpoints, how they broadly operate, the importance of monitoring them, and how you can get started with endpoint monitoring for your own application using effective APM tools like Scout.
Here is an outline of what we’ll cover so you can easily navigate or skip ahead in the guide:
- What are Web Endpoints?
- Why is Endpoint Monitoring Important?
- Getting Started: Monitor your Endpoints with Scout
- Conclusion
What are Web Endpoints?
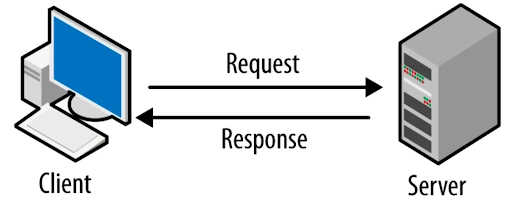
If you are reading this post, I suppose you’d already know how conventional request/response transactions on the internet work. This starts with end users (or clients) requesting data from servers through specific channels defined by endpoints (or routes). Each endpoint serves a different purpose and is responsible for processing a different kind of transaction. Once it receives a request at the endpoint, based on the request and the endpoint, the server processes the payload (request data) and returns a response useful for the client.
Endpoints, in the context of monitoring, are often confused with network endpoints (which refer to monitoring end-devices on a networked connection). This post is, however, focused on web endpoint monitoring, i.e., the monitoring of web server endpoints that conduct request/response-based transactions with the client.
Why is Endpoint Monitoring Important?
As we already discussed in the introduction, the processing at the server endpoint is the central piece of your setup. Any unforeseen errors, unnecessary delays, or inefficiencies in processing here could slow the whole application down (regardless of how fast the other processes execute) and could lead to some very unhappy end-users. Being vigilant and keeping track of performance on a continuous basis will allow developers to be prepared for any issues that might come up and make amends before the end users catch wind of anything amiss.
Therefore, you’d want to leave no stones unturned when it comes to analyzing your endpoints’ performance and squeezing the most out of your infrastructure.
However, as you can imagine, manually babysitting all the various pieces of your application can be unnecessarily laborious and a waste of resources. There’d be times when you’d see no issues for days and other times where you could get more errors than you have ever seen in the span of a few minutes. Plus, some issues might show up during non-working hours.
I suppose you get where I’m going with this. You need an automated monitoring system that:
- is on the lookout for trends 24 x 7 x 365
- provides real-time alerts about issues
- identifies performance bottlenecks
- provides actionable insights about boosting performance
- offers full-stack traceability into your code
Furthermore, you would want the system to:
- be user-friendly, easy to set up and interact with
- offer support for your desired programming languages and frameworks
- integrate with useful third-party tools
- come at a sensible price point
Application Performance Monitoring
In the last few years, Application Performance Monitoring (APM) has taken the software world by storm — primarily because of how useful they have proven to the industry. They enable organizations and developers to be prepared for any unanticipated ebbs and flows in the performance of software applications, make debugging easier, and provide practical insights into enhancing user satisfaction.
There are dozens of APM tools in the market for organizations looking to get started. In this post, we will focus on one of the industry leaders in APM solutions, Scout, and its endpoint monitoring capabilities.
Getting Started: Monitor your Endpoints with Scout APM
A little earlier in this post, we looked at a bullet list of all the features you would want in an automated monitoring system for your application.
Scout ticks all the above boxes for monitoring endpoints in your application. Below is a sneak peek into Scout’s overview dashboard, where you can access the most useful performance metrics and visualizations for getting a sense of your application’s health.
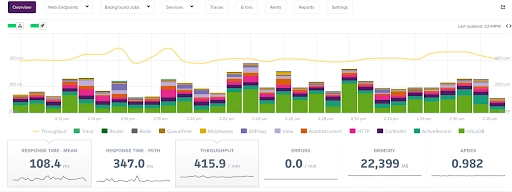
Scout’s Overview Dashboard
For monitoring endpoints, you can switch over to the Web Endpoints tab to get a list of the most time-consuming endpoints in your application with helpful metrics and graphs that indicate trends. Here, for each endpoint, you can learn about the percentage time consumed, mean response times, throughput, maximum memory allocations, error rates, and more.
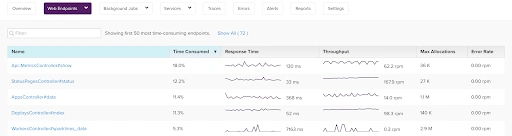
Web Endpoints Dashboard
Additionally, you can dive deeper into each request to get dedicated metrics, time and memory allocation breakdowns for corresponding transactions, lower-level contextual information, user satisfaction (ApDex) scores, and more.
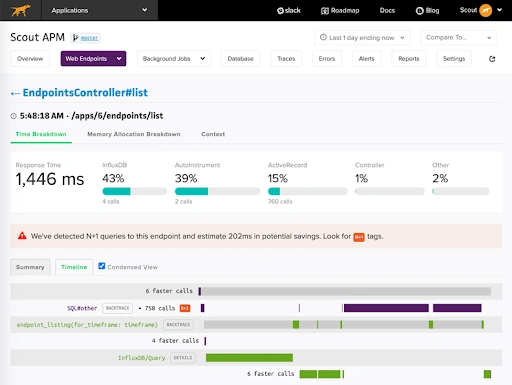
Deep dive into a specific endpoint
All in all, you can see how valuable these records can be in painting a detailed picture of the state of affairs for your whole application. For information about how to get started with integrating Scout’s APM agent into your application, feel free to check out our documentation here.
To learn more about why Scout offers the best suite of monitoring services for your organization, check out our Why Scout page.
Conclusion
In this post, we discussed endpoint monitoring for web applications. We started with a quick overview of conventional client-server communication through web endpoints, followed by discussing the importance of endpoint monitoring with APM tools and how you can get started with Scout immediately.
Now that you have a good understanding of the significance of web endpoint monitoring go ahead and consider investing in an APM tool like Scout for your projects. Spend more time building and less time debugging. Get started with Scout using a 14-day free trial (no credit card needed!), or schedule a demo with our experts today to learn more.


