What is Prometheus? The Essential Guide
 Ganesh Mani
on
July 08, 2021
Ganesh Mani
on
July 08, 2021

DevOps is an essential part of software development in the modern IT world. However, as the application becomes more and more complex, managing infrastructure can become challenging. One of the essential aspects of driving such infrastructure is metrics collection and performance monitoring.
There are plenty of tools available for monitoring a system or an infrastructure, but we are going to focus on, analyze, and look at the architecture of Prometheus.
Navigate this blog by using the links below:
- An Overview of Prometheus
- Prometheus Architecture
- Prometheus Metrics
- Why Use Prometheus?
- How to Get Started Using Prometheus
- Recap
An Overview of Prometheus
Prometheus is an open-source and metrics-based tool to monitor highly dynamic container environments like Kubernetes and Docker Swarm. We can also use it in traditional and non-container applications.
The main features of Prometheus are,
- It is a stand-alone and self-containing monitoring system without any dependency on remote services.
- It stores the metrics in a time-series format with key/value pairs.
- Collection of metrics from different targets happen via pull mechanism over HTTP.
- Service discovery or static configuration helps to find the target location.
- PromQL fetches the metrics and aggregated data from the time-series database via an HTTP server.
A Brief History of Prometheus
Prometheus was started by developers from SoundCloud in 2012 to solve metrics across the distributed applications. It is mainly written in Go and licensed under Apache 2.0 license.
In 2016, Cloud Native Computing Foundation (CNCF) accepted Prometheus as a second incubated project for Kubernetes and Envoy.
After that, In July 2016, Prometheus 1.0 was released, and finally, in August 2018, Cloud Native Foundation announced that the Prometheus project has graduated.
Prometheus Architecture
Prometheus contains the main component, i.e., Prometheus Server, which does the actual monitoring job.
Each Prometheus Server contains three components:
- Data Storage
- Data Retrieval Worker
- HTTP Server
Data Storage
Prometheus pulls the metrics from several targets and stores the data in the database in time-series format. We can also integrate a remote storage system with the database. The structure of the metrics in the database will be (timestamp, value).
Storage handles several metrics such as CPU usage, memory/disk usage, or several exceptions.
Data Retrieval Worker
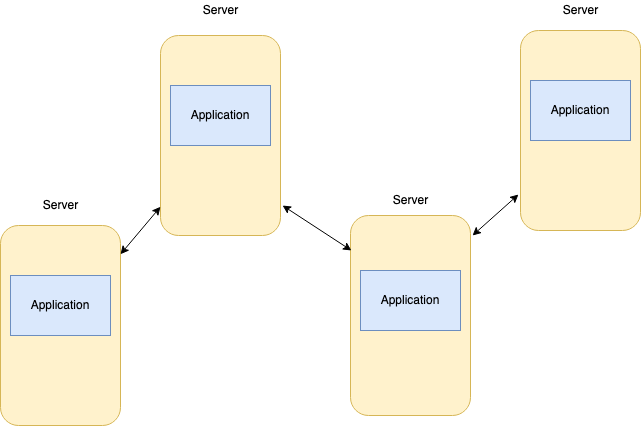
The retrieval worker is responsible for pulling the metrics from several targets. Targets can be an application, server, or individual services. Once it pulls the data, it stores it.
To pull the data successfully from targets,
- The target must implement a `/metric` HTTP endpoint that Prometheus uses to pull the data.
- Metrics must be in the correct format.
Some targets have native components for Prometheus, so it handles the data format conversion by itself.
For others, we need a way to convert the data format before allowing the worker to pull the data. For that, we need an Exporter or a third-party service that collects the metrics from targets and does the conversion before exposing them to retrieval workers.
HTTP Server
The third component in Prometheus is an HTTP server that accepts a query from clients or alert managers and fetches the stored metrics from the Prometheus database.
The server component uses PromQL, a query language, to fetch the data from storage. For example, we can use PromQL to fetch the data and display it in the dashboard of visualization tools such as Grafana.
We can also use Alert Manager (see below) to notify via email, Slack, or other third-party applications.
Pushgateway
Prometheus can scrape data from almost any kind of service, but there are some exceptions. These are services with short-lived scheduled jobs. Pushgateway comes in to solve this problem. It’s an intermediary that allows pushing the metrics from jobs to Prometheus.
Prometheus recommends using Pushgateway only in certain limited cases as it has some constraints that can impact the monitoring process:
- There is a single point of failure when monitoring multiple server instances via single Pushgateway
- Pushgatway keeps the time-series metrics and will keep on exposing those old metrics to Prometheus unless manually deleted via Pushgateway API.
Alert Manager
Alert Manager handles the messages from the Prometheus HTTP server and sends a notification to the maintainer via the configured channel. It can be via email, Slack, or another third-party integrated service.
Prometheus Metrics
Prometheus monitors the target, collects metrics for visualization, and alerts the maintainer based on different rules. Targets can be Linux/Windows servers, an application, or a database.
Metrics can be any kind of data. For example, it can be a CPU usage status, Memory/Disk usage for the server, exception count, request count, network traffic for an application, connect request count, network traffic for the database, etc.
Metrics are in a human-readable text-based format. Prometheus offers four metric types:
- Counter
- Gauge
- Histogram
- Summary
Counter
Counter represents a cumulative value that can either increase or reset to zero on the restart. For example, a number of requests, no jobs executed, and no exceptions can be considered counter metric types.
It’s recommended not to use Counter for metrics that can decrease—for example, the number of processes running in the server.
Gauge
Gauge represents a value that can go up or down. For example, it can be the number of concurrent threads, or current memory usage.
Histogram
Histogram cumulates the observations and adds them to a configurable bucket to analyze. For example, observations can be request duration or response sizes.
- We can access the configurable bucket using <basename>_bucket{le="<upper inclusive bound>"}.
- We can access the total sum of the values on the variable <basename>_sum.
- Event counts are exposed under <basename>_count.
Summary
A summary samples observations (typically things like response sizes and request durations). It provides a total count of observations and a sum of all observed values, and it also calculates configurable quantiles over a sliding time window.
- Observed event streams φ-quantiles (0 ≤ φ ≤ 1) are exposed as <basename>{quantile="<φ>"}
- Total sum value is exposed as <basename>_sum
- Event count is exposed as <basename>_count
Why Use Prometheus?
Modern DevOps is becoming more and more complex to handle manual tasks. Therefore, it needs automation to get the job done.
Imagine running multiple applications in servers distributed across many locations with hundreds of processes. Each of them is interconnected, and you have no insight into what’s happening on the hardware level or application levels.
It can be errors, CPU Usage, Memory/Disk Usage, Network latency, or resource limitations. With such complex infrastructure, it’s difficult to debug without monitoring the infrastructure.
Suppose one specific server ran out of memory and kicked off the running container responsible for database sync between two database pods in the Kubernetes cluster. In that case, the database and service using that database will stop working, and when the user would try to use the API, they would get a simple error message on the UI.
Debugging this issue by analyzing and backtracking the services is difficult and time-consuming. If we are debugging it manually without monitoring tools, we need to check
- Is our backend running?
- Is there any exception in the particular service that is responsible for the specific failed API?
- Are the specific services running that interconnects with the API?
- What is the reason for the service failure?
So, we have to backtrack on each service to find the database sync issue and find the service that just ran out of memory. This manual process can eat a lot of time. To make this process more efficient, we should have a tool to monitor all the running services and alert the maintainer as soon as there is a crash or an excess in resource limit exceptions.
In the above case, Prometheus would have regularly monitored resource usage and updated the maintainer before the crash happened.
Another main advantage of using Prometheus over other tools is the mechanism. For example, Prometheus uses a pull mechanism, whereas other tools such as Amazon cloud watch, NewRelic, use a push mechanism. A system like Amazon CloudWatch, NewRelic installs a daemon (an additional step) in each service and pushes the metrics from service to centralized server.
Unlike these other tools, Prometheus just requires an HTTP endpoint from a service to scrape the data. In this way, Prometheus can pull the metrics from multiple instances.
It also gives the monitoring tool an insight to detect the service status. For example, suppose, service is pushing the data like Amazon CloudWatch, NewRelic. There can be many reasons if it fails to push the data. So, it’s challenging to get an insight into that. But in Prometheus, since it pulls the data, we can easily detect if the service is running or not.
How to Get Started Using Prometheus
As we said, Prometheus collects the metrics from the target by scraping the endpoint. One of the exciting things about Prometheus is that it monitors its health along with monitoring targets.
Install Prometheus
Download Prometheus from the official site, then extract and run it.
tar xvfz prometheus-*.tar.gz

cd prometheus-*
Let’s configure Prometheus in our machine to monitor itself. The process involves scraping the metrics from HTTP endpoints. Prometheus uses the same process to monitor its health.
Once you console it inside the downloaded directory via terminal, you need to create a prometheus.yml file and add the following configuration.
global:

  scrape_interval:     15s


  external_labels:

    monitor: 'codelab-monitor'


scrape_configs:

  - job_name: 'prometheus'


    scrape_interval: 5s


    static_configs:

      - targets: ['localhost:9090']
Here, we define a global config and scrape config. Global config contains:
- scrape_interval - It defines an interval at which Prometheus hits the HTTP endpoint to fetch the metrics.
- external_labels - it attaches the external system to notify alerts.
Scrape config contains:
- job_name - the name of the job that is running to pull the metrics from the target.
- scrape_interval overrides the global default, scraping the target based on the defined value here.
- static_configs - it contains targets that Prometheus needs to scrape. It should be an array of HTTP endpoints.
Starting Prometheus
We can start the Prometheus server using the command:
./prometheus --config.file=prometheus.yml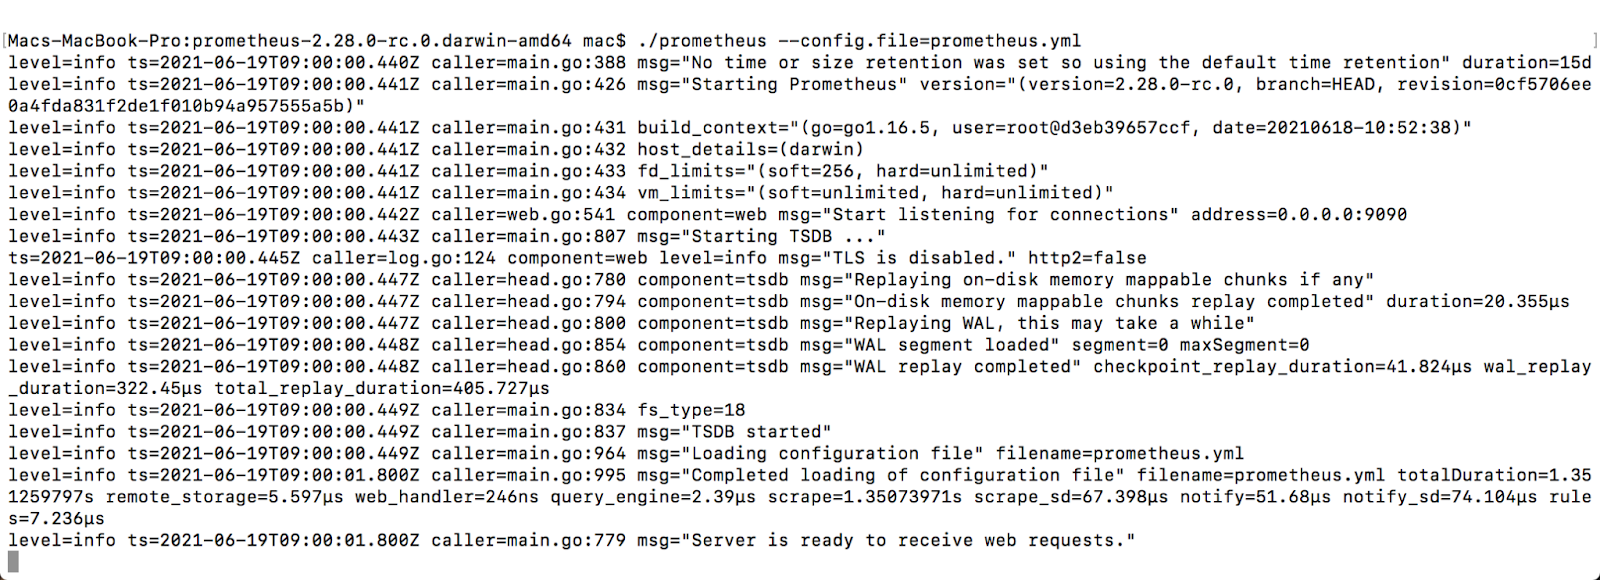
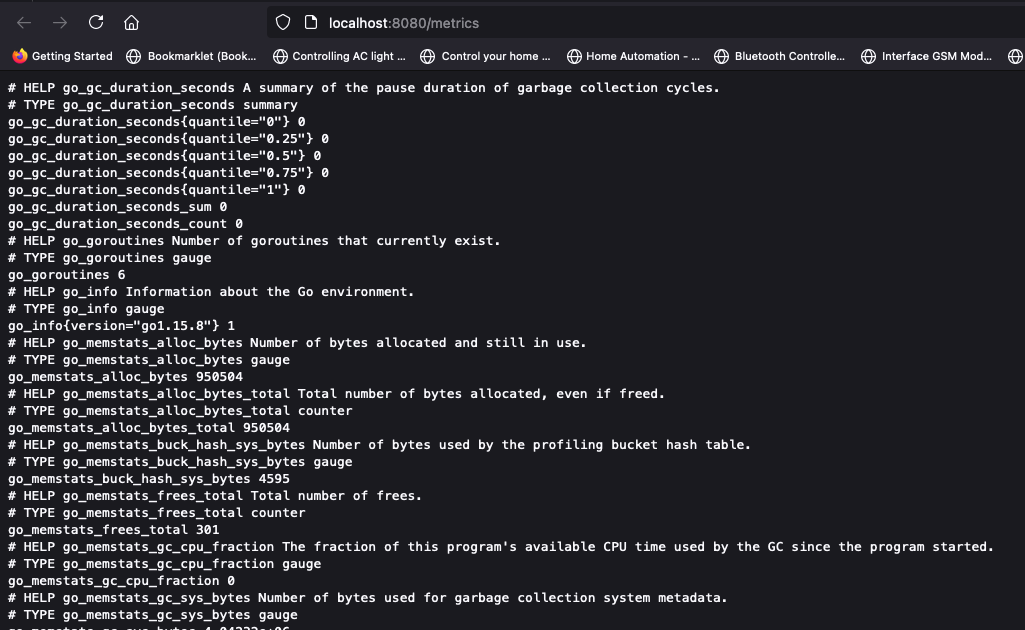
After the server is running, you should see the status of Prometheus in the dashboard at http://localhost:9090. To monitor its own health, it collects the metrics from the HTTP endpoint. We can check that at http://localhost:9090/metrics.
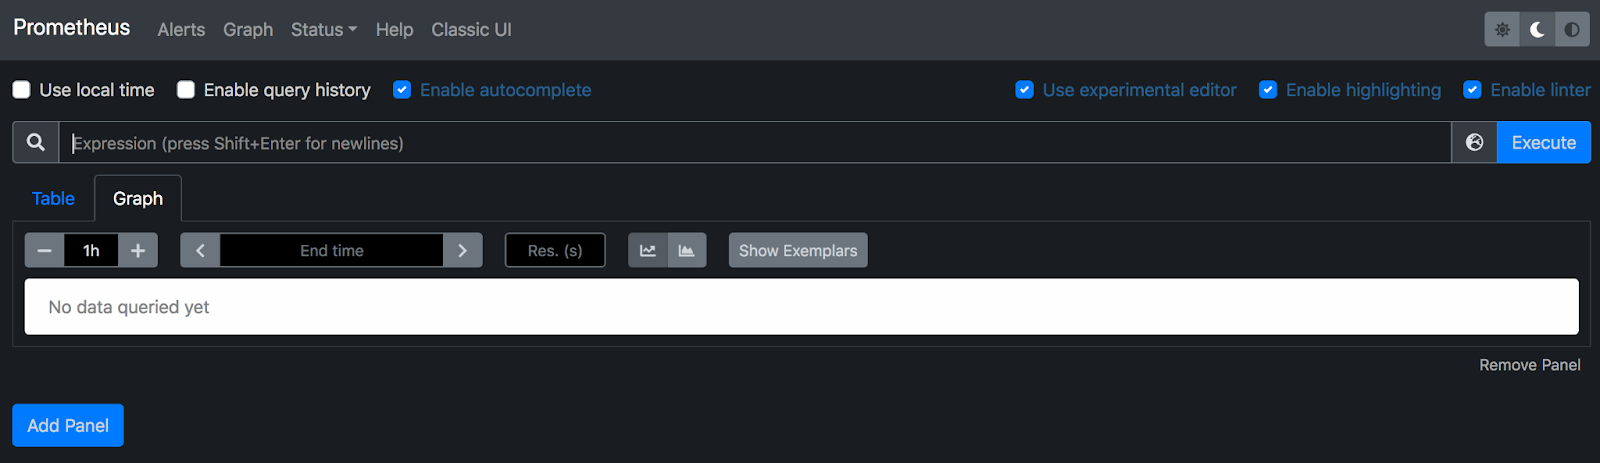
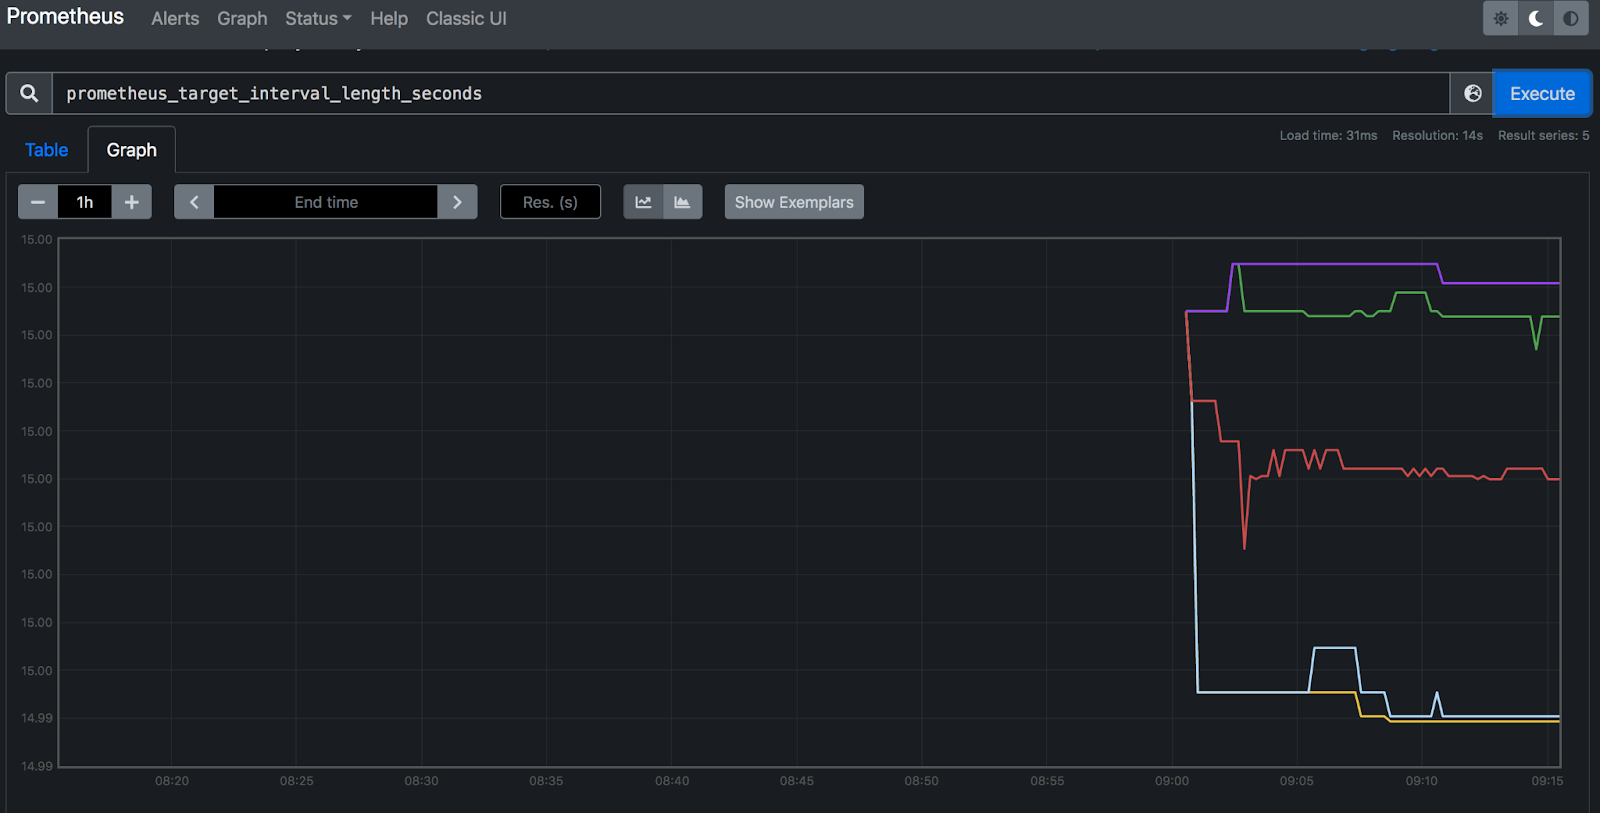
To visualize a specific metric, we can execute an expression in the graph console, and it displays the metric info in the dashboard. For example, one metric that Prometheus exports is prometheus_target_interval_length_seconds, i.e., the actual amount of time between the target scrapes.
Execute the expression on the console, and you can see the following visualization.
Monitoring Targets
Let’s monitor some targets by running sample targets in our machine. You can download Node exporters from this download page.
You can install it using the commands:
tar -xzvf node_exporter-*.*.tar.gz

cd node_exporter-*.*
We will start with 3 sample targets using:
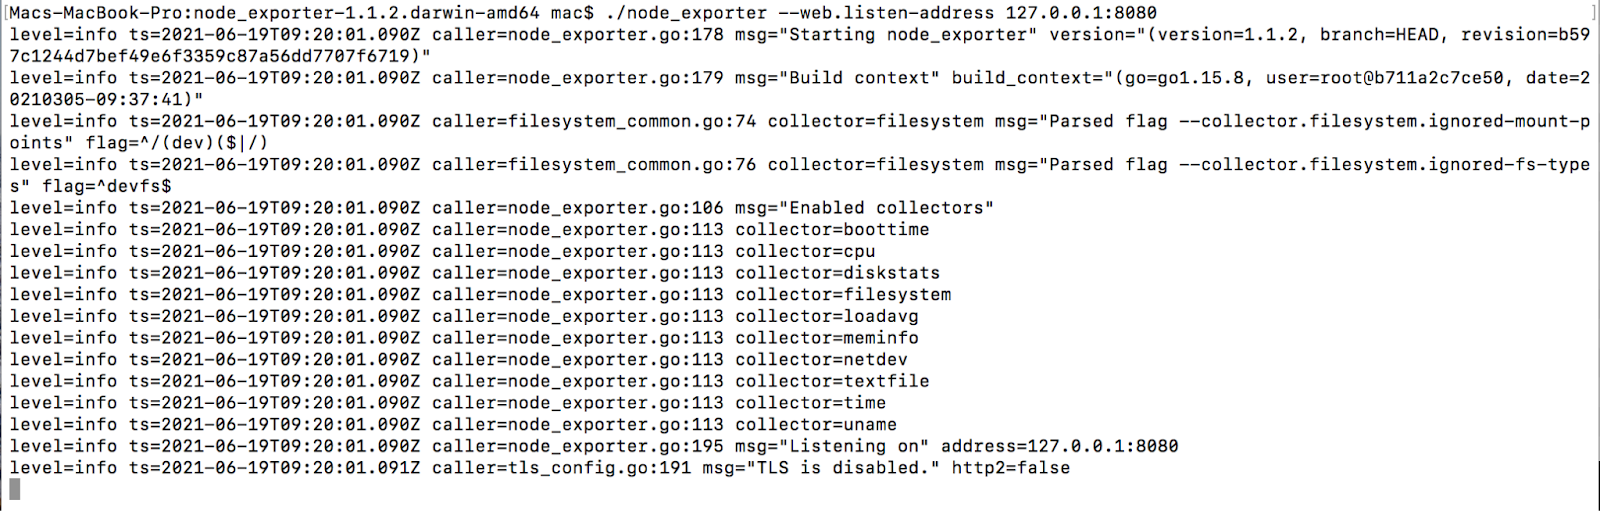
./node_exporter --web.listen-address 127.0.0.1:8080

./node_exporter --web.listen-address 127.0.0.1:8081

./node_exporter --web.listen-address 127.0.0.1:8082
You should be able to see the exporters running in the terminal.
Once the exporters are running, we need to configure Prometheus servers to monitor the exporters by mapping the HTTP endpoints in the config file.
Add the following config under scrape_configs in prometheus.yml.
scrape_configs:
- job_name: 'node'
# Override the global default and scrape targets from this job every 5 seconds.
scrape_interval: 5s
static_configs:
- targets: ['localhost:8080', 'localhost:8081']
labels:
group: 'production'
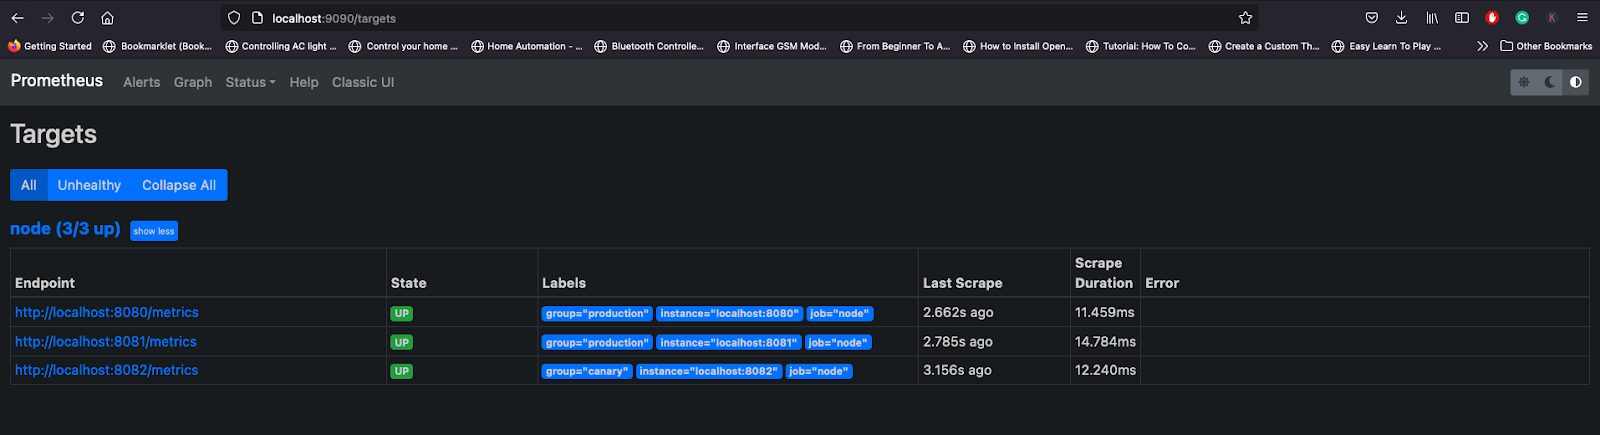
- targets: ['localhost:8082']
labels:
group: 'canary'After that, restart the Prometheus server, and you can see the targets in the Prometheus dashboard.
You can execute some expressions to visualize the metrics from targets.
Aggregating scraped data
We can achieve data aggregation by executing the expressions in the graph console, but there will be performance constraints in that execution since Prometheus stores the time-series data. Querying them by aggregating can slow the query performance over time.
To solve this bottleneck, Prometheus prerecords the data in aggregated format with a custom metric variable. Then, we can just execute that expression to visualize that aggregated data.
We can achieve this by adding custom rules in Prometheus config file. Create a custom rule file prometheus.rules.yml and add the following rules,
groups:

- name: cpu-node

  rules:

  - record: job_instance_mode:node_cpu_seconds:avg_rate5m

    expr: avg by (job, instance, mode) (rate(node_cpu_seconds_total[5m]))
After that, we need to add the custom rule in the Prometheus config file.
rule_files:

  - 'prometheus.rules.yml'
Recap
So far, we discussed Prometheus, and its history, architecture, why we need to use it, etc. To summarize, Prometheus is reliable, even when other systems have outages, so you can diagnose the problem and fix them. Furthermore, each Prometheus server doesn’t depend on additional network storage or remote services, making it standalone and self-containing. Since it’s standalone, Prometheus can work even when another part of the system is not functional.


