Best PHP Monitoring Tools on the Market
 Mukul Khanna
on
April 19, 2022
Mukul Khanna
on
April 19, 2022
As of April 2022, more than 75% of the internet comprises websites made using PHP (source). That is to say, three out of four websites on the internet have been developed using PHP! That is huge!
With that many PHP web applications on the web, there need to be systems that can automatedly keep track of how they respond to the hundreds of thousands of clients connecting worldwide. Therefore, as a PHP developer, you’d want your toolkit to include practical tools that can keep you up to speed about your applications' performance and constantly monitor potential issues that can bring the whole thing down and alert you in real-time.
In this post, we’ll talk about monitoring PHP applications — the most important metrics to watch for when evaluating performance, and the top tools in the market that can help you achieve that goal.
Here’s an outline of what we’ll be covering so you can easily navigate or skip ahead in the guide:
PHP Monitoring Metrics
‘Performance’ in the context of software development is a somewhat abstract term. It is an umbrella term for evaluating different aspects of an application’s time on the internet. So, to get a sense of how well our application is functioning, we analyze the various aspects of its performance using different metrics.
Depending on your application and organization requirements, the metrics that matter the most to your use case will differ. Therefore, it is worth going over those key performance indicators for your setting.
So, before we dive into the list of top tools for monitoring PHP applications, let’s look at the most commonly valuable metrics to watch for when understanding your application’s performance.
Availability ↑
Availability, as the name suggests, is a measure of the availability and operability of an application’s services — the percentage of time an application and all its services are available and correctly functioning. Therefore, it is usually calculated using the uptime (and downtime) of an application but can also include measures of responsiveness and the percentage of transactions completed.
Response Time ↓
Response time is the time it takes for the server to respond to a client’s request. You’ll usually find two statistics around the response time of an application –
- Mean response time: Average response time for each request (mean overall requests); the shorter, the better.
- 95th percentile response time: How much time it took for 95% of the transactions to get completed. Because we want our servers to respond in the least possible time, the closer this value is to the mean response time, the better.
Error Rate ↓
Error rate refers to the number of errors raised in your application per unit time (usually minutes). As you can imagine, this measure includes all errors introduced across all the instances of your applications running on the web.
Memory and CPU Usage ↓
As far as measuring the utilization of your hardware resources is concerned, two metrics you’ll commonly find tracked on monitoring platforms are memory consumption and CPU usage (averaged across all running nodes).
As you can imagine, the lower these values, the better. If these metrics are extraordinarily high, this might be a bottleneck you’ll want to fix first. On the other hand, if these values are surprisingly low, then that would mean your compute resources are probably overkill for your application requirements. In that case, you could benefit from downgrading your compute instances to save on cloud usage bills.
Customer Satisfaction ↑
The metrics we saw so far attempt to indirectly gauge a user's experience when visiting your website. However, some measures directly take into account customer experience. A famous customer satisfaction metric offered by monitoring tools is the ApDex score, a ratio between the number of requests completed within threshold time vs. those that took way longer. As you can see, this score is a function of the application response time.
You can read more about the ApDex score and its monitoring here.
Top PHP Monitoring Tools
Now that we have seen some of the most important metrics for measuring application performance, let’s look at the top PHP monitoring tools that help us keep track of these.
Scout APM
Scout is an Application Performance Monitoring (APM) tool that monitors your application and provides real-time alerts and insights about trends in your application’s performance.
Apart from capturing the metrics mentioned above, Scout also offers support for key performance indicators (KPIs) like deployment tracking, error monitoring, custom contexts, detailed tracing, and more.
Scout also provides insights about N+1 queries, memory bloat, slow database queries, and integrates with Github (for code-level visibility), Slack (for real-time alerts), and several other platforms.
As far as PHP frameworks are concerned, Scout seamlessly integrates with Laravel and Symfony, and provides auto-instrumentation for popular libraries like Lumen, Predis, and more. You can learn more about monitoring PHP applications with Scout here.
Xdebug
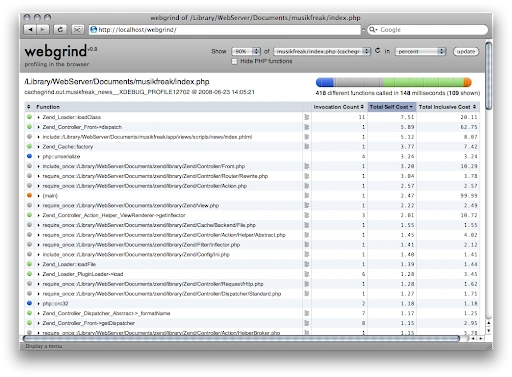
XDebug is an extremely popular free, open-source PHP extension that offers a suite of tools for developers — for debugging, error reporting, tracing, profiling, and code coverage analysis. XDebug’s in-built profiler effectively identifies function calls that slow your application down and their memory consumption.
The profiler outputs the analysis to a Cachegrind compatible file format, which can be parsed and visualized using tools such as KCacheGrind and Webgrind.

XDebug has primarily been known for its step debugger. The debugger allows you to interactively step through PHP code lines, visualize control flow, debug issues, and smoothly becomes a part of your development workflow by easily integrating with popular IDEs (like Visual Studio Code).
Additionally, XDebug’s tracing support for identifying stack traces in code also proves to be very handy for developers when debugging errors. You can learn more about XDebug’s debugger, profiler, setup instructions, features, and more here.
Loggly
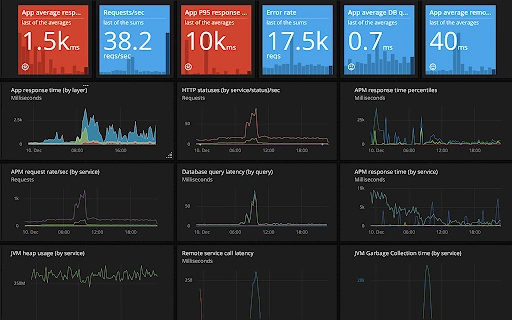
Loggly is a log management and monitoring platform for PHP applications by SolarWinds.
It aggregates logs across all your deployed servers and nodes in one place, a task otherwise very cumbersome to synchronize for distributed applications. Once collated, Loggly analyses and monitors these logs for insights and trends in application performance.

You can imagine how sifting through these unnecessarily lengthy log files and locating abnormal behavior can be a real pain. Loggly makes perusing these extensive logs effortless with an interactive search interface and a quick summary of events to highlight outliers. The sample dashboard image above also shows how neat and effective their log-analysis visualizations can gather actionable insights about application performance.
Logging and monitoring go hand in hand.
AppOptics
AppOptics is another popular APM tool that offers infrastructure health monitoring services. Like most APM tools, AppOptics offers accurately summarised metrics about your application’s performance like those we previously looked at in this post (response time, error rate, CPU usage, etc.).
On top of traditional APM features, AppOptics offers performance monitoring capabilities in pre-production settings, distributed transaction tracing, exception tracking, live code profiling, and integration with log management systems like Loggly. AppOptics also boasts a simplistic platform for their users to quickly diagnose root causes that are limiting performance, including slow database queries, high latency service calls, time-taking user-defined methods, and whatnot.
Learn more about AppOptics and their suite of monitoring services here.
New Relic One
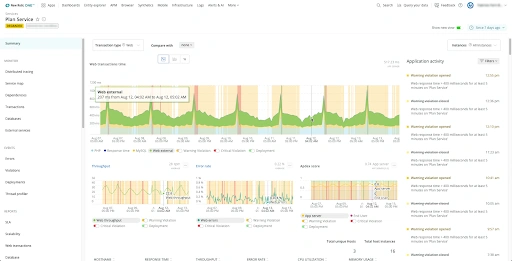
NewRelic One is an industry leader in APM platforms, recognized by Gartner for nine consecutive years. It provides a comprehensive APM platform with full-stack observability into your entire software stack in one place. Apart from offering traditional APM features, NewRelic also provides AIOps capabilities to analyze events, identify data trends, reduce alert noise, and uncover insights to boost application performance. Moreover, it also includes a free subscription plan with limited features for users who want to get a flavor of what the platform offers.
Below listed are a few of their exciting features:
- High-level application summary page
- Visualize service (architectural) maps of your application
- Key transaction tracking with contextual logs
- Custom application records querying using NRQL (New Relic Query Language)
- Custom metrics with customizable interactive dashboards for visualization
NewRelic is trusted by popular organizations such as Github, Atlassian, Epic Games, Cloudfare, and more.
Improved PHP Monitoring with Scout APM
In this post, we discussed the most valuable metrics for evaluating an application's performance. We then looked at the top 5 tools for PHP application monitoring in the wild.
Now that you have a rounded understanding of monitoring PHP applications, think about actionable insights that these tools could help you reveal about bottlenecks in your application. Rethink your application’s and organization’s performance monitoring requirements and consider investing in a reliable solution that will alert you about issues before your users catch wind of anything amiss.
Get started with Scout using a 14-day free trial (no credit card needed!) or schedule a demo with our experts today!


