Logging and Monitoring: A Match Made in Software Heaven
 Mukul Khanna
on
July 29, 2021
Mukul Khanna
on
July 29, 2021
All code and no logging makes your application a black box system. Similarly, all logging and no monitoring makes analyzing performance complicated and inconvenient.
The goal is to achieve better visibility into the operations of your application, its status, performance, and overall health. Making this information easily accessible presents more context about the critical incidents and surfaces actionable insights for optimizing performance.
While logging has numerous benefits, there’s a lot that your infrastructure could be missing out on until it’s combined with a monitoring tool. Monitoring alone isn’t the solution either; it is the complementary nature of logging and monitoring where the magic lies. This post aims to enlighten you about the virtues of logging and monitoring combined and present a glimpse of their usefulness.
Here’s an outline of what we’ll be covering so you can easily navigate or skip ahead in the guide –
- Logging
- Monitoring
- Logging vs. Monitoring
- The Synergy Between Logging and Monitoring
- Best Practices for Integrating Monitoring and Logging
- Equip Yourself with the Monitoring and Logging Tools You Need
Logging
Logging is the process of capturing information about the relevant, critical events in your application through text-based log files. If you think about your application as a factory, the equivalent of logging would be an employee documenting and recording the low-level status information of all the essential constituent operations.
“ A log file is a lot like a neglected board game covered in dust. I don’t play board games that often, but when I do, I always say, “We should do this more often.” ”
Source: Monitoring a Log File (Scout APM Blog)
How does this information help?
This data helps developers and organizations record critical information about their applications, infrastructure, and underlying components. This information not only serves as reliable documentation of the state of your application and its operations but also makes troubleshooting and debugging quick and easy.
Identifying and solving errors is an integral part of application development. It is unreasonable to expect even the most efficient and accurate code to work flawlessly all the time. Logging mechanisms enable developers to track potential errors in their applications – identify, locate, and get information about solving them.
What does this information look like?
Log files usually consist of error stack traces, timestamps, request and response payloads, time durations, custom error messages, status updates, performance metrics, other debugging cues, and lots more. This data provides fine-grained information about the triggering of relevant events throughout your application’s life cycle.
There are usually two types of logs – structured ones for machines and APIs to interpret and others intended to guide system administrators. Apart from log files, log outputs are also usually directed to databases and standard output (stdout).
Why Logging is Essential
Errors might be easier to observe and track during development – in a more controlled environment. However, things can get slightly out of hand when pushed to production – when hundreds or thousands of users interact with your application. After deploying your app instances at scale, you need proper systems to ensure that the most critical information about their functioning is output, captured, stored, and organized.
Besides, not all bugs and issues surface through user complaints. Intelligent exception handling along with well-established logging mechanisms can therefore help you pick up on error conditions that might have gone unnoticed but could have done enough damage.
Therefore, these log records serve as a window into understanding the internal mechanics of your application in terms of the situation that triggered the error, the corresponding user request, your server’s response, the program’s state, what went wrong, where it failed, etc.
However, excess of everything is bad. And therefore, it is essential to be thoughtful and systematic about your logging practices. Failure to do so can drown you into voluminous log records that can do more damage than good. Tens of thousands of log updates, all squeezed into one big file, can take you hours to locate relevant data points and impede your ability to make any meaningful inferences about application performance. It also drains your disk storage resources – leading to gigabytes of wasted storage and, therefore, increased expenditure. Being thoughtful entails ensuring that only the most critical information is captured and organizing it into different log levels and types (based on your use case) into separate files. One way of enforcing this is through organization-wide logging policies that inform developers’ logging practices.
To dive deeper into the virtues of logging systems in software development, you can check out the “The Essential Guide to PHP Error Logging” and “Node.js Logging: A How-to Guide” posts on our blog. Now let’s look at why logging, even when implemented thoughtfully, can prove to be insufficient for getting a holistic view of performance.
Why Logging isn’t Sufficient Alone
Usually, you’ll find that log files are mostly only referenced by system administrators when investigating specific incidents. They are less likely to provide big-picture insights about how your application is faring overall.
Lots of data to make sense from
Even after being thoughtful and economical in your logging implementation (as we discussed above), you could end up with tens of thousands of lines, skimming through which can be heavily time-consuming. In these large reservoirs of information, it wouldn’t be difficult to get overwhelmed and miss out on some of the critical bits that affect performance the most.
Consequently, it would also be difficult to condense all of the information into meaningful summaries that provide a comprehensive view of your application’s health. Making inferences about the development aspects to focus on for future iterations is vital here – and is one of the primary reasons for organizations to invest in these additional tools and platforms
Multiple distributed systems to track across numerous log streams
Tracking issues across hundreds or thousands of instances running at scale can lack correlation and be cumbersome. With more and more systems banking on microservice architectures these days, tracking an occurrence inside multiple log stream events across numerous services drains time, and therefore money.
Lack an alerting mechanism
According to the renowned Murphy Law, anything that can go wrong will go wrong. However, manually surveilling log files 24 x 7 for potential errors and oddities is as unrealistic and unreasonable a solution as it sounds. Regardless of whether your application is big or small, constantly being on the lookout for points of failure is implausible. You need a mechanism for being notified about these anomalies, as and when they occur before your end users can catch wind of anything.
Log records alone are equivalent to CCTV footage of security breaches. They are useless in isolation unless there’s a mechanism to bring the relevant event to the attention of the concerned parties.
For the reasons mentioned above, it wouldn’t be prudent to rely just on these logs alone for insights into performance; we need something more. This is where a need for monitoring comes into the picture. Say hello to Application Performance Monitoring!
Monitoring
Monitoring (in software terms) can take different forms, for example – web performance monitoring, business activity monitoring (BAM), application performance monitoring (APM), real user monitoring (RUM), security monitoring, network monitoring, database monitoring, and more. In this post, we are going to talk about monitoring from an application performance angle.
Monitoring enables organizations to aggregate and analyze the performance of applications through metrics that provide quantifiable data points about availability, memory consumption, response time, CPU usage, and much more. These tools constantly monitor the health of your application and are capable of alerting about these occurrences in real-time (and often even preemptively). In this regard, all monitoring tools are similar – they are on the constant lookout for anomalies, errors, and failures in the workings of a system.
As we dive deep into monitoring, I want you to (in the background) think about how monitoring fills in the holes of a logging-only setup and how both can complement each other.
How does this information help?
Application performance monitoring allows organizations to identify performance bottlenecks, memory leaks, bloat, slow database queries, and so much more. Applications like Scout APM also take this up a notch by providing a streamlined, user-friendly interface along with real-time alerts and insights to pinpoint, prioritize, and fix issues fast. Below is an example of what the user interface looks like. As you can see, this provides a much more intuitive overview of how the operations in your application are faring.
Source: https://scoutapm.com/docs/features#endpoint-details
Additionally, monitoring tools like these are super flexible in the configuration options they offer to meet your organization’s requirements regarding alert conditions, notification events, channels, etc.
What does this information look like?
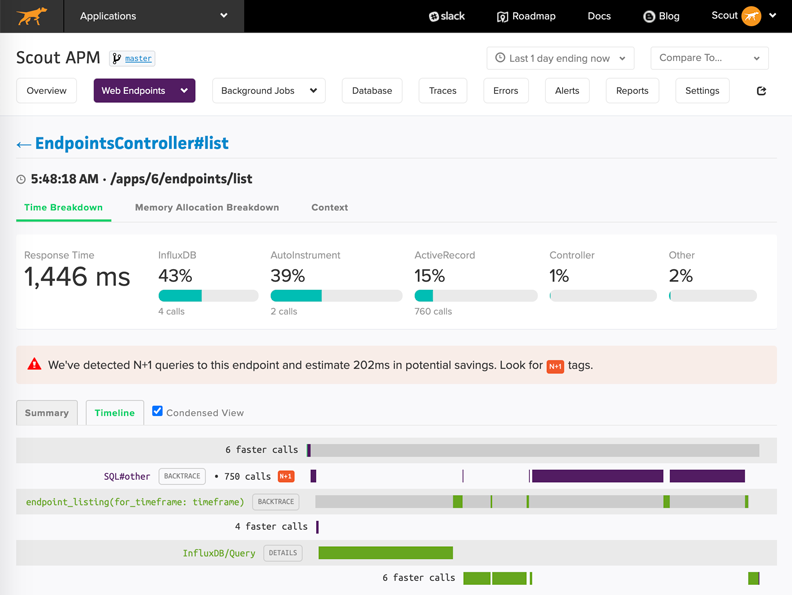
Endpoints Dashboard in Scout (Source: https://www.scoutapm.com)
Intuitive UI dashboards in Scout provide a holistic view of the different aspects of your application’s performance – from endpoints’ response rates and database queries to error reports, resource usage, user traffic, and more. This includes information like – mean and 95th percentile response time, throughput, memory allocation, slow database queries, errors per minute, code backtraces, CPU usage, CPU time, memory consumption, etc.
The image above is an example of the endpoint and controller dashboard with information about time and memory allocation breakdowns, database calls, N+1 query detection, and more.
Why Monitoring is Essential
You can imagine how this information can be beneficial in gaining insights about the distribution of user requests, your application’s response, bottlenecks in your infrastructure, specific lines of code associated with endpoints, insights about memory leak, bloat, and so much more.
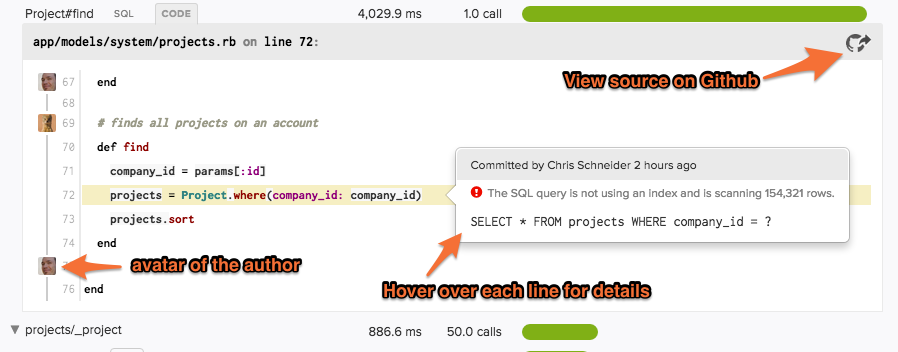
Code Backtraces in Scout APM (Source)
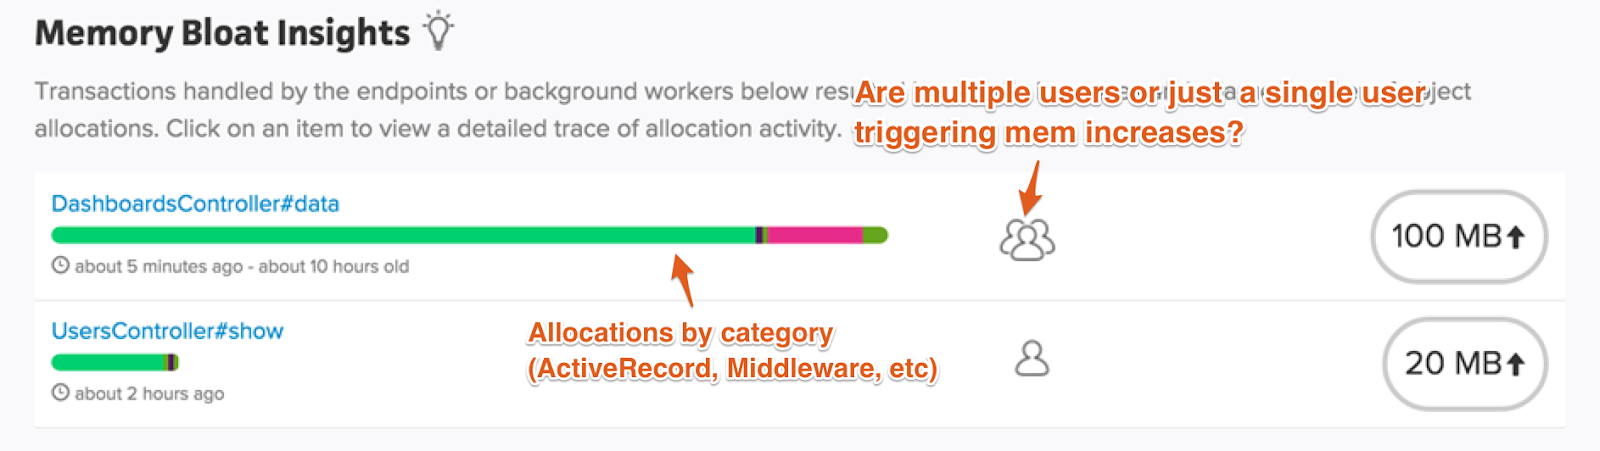
Memory Bloat Insights in Scout APM (Source)
Moreover, with real-time alerting systems built into APM tools like Scout, developers and organizations can rest assured that all potential issues will be brought to attention for implementing the required fixes before users are affected.
If you are interested in learning more about performance monitoring methods, tools, and tips, feel free to check out the “A Guide to Application Monitoring Best Practices” post on our blog!
Why Monitoring isn’t Sufficient Alone
However, just like logging, monitoring alone can’t be a cure-all solution to all your application management needs. There are parts of a software’s development life cycle where monitoring can’t replace logging.
Organizations need logs for maintaining records for ensuring compliance with security policies, regulations, and audits. They also allow diving deep into specific incidents of concern (e.g., data or security breaches) to get more fine-grained contextual information for coming up with solutions. Logging also plays a vital role in debugging during development routines.
It’s also interesting to note that much of the monitoring we have discussed so far relies upon (and is itself driven by) internal log files maintained by the monitoring tools.
Let’s revisit the security breach example we discussed above. In this case, relying on a monitoring tool alone is somewhat like having a system that can alert about a breach and the facility’s status but might not provide the detailed records (equivalent to CCTV footage) that enable us to dig deeper into the incident.
Logging vs. Monitoring
Before we talk about leveraging a union of the two methods, let’s summarize their differences.
Logging is the process of maintaining records of events relevant to the application’s working. On the other hand, monitoring is an umbrella term for different aspects of software systems that primarily refers to the continuous collection, aggregation, evaluation, and analysis of an application’s performance through established metrics.
Logging and monitoring both share the same ultimate goal – to provide a glimpse into the performance of the application’s infrastructure. Therefore, when utilized together, they can compensate for the limitations of the other and complete each other. For instance, the depths of log files and what they speak about the application’s performance can be more efficiently examined and analyzed with the help of monitoring tools to solve issues quickly. Therefore, it is safe to say that monitoring alone won’t be as effective as when combined with intelligent logging practices.
The Synergy Between Logging and Monitoring
You need a monitoring system for the higher-order bits and a logging one for lower-level information. That is to say that the former can usually help you with summarized insights and overall trends (plus an alerting mechanism), whereas the latter can help you with the fine deets of the reported incidents. Monitoring comprises the automatic security alarm, whereas the logs include the CCTV footage. You might need these two at different times, but both eventually.
Best Practices for Integrating Monitoring and Logging
Now that we have agreed that integrating logging and monitoring is beneficial let us discuss some of the best practices that can enable us to make the most of the synergy that this setup has to offer.
Best Practice #1: Don’t Try to Reinvent the Wheel
It can be uncommon to appreciate the importance of the time and effort that goes behind developing, scaling, and maintaining specialized monitoring tools. Organizations might feel keen to reinvent the wheel and build custom logging x APM solutions to give them the impression of saving costs, only to realize later how much they underestimated the resources required.
The wise thing to do here would be to stick to what your organization and your product are good at and consider delegating additional performance monitoring support to experts. Specialized tools like Scout are highly affordable and provide full-time technical support that can take care of all your monitoring needs and enable you to focus on growing your business and developing new features.
Best Practice #2: Utilize Logs for Better Monitoring
The first step of initiating this integration of logging and monitoring would be to ensure that one can benefit from another instead of working independently and trying to solve different parts of the puzzle.
The idea here is to make the most out of your log files. So instead of letting your log files just sit on your disk (or be utilized just by a logging framework), you would want to configure your monitoring tool to consume these logs for more efficient monitoring. This reduces redundancy in that the monitoring tool now need not maintain as much of its own internal logs as it otherwise would. It also provides the tool more transparency into the operations of the application and additional sources of reliable information.
This enables organizations to exploit the monitoring tool’s ability to summarize our log data in an automated fashion and provide valuable performance metrics accordingly. If your monitoring tool supports custom log files and can benefit from it, then why not?
Best Practice #3: Figure out Thoughtful Logging Strategies and Policies
We hinted at the importance of intelligent logging policies previously in the post. Logging preferences and requirements vary across applications, developers, and organizations. Hence, the higher-ups should strive to set in place strategies and policies that inform logging practices across the organization. This pre-planning brings everyone on the same page about logging priorities and ensures that only the most valuable data points are recorded, leading to concise, easy-to-navigate files.
Developers should also set up contextual and descriptive logging mechanisms in their code to provide a good overview of the occurred exception and help in drawing actionable insights. For instance, when working with HTTP endpoint controllers, there should be a focus on logging request and response parameters that can contain debugging-friendly cues about the state of the exchange.
Best Practice #4: Structure and Organize your Data
Once your organization has established relevant logging strategies for your infrastructure, the next step would be to plan the structuring and organization of your log records.
Organized log records pay considerable dividends in the long run. It might seem less important at first, but the more time spent planning, the less time and effort it’ll take in the future to navigate log files and locate helpful information. Below are some pointers to consider when managing your logs.
- Estimate required storage: Log files might seem innocuous in size at first but can quickly grow exponentially to consume even gigabytes of disk storage.
- Log levels: Logging functions in most programming languages offer support for categorizing logs into different levels (e.g., info, update, warning, error, debug, etc.). These levels help in segregating records based on their importance for your application. For instance, you wouldn’t want your sizeable debug logs to merge with your production error logs at any cost.
- Tagging your logs: Adding tags allows even more flexible and customized categorizing of log records for easy maintenance in the future.
- Structured log data: Following fixed structures (e.g., classes and objects) for your logs make it machine-readable, easier to index, maintain, and extend.
- Formatting patterns: Consistent formatting patterns for log strings allows for uniformity in appearance across log files. This eventually helps with easier location and identification of critical data points.
Best Practice #5: Compatibility, APIs, and Plugins for Extended Use Cases
One of the more obvious yet noteworthy points to keep in mind would be to ensure the compatibility of your stack and your programming languages with the set of logging and monitoring tools you plan to invest in.
Additionally, tools and platforms that provide APIs, plugins, and other interfaces to extend their services can prove to be quite helpful. This flexibility to do more with your data for implementing custom use cases (instead of letting the data rest and help no one) proves to be a boon for developers. This extensibility can also present itself through integrations with other tools and services, leading to a richer, more cross-compatible experience.
Equip Yourself with the Monitoring and Logging Tools You Need
Ultimately, the goal is to achieve more transparency and a better understanding of the workings of your application and its infrastructure. As we discussed, logging and monitoring both play crucial roles in helping organizations discover insights about the performance and enable more efficient decision-making. However, when used in conjunction, they take things up a notch and can be greater than the sum of their parts.
Now that you hopefully agree with the advantages of logging and monitoring think about the systems you have in place to evaluate your applications’ performance. Examine your logging practices and your monitoring requirements, equip yourself with the monitoring and logging tools you need, and consider incorporating the tips we discussed above into your projects.
For more in-depth content around software development, web programming, and insights about optimizing your application’s performance, check out our blog. To know more about how you can up your monitoring game, check out Scout APM by getting started with a 14-day free trial.


