Pillars of the Rails Monitoring Stack: 2020 Edition
Choosing a technical stack for your application is a complex task. We get it. But what often goes unnoticed is the complexity in choosing a perfect monitoring stack. Let’s face it - you can not run an application rolled out to a huge number of users without putting in trackers to monitor your app’s performance, usage, and reception by users. Just like marketing analytics, technical analytics is crucial in a product’s road to success. Let’s take a look at the ideal monitoring stack for Rails applications in 2020.
Feel free to navigate around the piece with these links:
Before you go ahead, here’s a glance at the services we use here at Scout to ensure that we have full knowledge of how our application is performing:
| Focus | Service | Approx. Price |
|---|---|---|
| Uptime | Pingdom | $10/mo |
| App Monitoring | Scout | $129/mo |
| Log Monitoring | ELK Stack | $150/mo |
| Server & Service Monitoring Custom Metrics |
Pingdom Server Monitor | $200/mo |
| Exception Monitoring | Sentry | $26/mo |
| Scheduled Job Monitoring | Deadman's Snitch | $5/mo |
Stop searching for a single tool
Monitoring is a wide task. There are simply way too many metrics to manage, and they are diverse enough to not be monitored via a single tool. So if you’re looking for a ‘one size fits all’ kind of solution, you’re only going to be disappointed.
However, there’s a pretty good number of best-of-breed services that play well together to give you great monitoring coverage of your Rails apps and infrastructure.
When picking out a monitoring solution, you typically have two options to choose from:
- Open-source
- SaaS
On the one hand, open-source is free to install and customizable, on the other hand, it is generally more difficult to use and fairly complex to maintain. Most of the monitoring services are generally Saas. The open-source alternatives are typically used when the paid, hosted options are significantly cost-prohibitive. Monitoring software is complicated and keeping your stack running can be a time-sink. The last thing one wants is unreliable software monitoring one’s apps.
Covering your Blind Spots
While there might be an endless sea of metrics and parameters to observe, we are going to restrict ourselves to these primary areas:
- Uptime - are key controller-actions reachable from around the globe?
- Application Monitoring - when performance goes bad, dive to the line-of-code causing the issue.
- Log Monitoring - aggregate logs across app servers.
- Server & Service Monitoring - server resource usage and ensuring services are running as expected.
- Exception Monitoring - aggregate, view, and close exceptions.
- Custom Metrics - track key performance indicators that are specific to your app.
- Scheduled Job Monitoring - ensure jobs that are scheduled to run.
Let’s analyze each of these in detail.
Uptime Monitoring
This is the basic building block of monitoring. Whether you are hosting a personal blog or on the stability team for Facebook, you need this. Uptime monitoring tells you if your app is down, but no details beyond that. It is measured in percentages, a higher value representing a higher uptime availability. Generally, a mark of 99.999% uptime means that your website was down for less than 5 minutes throughout the year, and is considered a good benchmark.
Open Source
While there are quite a few open-source tools available for uptime monitoring, they are not worth mentioning unless you’re willing to set up your infrastructure distributed geographically. In this case, paid options are very affordable.
Paid
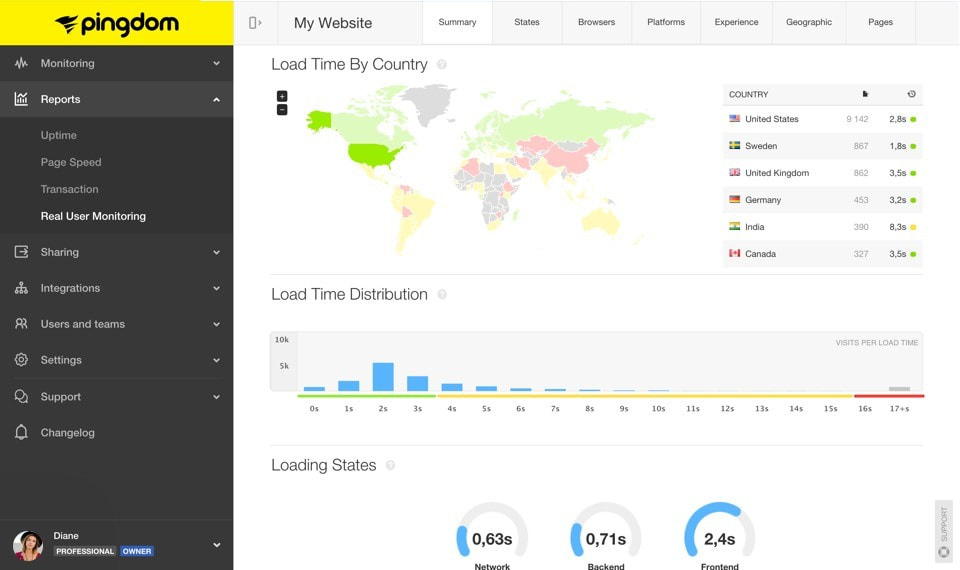
Pingdom has been the leader in this domain hands down for a long time. Even in 2020, it continues to do so. Starting from as low as $10 per month for 10 checks, Pingdom is affordable as well as a breeze to use. The UI is a bit heavyweight for a general uptime monitoring routine, but the service has been very reliable over the years. Even though there are a lot of options available, swapping Pingdom for anything else is still a very tough call.
Implementation Notes
We generally check two primary controller-actions in each of our Rails apps:
- General health-check (run a query against each of our database systems)
- Test our metric checking endpoint with a fake payload
Application Monitoring
If you’re looking to gain an in-depth understanding of where the time goes in your application, the best way to go is to set up an application performance monitoring solution. APMs give you the most value with the least effort.
Application monitoring is the ability to point to a line-of-code where there is a performance problem. While a lot of tools count themselves as application monitoring tools, they are not one unless they satisfy the above definition.
Open Source
There are quite a few open source solutions for Rails app monitoring, but they are not as widely adopted when compared to the paid services. If you’re still looking for one, Apache SkyWalking might be just a fit for you. With over 15k stars on GitHub, SkyWalking can easily be crowned the leader of open source application monitoring solutions.
We believe that application monitoring is one of the most important aspects of a Rails monitoring stack, so choosing a paid service makes much more sense than an open-source one.
Paid
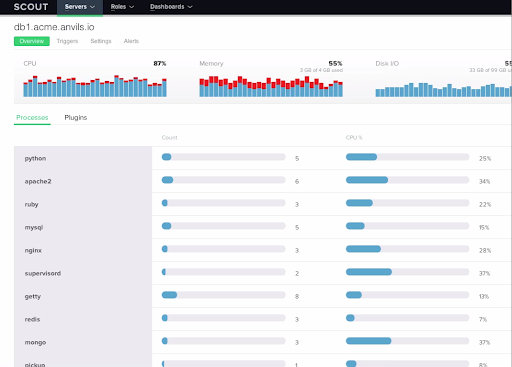
As obvious as it can be, we recommend our solution (Scout) for APM tasks. Scout provides you with, in our own words, “streamlined performance insights that get you back to coding faster”. Scout tracks down prominent issues like N+1 queries, memory bloat, slow database queries, and much more.
Another good option is New Relic. They offer many features, including real user monitoring, architecture mapping, and much more.
Implementation Notes
On larger teams, this is typically most used by developers as it ties directly to the code they have written. Folks on the DevOps side are more concerned with higher-level performance metrics than application code.
Choosing between Scout and New Relic?
Scout digs through performance data for you, identifying slow database queries, N+1s, sources of memory, and more. It's a jobs-to-be-done approach to monitoring.
Log Monitoring
Logging is the process of recording log messages, for operating systems and their applications. Narrowing it down, application logging is focused on recording events that occur inside an application. They give a developer/manager an insight into how the application is being utilized by its users.
In most modern setups, you are likely using multiple application servers served behind a load balancer. This means if there is an issue you need to track down, you'd need to find it on the right server. To solve this problem, send your logs to a central service.
Also, log monitoring is a very frequently used aspect in the rails monitoring stack, so it is more favorable to go ahead with an open-source solution than with a paid service.
Open Source
The ELK stack, offered by Elastic, is a strong open-source alternative for a complete log monitoring solution. It consists of Elastic Search, LogStash, and Kibana.
Paid
A few great log monitoring services include Splunk and Papertrail. In recent times, Loggly has also turned out to be a good alternative.
Implementation Notes
Both developers and the DevOps team will likely use this tool, so both must be comfortable with it. Our customers tell us Papertrail is the easiest option if you're getting going with log monitoring.
We use the Lograge gem in our Rails apps to generate more readable, structured log files.
Server & Service Monitoring
It is important to ensure the servers hosting your app and the services running on them are behaving well. Server monitoring typically aims at monitoring and tracking a server’s system resources, such as CPU usage, memory utilization, I/O routines, and much more.
Service monitoring talks about a bigger picture - ensuring that your application is performing well as a collective bunch of servers and resources. There are a number of options in the server monitoring space - probably more than any other area.
Common use cases of server monitoring:
- Correlate database disk utilization against Apache response times
- Ensure replication is running between database servers
- Track Apache/Nginx throughput and response times
Open Source
The best open source tool till today for server monitoring is Nagios. However, it is one of the most complex tools to setup as well.
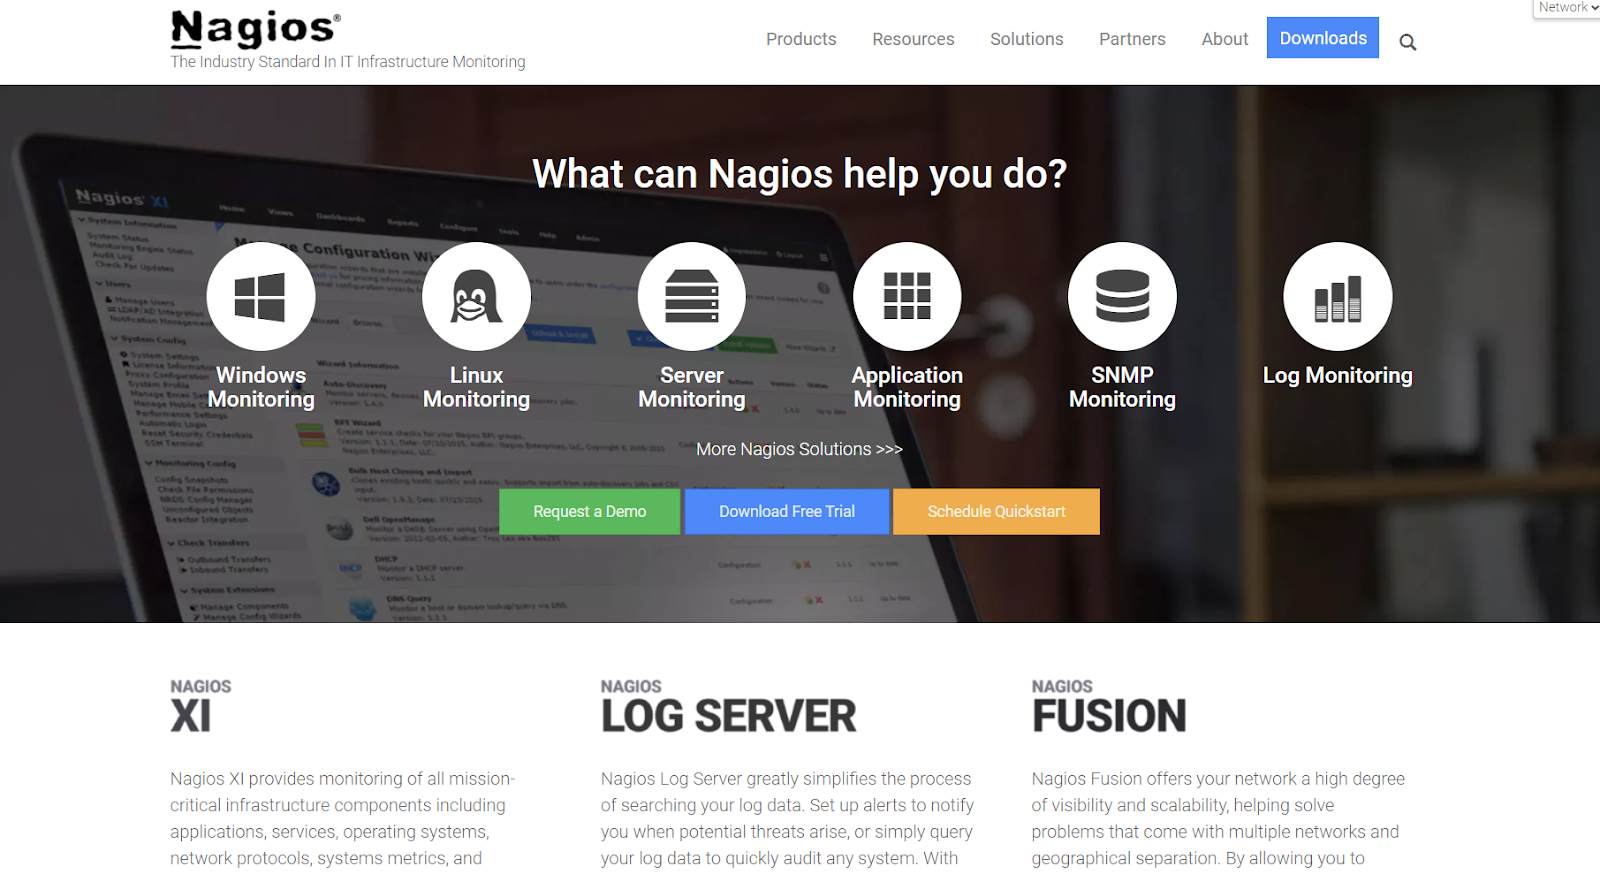
If you’re looking to try out something different, you can also consider exploring Zabbix and Sensu.
Paid
Paid services often combine a couple of useful services. For example, when you use Pingdom Server Monitor, you also get StatsD and AWS monitoring. For many open source tools, you need to combine several unrelated pieces of software to do charts, monitoring, alerting, and custom metrics. This makes monitoring more brittle.
Besides Pingdom Server Monitor, Datadog is another common option. Pricing is around $15/server/mo.
Implementation Notes
On larger teams, this is most frequently used by DevOps. For smaller teams, your developers must be comfortable with the server monitoring tool as well (some server monitoring tools have very poor user experiences).
Exception Monitoring
Exception monitoring tools make it easy to track exceptions down to a line-of-code, saving you valuable development time hunting down bugs. They also aggregate similar errors together to decrease noise when things are going wrong. If you have an application that is updated frequently, setting up exception monitoring is a must, as bugs are bound to creep in in your application.
Open Source
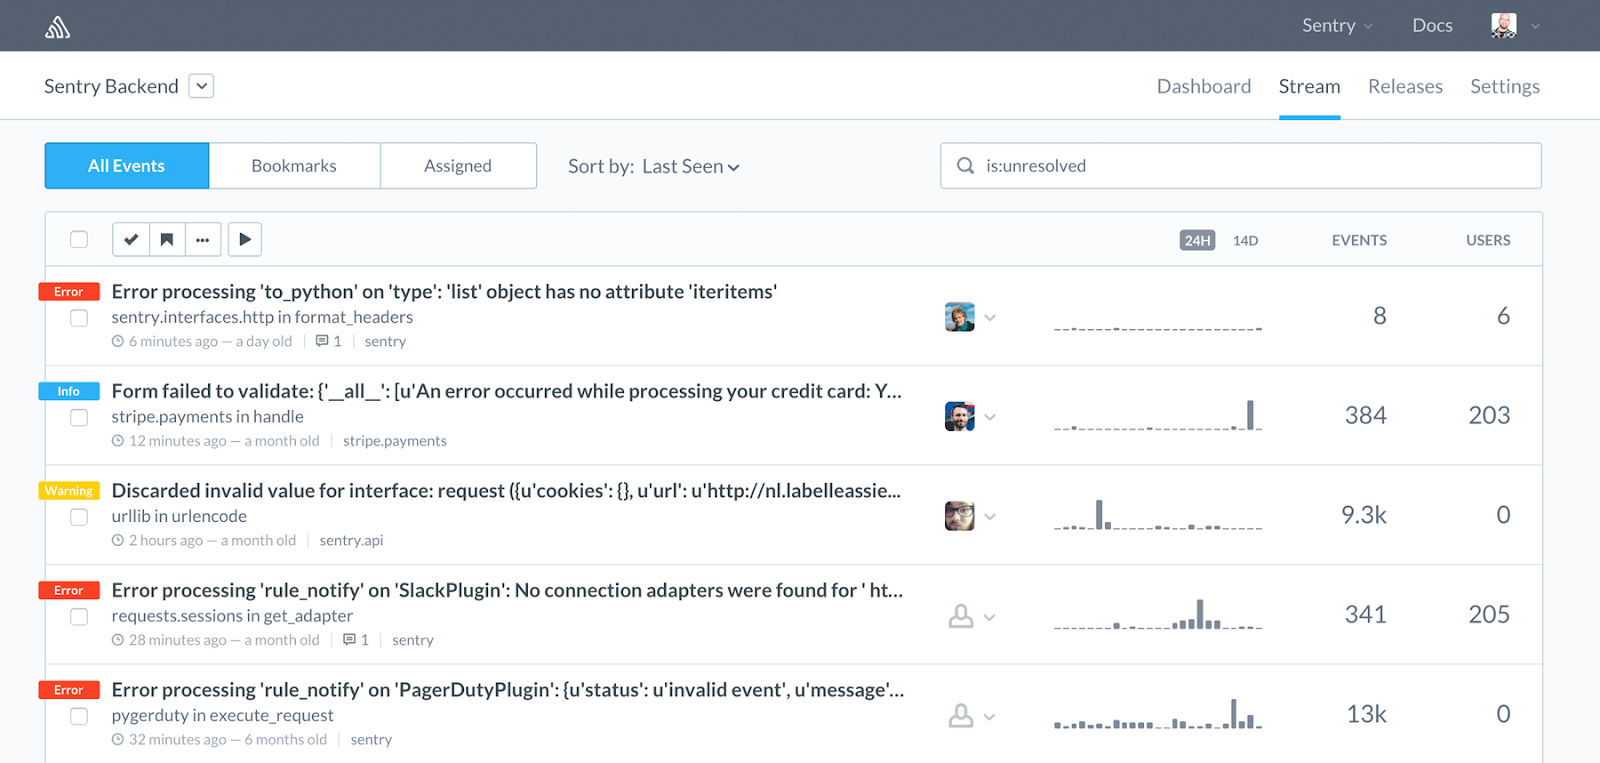
Sentry is a top-performing tool in this domain, with a free as well as a paid tool available. Sentry is known to provide a well-consolidated report of bugs and warnings, which make it super simple to navigate around and fix.
You can also just use the Exception Notification Gem to notify you of exceptions via email. This doesn't scale well: you'll be overwhelmed with emails during peak outage periods (like a database server going offline).
Paid
As mentioned earlier, Sentry fits our purpose well here. There are several other options including Rollbar and Airbrake. These services allow you to collect exceptions from a variety of languages and frameworks.
Scout also integrates with Sentry and Rollbar, providing a single view of your app health:
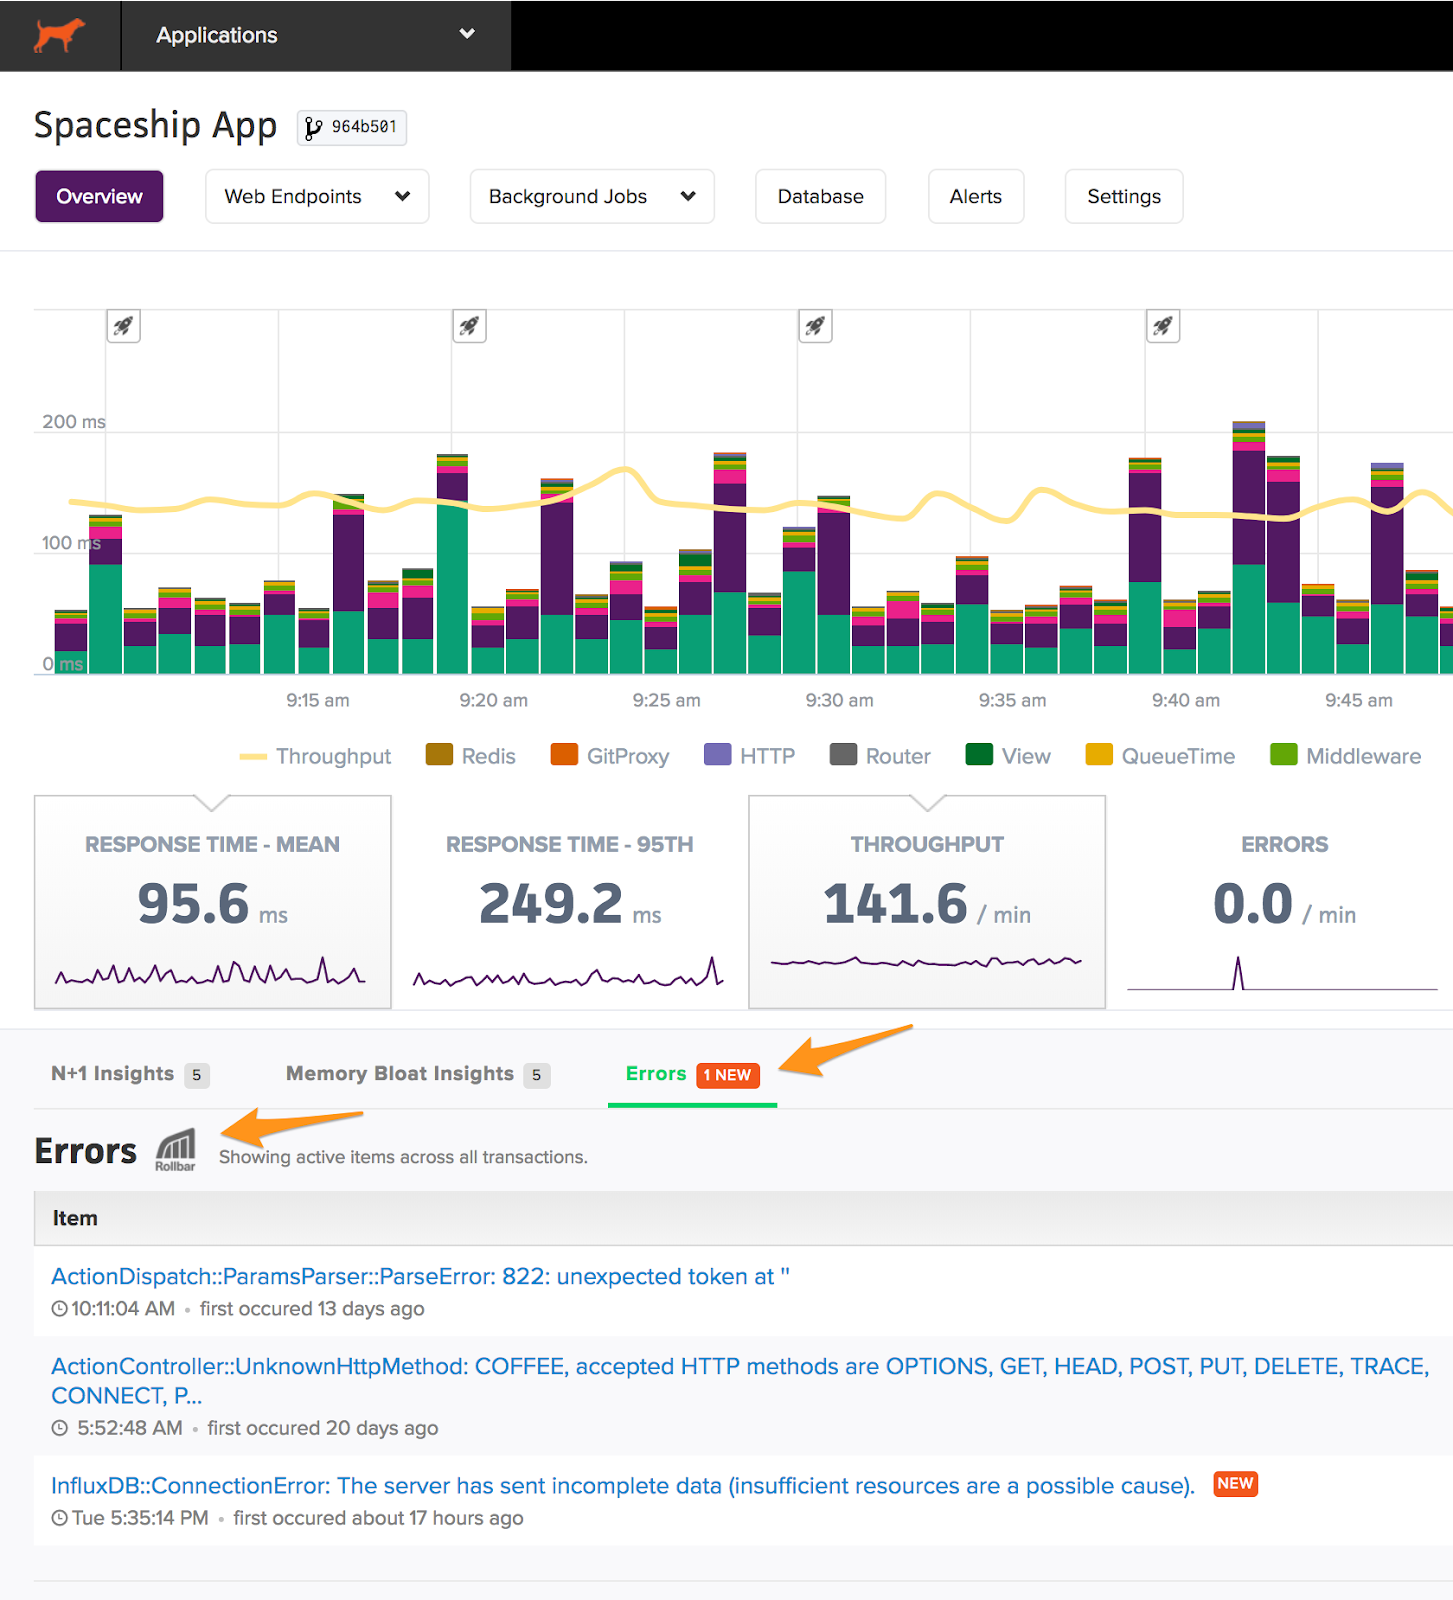
Pricing starts around $30/mo.
Implementation Notes
We classify exceptions into 2 areas:
- Bugs in code that need to be fixed (this is where Sentry, Rollbar, etc) are most useful.
- Transient errors that can occur but are typically only problems if they occur at a high rate and/or over an extended period (ex: database timeout errors).
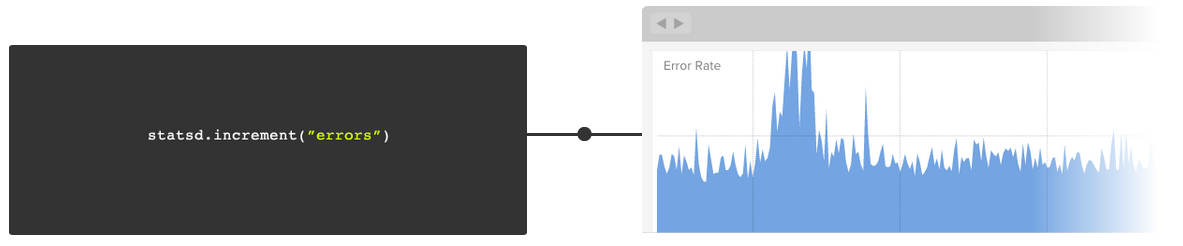
For tracking and analyzing the second type of exception, we use StatsD (explained below in Custom Metrics) and set alerting thresholds on error rates.
Custom Metrics
Every app has key indicators that ensure things are working. For example, with Scout, we monitor the number of active servers and watch for large drops. These can indicate network issues between a customer's data center and ours.
StatsD is a terrific, lightweight tool for custom metrics. It allows you to send aggregate metrics data over to your backend service. So, if you are logging numbers, it often makes sense to put those numbers into StatsD.
Open Source
Graphite is an excellent, standard dashboard solution that can accept StatsD metrics. The only downside to it is that alerting is not available.
Paid
Both Pingdom Server Monitor's and Datadog's monitoring agents accept StatsD metrics - this allows you to view as well as receive alerts on most of your metrics (server, services, and StatsD) from a single service.
Librato is a more general hosted metrics service.
Implementation Notes
StatsD is a lightweight protocol (can even report metrics via bash), so you'll have universal support for custom metrics across languages and frameworks.
Scheduled Jobs Monitoring
An application can consist of several scheduled jobs, which may be crucial to its functioning. Therefore it is important to ensure that these jobs are being executed according to their schedules. This is where the scheduled jobs monitoring tools help. They keep track of all of your application’s scheduled jobs and report whenever there is an issue.
Open Source
There don’t seem to be too many viable open source solutions for Scheduled Jobs Monitoring. This again might be due to the unneeded overhead of infrastructure setup in a custom, open-source deployment of such a tool. However, affordable paid options are available, starting at $5 per month.
Paid
If you’re looking to try this out, HealthChecks.io has a hobbyist pricing plan that offers a generous amount of usage at no cost. For a more serious consumption routine, Deadman’s Snitch and Cronhub have plans starting as low as $5 per month.
TL;DR:
Here's our current monitoring stack at Scout entering 2021:
- Uptime - Pingdom
- Application Monitoring - Scout
- Log Monitoring - ELK Stack
- Server & Service Monitoring - Pingdom Server Monitor
- Exception Monitoring - Sentry
- Custom Metrics - Pingdom Server Monitor
- Scheduled Job Monitoring - Deadman's Snitch
Questions? Suggestions?
We're happy to share more details. Ping us at support@scoutapm.com. Share your suggestions in the comments below.