Elixir Features
Deploy Tracking
Scout can track deploys, making it easier to correlate changes in your app to performance. To enable deploy tracking, first ensure you are on the latest version of scout_apm. See our upgrade instructions.
Scout identifies deploys via the following:
- A
revision_shaconfig setting. - A
SCOUT_REVISION_SHAenvironment variable equal to the SHA of your latest release. - If you are using Heroku, enable Dyno Metadata. This adds a
HEROKU_SLUG_COMMITenvironment variable to your dynos, which Scout then associates with deploys.
Request Queuing
Our Elixir integration can measure the time it takes a request to reach your application from farther upstream (a load balancer or web server). This appears in Scout as “Request Queueing” and provides an indication of your application’s capacity. Large request queueing time is an indication that your app needs more capacity.
Please view request queueing section to learn how to get these insights.
Note: For Elixir, we currently only support the following two headers: x-queue-start and x-request-start, and we don’t support msec – or decimal millisecond. Example of valid header:
x-request-start: "1234567890123"
Custom Context
Context lets you see the forest from the trees. For example, you can add custom context to answer critical questions like:
- How many users are impacted by slow requests?
- How many trial customers are impacted by slow requests?
- How much of an impact are slow requests having on our highest paying customers? It’s simple to add custom context to your app. There are two types of context:
User Context
For context used to identify users (ex: id):
ScoutApm.add_user(key, value)
Examples:
ScoutApm.Context.add_user(:id, user.id)
General Context
ScoutApm.Context.add(key, value)
Examples:
ScoutApm.Context.add(:account, account.id)
ScoutApm.Context.add(:monthly_spend, account.monthly_spend)
Default Context
Scout reports the Request URI and the user’s remote IP Address by default.
Context Value Types Context values can be any of the following types:
- Printable strings (
String/printable?/1returnstrue) * Boolean * Number
Context Key Restrictions
Context keys can be an Atom or String with only printable characters.
Custom context keys may contain alphanumeric characters, dashes, and underscores. Spaces are not allowed. Attempts to add invalid context will be ignored.
PII
To best help protect you data, we suggest using ids instead of explicit names and emails
Custom Instrumentation
You can extend Scout to record additional types of transactions (background jobs, for example) and time the execution of code that fall outside our auto instrumentation.
For full details on instrumentation functions, see our ScoutApm. Tracing Hex docs.
Transactions & Timing
Scout’s instrumentation is divided into 2 areas:
1.
Transactions: these wrap around a flow of work, like a web request or a GenServer call. The UI groups data under transactions. Use the deftransaction/2 macro or wrap blocks of code with the transaction/4 macro.
2.
Timing: these measure individual pieces of work, like an HTTP request to an outside service or an Ecto query, and displays timing information within a transaction trace. Use the deftiming/2 macro or the timing/4 macro.
Instrumenting transactions
deftransaction Macro Example
Replace your function def with deftransaction to instrument it.
You can override the name and type by setting the @transaction_opts attribute right before the function.
defmodule YourApp.Web.RoomChannel do
use Phoenix.Channel import ScoutApm.Tracing

# Will appear under "Web" in the UI, named "YourApp.Web.RoomChannel.join".
@transaction_opts [type: "web"]
deftransaction join("topic:html", _message, socket) do
  {:ok, socket}
end

# Will appear under "Background Jobs" in the UI, named "RoomChannel.ping".
@transaction_opts [type: "background", name: "RoomChannel.ping"]
deftransaction handle_in("ping", %{"body" => body}, socket) do
  broadcast! socket, "new_msg", %{body: body} {:noreply, socket}
end
transaction/4 Example
Wrap the block of code you’d like to instrument with transaction/4:
import ScoutApm.Tracking def
  do_async_work do Task.start(fn ->
    # Will appear under "Background Jobs" in the UI, named "Do Work".
    transaction(:background, "Do Work") do
      # Do work...
    end
  end)
end
See the ScoutApm.Tracing Hexdocs for details on instrumenting transactions.
Timing functions and blocks of code
deftiming Macro Example
Replace your function def with deftiming to instrument it. You can override the name and category by setting the @timing_opts attribute right before the function.
defmodule Searcher do
 import ScoutApm.Tracing

 # Time associated with this function will appear under "Hound" in timeseries charts.
 # The function will appear as `Hound/open_search` in transaction traces.
 @timing_opts [category: "Hound"] deftiming open_search(url) do
  navigate_to(url)
 end

 # Time associated with this function will appear under "Hound" in timeseries charts.
 # The function will appear as `Hound/homepage` in transaction traces.

 @timing_opts [category: "Hound", name: "homepage"]
 deftiming open_homepage(url) do
   navigate_to(url)
end
timing/4 Example
Wrap the block of code you’d like to instrument with timing/4:
defmodule PhoenixApp.PageController do
use PhoenixApp.Web, :controller import ScoutApm.Tracing
def index(conn, _params) do
  timing("Timer", "sleep") do
    :timer.sleep(3000)
  end
  render conn, "index.html"
end
See the ScoutApm.Tracing Hexdocs for details on timing functions and blocks of code. #### Limits on category arity We limit the number of unique categories that can be instrumented. Tracking too many unique category can impact the performance of our UI. Do not dynamically generate categories in your instrumentation (ie timing("user_#{user.id}", "generate", do: do_work()) as this can quickly exceed our rate limits.
Adding a description
Call ScoutApm.Tracing.update_desc/1 to add relevant information to the instrumented item. This description is then viewable in traces. An example:
timing("HTTP", "GitHub_Avatar") do
  url = "https://github.com/#{user.id}.png"
  update_desc("GET #{url}")
  HTTPoison.get(url)
end
Tracking
Already executed time Libraries like Ecto log details on executed queries. This includes timing information. To add a trace item for this, use ScoutApm.Tracing.track.
An example:
defmodule YourApp.Mongo.Repo do
  use Ecto.Repo # Scout instrumentation of Mongo queries. These appear in traces as "Ecto/Read", "Ecto/Write", etc.

  def log(entry) do
    ScoutApm.Tracing.track( "Ecto", query_name(entry), entry.query_time, :microseconds )
    super entry
  end
end
In the example above, the metric will appear in traces as Ecto/#{query_time(entry)}. On timeseries charts, the time will be allocated to Ecto. See the scout_apm hex docs for more information on track/.
Error Monitoring
Scout automatically captures unhandled exceptions in your Phoenix application. See the dedicated Elixir Error Monitoring page for setup instructions, configuration options, and custom error reporting.
Log Management
Scout can forward your application logs for centralized search and analysis. See the dedicated Elixir Log Management page for setup instructions, configuration options, and details on how it works.
External Services
Scout automatically tracks outbound HTTP calls as “External Services”, giving you visibility into time spent calling third-party APIs and services. HTTP clients are instrumented via :telemetry.
Finch / Req
Finch instrumentation also covers libraries built on top of Finch, including Req.
Attach the handler in your Application.start/2:
def start(_type, _args) do
  ScoutApm.Instruments.FinchTelemetry.attach()
  # ...
end
No other changes are needed. All Finch HTTP requests will automatically appear as External Service spans in Scout.
Tesla
Tesla requires the Tesla.Middleware.Telemetry middleware to be included in your client:
defmodule MyApp.ApiClient do
  use Tesla

  plug Tesla.Middleware.Telemetry
  plug Tesla.Middleware.BaseUrl, "https://api.example.com"
  # ... other middleware
end
Then attach the handler in your Application.start/2:
def start(_type, _args) do
  ScoutApm.Instruments.TeslaTelemetry.attach()
  # ...
end
What’s Tracked
For both Finch and Tesla:
- Operation:
HTTP/{method}(e.g., “HTTP/GET”, “HTTP/POST”) - URL: The request URL (query strings are stripped to avoid leaking sensitive data)
- Status Code: The HTTP response status code
- Duration: Total request time
Requests to Scout APM’s own endpoints are automatically excluded.
LiveView Instrumentation
Scout automatically instruments Phoenix LiveView lifecycle callbacks via :telemetry.
Setup
Attach the handler in your Application.start/2:
def start(_type, _args) do
  ScoutApm.Instruments.LiveViewTelemetry.attach()
  # ...
end
What’s Tracked
- mount — Tracked as LiveView transactions
- handle_event — Tracked as timed layers within transactions
- handle_params — Tracked as timed layers within transactions
LiveView modules are automatically named based on the module name.
Oban Instrumentation
Scout automatically instruments Oban background job execution via :telemetry.
Setup
Attach the handler in your Application.start/2:
def start(_type, _args) do
  ScoutApm.Instruments.ObanTelemetry.attach()
  # ...
end
Jobs appear as Job type background transactions in Scout. Job names are derived from the worker module — for example, MyApp.Workers.SendEmail becomes Job/SendEmail.
HEEx Template Instrumentation
Scout can instrument HEEx template rendering (Phoenix 1.6+) for visibility into template performance.
Setup
Add the HEEx engine to your template engines configuration in config/config.exs:
config :phoenix, :template_engines,
  eex: ScoutApm.Instruments.EExEngine,
  exs: ScoutApm.Instruments.ExsEngine,
  heex: ScoutApm.Instruments.HEExEngine
This requires phoenix_live_view to be a dependency in your project. No other setup is needed — HEEx templates will automatically appear as Template/Render spans in traces.
Database Metrics
Ecto instrumentation now automatically captures additional database metrics:
db.command— The SQL command type (e.g., SELECT, INSERT, UPDATE, DELETE)db.rows— The number of rows returned or affected
These are captured automatically with no additional setup beyond the standard Ecto instrumentation.
Server Timing
View performance metrics (time spent in Controller, Ecto, etc) for each of your app’s requests in Chrome’s Developer tools with the plug_server_timing package. Production-safe.
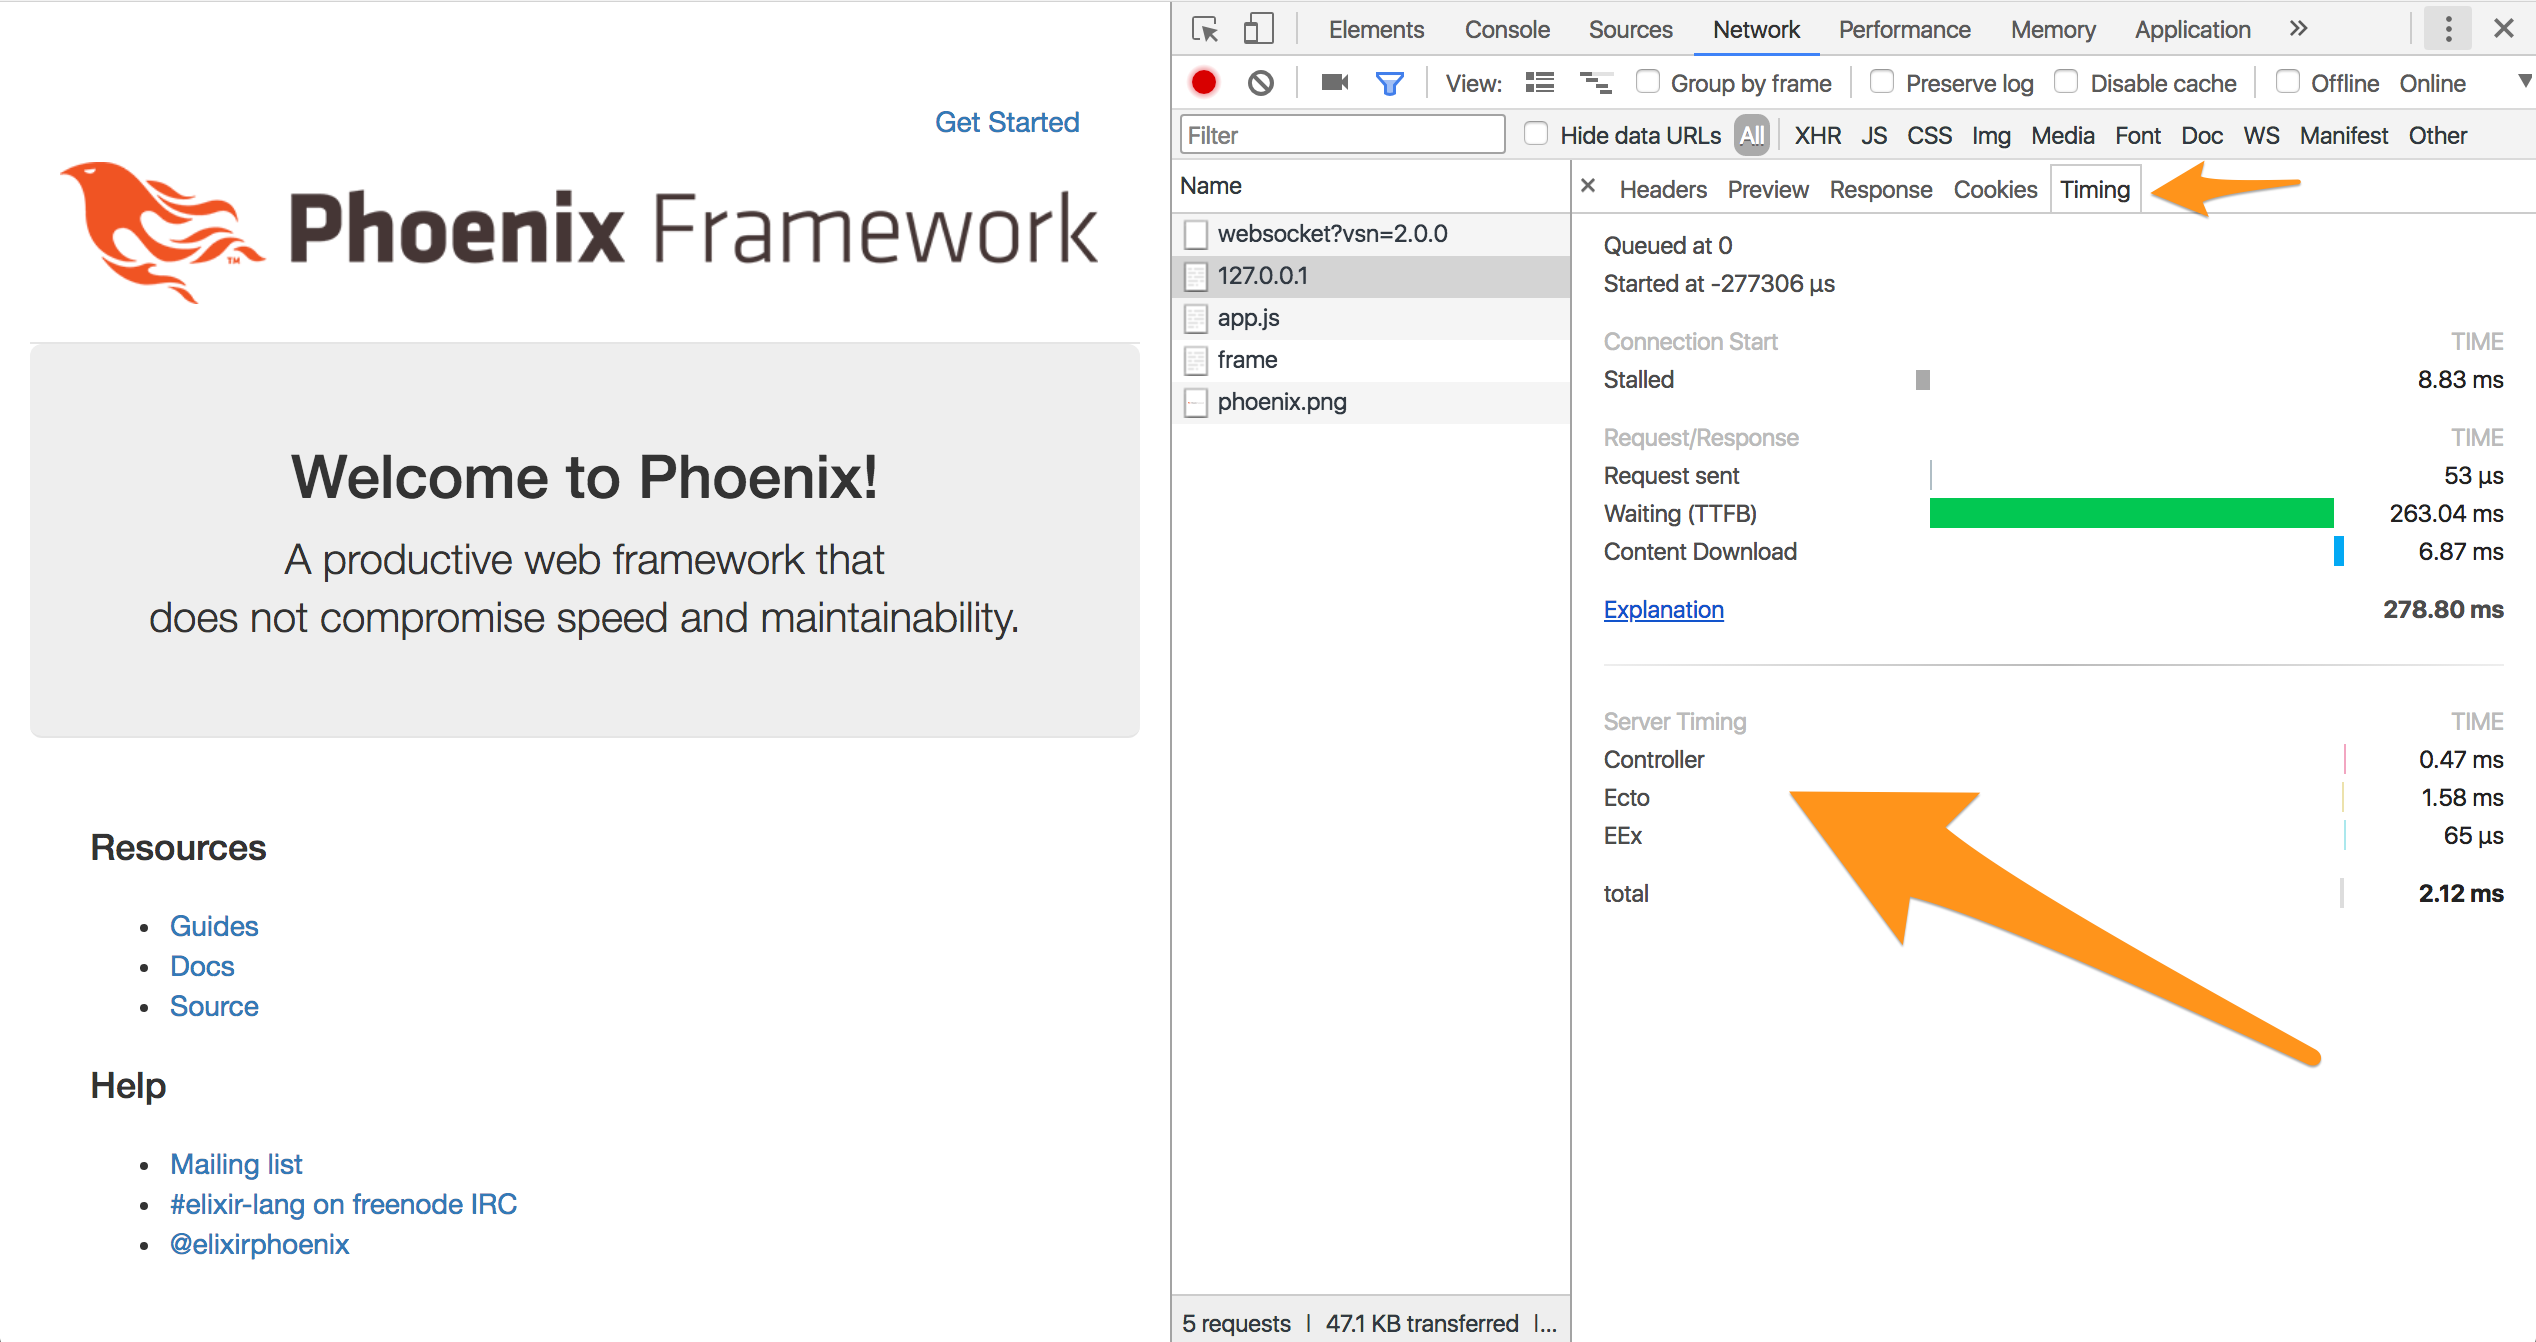
For install instructions and configuration options, see plug_server_timing on GitHub.
ARM Support
ARM and graviton Support
We now have support for ARM and graviton.
- Our Elixir agent does not automatically detect ARM support, currently
- To explicitly connect, the core_agent_triple configuration setting must be specified.
