Insights
Scout automatically surfaces your new n+1, slow query and memory bloat insights.
N+1
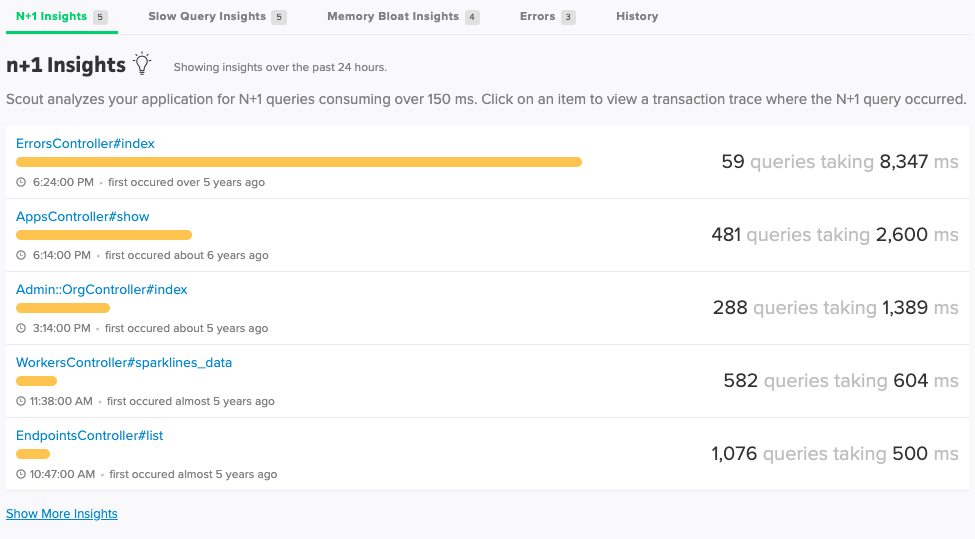
An N+1 query is a database query pattern where N individual queries are executed to retrieve related data, as opposed to a single query, resulting in a total of N+1 queries.
Scout analyzes your traces and shows you the trace that we have found to contain N+1s that have an impact on the user’s experience:
Memory Bloat
If a user triggers a request to your Rails application that results in a large number of object allocations (example: loading a large number of ActiveRecord objects), your app may require additional memory. The additional memory required to load the objects in memory is released back very slowly. Therefore, a single memory-hungry request will have a long-term impact on your Rails app’s memory usage.
There are 3 specific features of Scout to aid in fixing memory bloat.
The Insights area of the dashboard identifies controller-actions and background jobs that have triggered significant memory increases. An overview of the object allocation breakdown by tier (ActiveRecord, ActionView, etc) is displayed on the dashboard.

Slow Query Insights
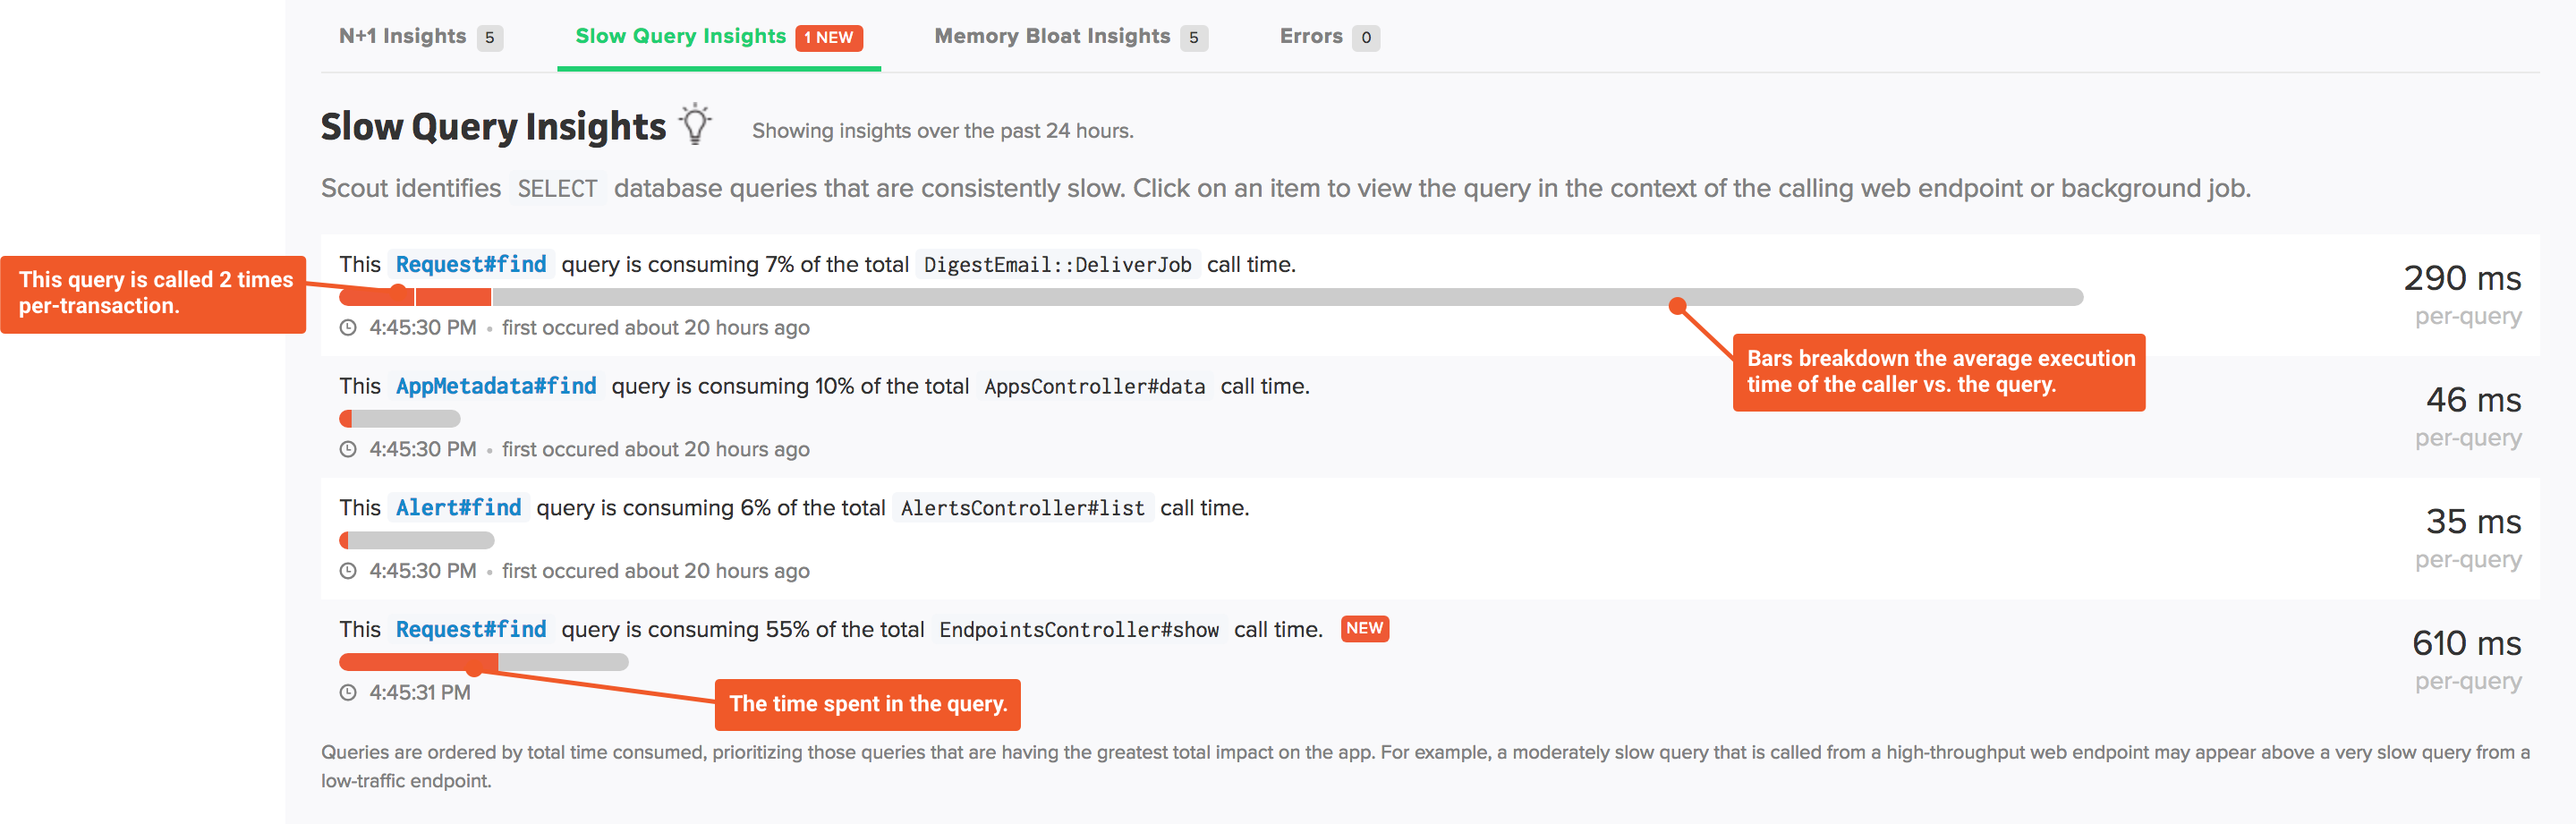
This insight analyzes your queries in three dimensions, helping you focus on database optimizations that will most improve your app:
- Which queries are most impacting app performance? This is based on the total time consumed of each query, where time consumed is the average query latency multiplied by the query throughput.
- Which queries are significant bottlenecks inside web endpoints and background jobs? A single query that is responsible for a large percentage of the time spent in a transaction is a great place to investigate for a performance win.
- Which queries are consistently slow? These are queries that have a high average latency.
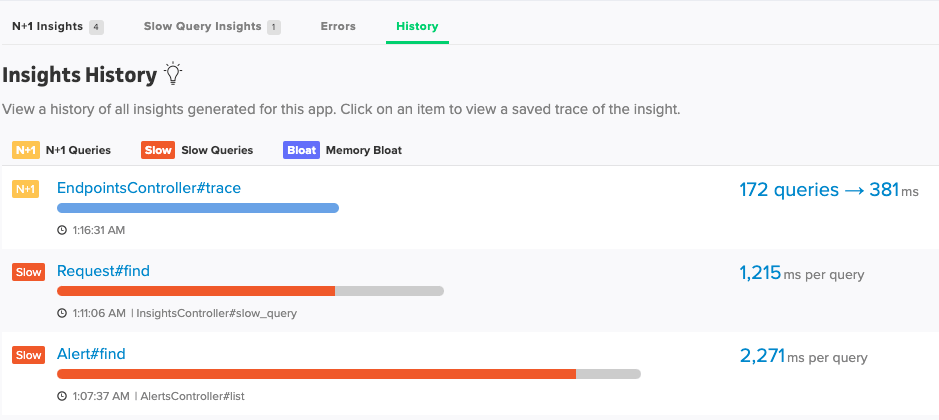
History
In addition to the memory bloat insights, you will be able to view past memory bloat, slow query (if enabled), and N+1 insights. These insights will have a saved trace with them, and these trace have a longer retention period than our normal traces do.