Ruby Features
Deploy Tracking
Scout can track deploys, making it easier to correlate changes in your app to performance. To enable deploy tracking, first ensure you are on the latest version of scout_apm. See our upgrade instructions.
Scout identifies deploys via the following:
- If you are using Capistrano, no extra configuration is required. Scout reads the contents of the
REVISIONand/orrevisions.logfile and parses out the SHA of the most recent release. - If you are using Heroku, enable Dyno Metadata. This adds a
HEROKU_SLUG_COMMITenvironment variable to your dynos, which Scout then associates with deploys. - If you are deploying via a custom approach, set a
SCOUT_REVISION_SHAenvironment variable equal to the SHA of your latest release.- For example on fly.io you could set it with
fly deploy -e SCOUT_REVISION_SHA=$(git rev-parse --short HEAD)
- For example on fly.io you could set it with
- If the app resides in a Git repo, Scout parses the output of
git rev-parse --short HEADto determine the revision SHA.
Request Queuing
Our Ruby integration can measure the time it takes a request to reach your application from farther upstream (a load balancer or web server). This appears in Scout as “Request Queueing” and provides an indication of your application’s capacity. Large request queueing time is an indication that your app needs more capacity.
Please view request queueing section to learn how to get these insights.
Auto Instruments
In many apps, more than 30% of the time spent in a transaction is within custom code written by your development team. In traces, this shows up as time spent in “Controller” or “Job”. AutoInstruments helps break down the time spent in your custom code without the need to add custom instrumentation on your own.
AutoInstruments instruments code expressions in Ruby on Rails controllers by instrumenting Ruby’s Abstract Syntax Tree (AST) as code is loaded. These code expressions then appear in traces, just like the many libraries Scout already instruments:
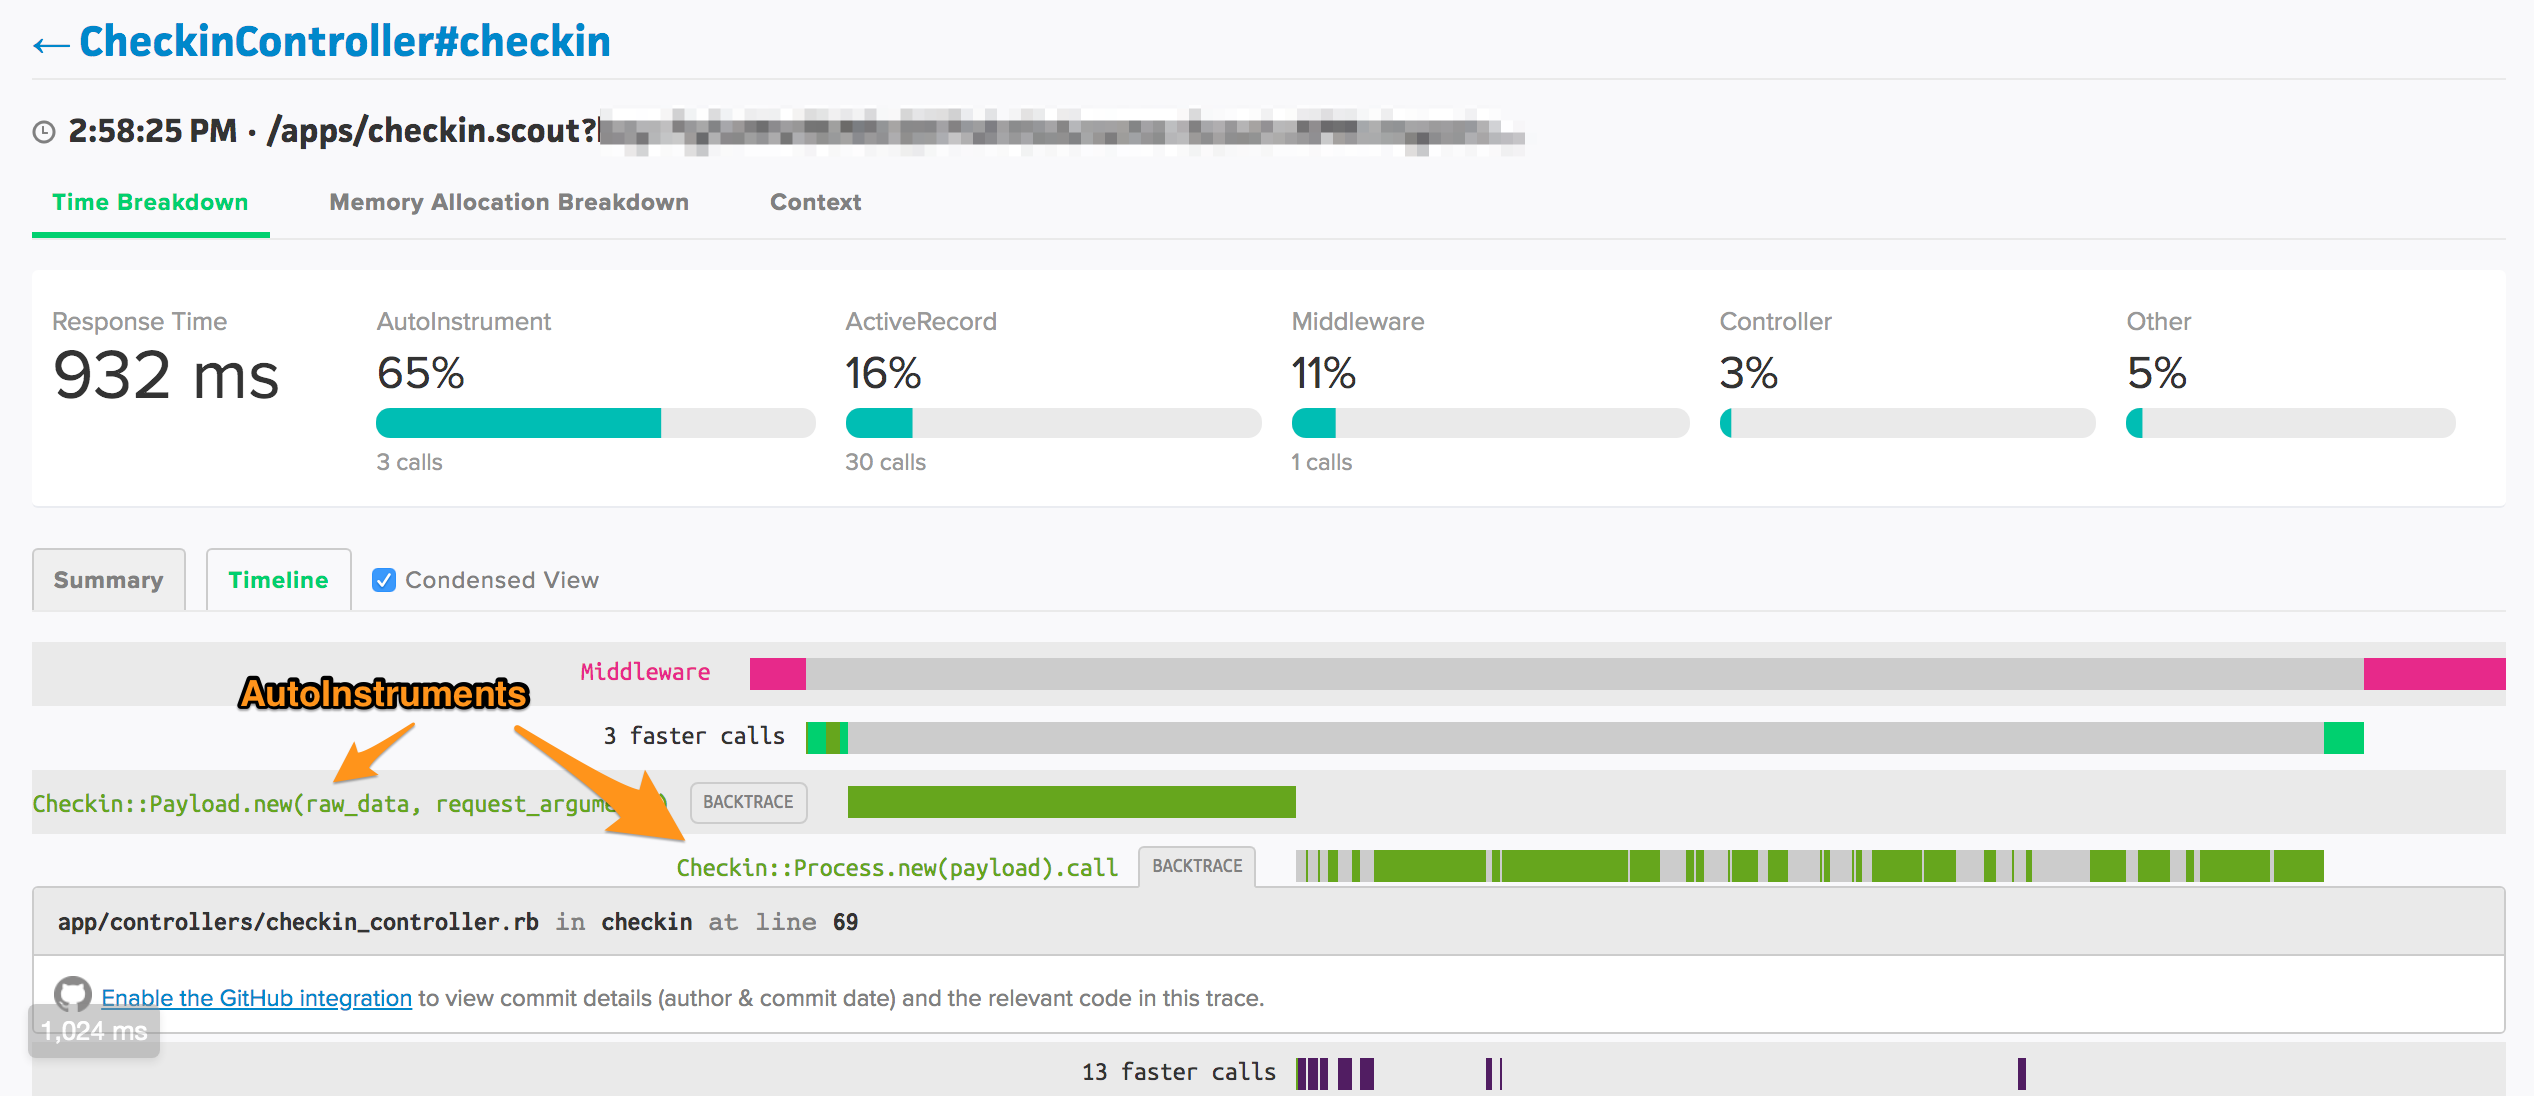
In the screenshot of a trace above, 68% of the time would be allocated to the Controller without enabling AutoInstruments. With AutoInstruments enabled, Controller time is just 3% of the request and we can clearly see that most of the time is spent inside two method calls.
AutoInstruments is currently available for Ruby on Rails applications.
Enabling AutoInstruments
AutoInstruments is available to apps using Ruby 2.3.1+. To enable:
1. Within your Rails app’s directory, run:
bundle update scout_apm
AutoInstruments was released in scout_apm version 2.6.0.
2. Set the auto_instruments config option to true.
If you are using a config file:
# config/scout_apm.yml
production:
  auto_instruments: true
If you are using environment variables:
SCOUT_AUTO_INSTRUMENTS=true
3. Deploy
A detailed AutoInstruments FAQ is available in our reference area.
Troubleshooting:
You may need to add/upgrade the parser gem.
To verify this, set log_level: debug in your scout_apm.yml (SCOUT_LOG_LEVEL: debug if using environment variable configuration – such as for Heroku), then check your log/scout_apm.log (if on Heroku check Logplex or your log drains) for the following debug level log:
AutoInstruments is enabled, but Parser::TreeRewriter is missing. Update 'parser' gem to >= 2.5.0.
The parser gem version works best when it matches the version of Ruby running your application (e.g. parser v3.1.1.0 for Ruby 3.1.1)
It is great, but we have seen issues even when parser was “ahead” of the Ruby version,
so we recommend matching as closely as possible. See parser’s README
for more information.
Custom Context
Context lets you see the forest from the trees. For example, you can add custom context to answer critical questions like:
- How many users are impacted by slow requests?
- How many trial customers are impacted by slow requests?
- How much of an impact are slow requests having on our highest paying customers?
It’s simple to add custom context to your app. There are two types of context:
User Context
For context used to identify users (ex: id):
ScoutApm::Context.add_user({})
Examples:
ScoutApm::Context.add_user(id: @user.id)
ScoutApm::Context.add_user(id: @user.id, location: @user.location.to_s)
General Context
ScoutApm::Context.add({})
Examples:
ScoutApm::Context.add(account: @account.id)
ScoutApm::Context.add(database_shard: @db.shard_id, monthly_spend: @account.monthly_spend)
Default Context
Scout reports the Request URI and the user’s remote IP Address by default.
Context Types
Context values can be any of the following types:
- Numeric
- String
- Boolean
- Time
- Date
Context Field Name Restrictions
Custom context names may contain alphanumeric characters, dashes, and underscores. Spaces are not allowed.
Attempts to add invalid context will be ignored.
Example: adding the current user’s id as context
Add the following to your ApplicationController class:
before_filter :set_scout_context
Create the following method:
def set_scout_context
  ScoutApm::Context.add_user(id: current_user.id) if current_user.is_a?(User)
end
Example: adding the monthly spend as context
Add the following line to the ApplicationController#set_scout_context method defined above:
ScoutApm::Context.add(monthly_spend: current_org.monthly_spend) if current_org
PII
To better protect your data, we suggest using ids instead of explicit names and emails
Renaming transactions
There may be cases where you require more control over how Scout names transactions for your endpoints and background jobs.
For example, if you have a controller-action that renders both JSON and HTML formats and the rendering time varies significantly between the two, it may make sense to define a unique transaction name for each.
Use ScoutApm::Transaction#rename:
class PostsController < ApplicationController
  def index
    ScoutApm::Transaction.rename("posts/foobar")
    @posts = Post.all
  end
end
In the example above, the default name for the transaction is posts/index, which appears as PostsController#index in the Scout UI. Renaming the transaction to posts/foobar identifies the transaction as PostsController#foobar in the Scout UI.
Do not generate highly cardinality transaction names (ex: ScoutApm::Transaction.rename("posts/foobar_#{current_user.id}")) as we limit the number of transactions that can be tracked. High-cardinality transaction names can quickly surpass this limit.
GraphQL
If you have a GraphQL endpoint which serves any number of queries, you likely want to have each of those types of queries show up in the Scout UI as different endpoints. You can accomplish this by renaming the transaction during the request like so:
scout_transaction_name = "GraphQL/" + operation_name
ScoutApm::Transaction.rename(scout_transaction_name)
Where operation_name is determined dynamically based on the GraphQL query. E.g. get_profile, find_user, etc.
Do not generate highly cardinality transaction names, like ScoutApm::Transaction.rename("GraphQL/foobar_#{current_user.id}"), as we limit the number of transactions that can be tracked. High-cardinality transaction names can quickly surpass this limit.
Custom Instrumentation
Traces that allocate significant amount of time to Controller or Job are good candidates to add custom instrumentation. This indicates a significant amount of time is falling outside our default instrumentation.
Limits
We limit the number of metrics that can be instrumented. Tracking too many unique metrics can impact the performance of our UI. Do not dynamically generate metric types in your instrumentation (ie self.class.instrument("user_#{user.id}", "generate") { ... }) as this can quickly exceed our rate limits.
Instrumenting method calls
To instrument a method call, add the following to the class containing the method:
  class User
    include ScoutApm::Tracer

    def export_activity
      # Do export work
    end
    instrument_method :export_activity
  end
The call to instrument_method should be after the method definition.
Naming methods instrumented via instrument_method
In the example above, the metric will appear in traces as User#export_activity. On timeseries charts, the time will be allocated to a Custom type.
To modify the type:
instrument_method :export_activity, type: 'Exporting'
A new Exporting metric will now appear on charts. The trace item will be displayed as Exporting/User/export_activity.
To modify the name:
instrument_method :export_activity, type: 'Exporting', name: 'user_activity'
The trace item will now be displayed as Exporting/user_activity.
Instrumenting blocks of code
To instrument a block of code, add the following:
  class User
    include ScoutApm::Tracer

    def generate_profile_pic
      self.class.instrument("User", "generate_profile_pic") do
        # Do work
      end
    end
  end
Naming methods instrumented via instrument(type, name)
In the example above, the metric appear in traces as User/generate_profile_pic. On timeseries charts, the time will be allocated to a User type. To modify the type or simply, simply change the instrument corresponding method arguments.
Environments
It typically makes sense to treat each environment (production, staging, etc) as a separate application within Scout and ignore the development and test environments. Configure a unique app name for each environment as Scout aggregates data by the app name.
There are 2 approaches:
1. Modifying your scout_apm.yml config file
Here’s an example scout_apm.yml configuration to achieve this:
common: &defaults
  name: <%= "YOUR_APP_NAME (#{Rails.env})" %>
  key: YOUR_KEY
  log_level: info
  monitor: true

production:
  <<: *defaults

development:
  <<: *defaults
  monitor: false

test:
  <<: *defaults
  monitor: false

staging:
  <<: *defaults
2. Setting the SCOUT_NAME environment variable
Setting the SCOUT_NAME and SCOUT_MONITOR environment variables will override settings settings your scout_apm.yml config file.
To isolate data for a staging environment: SCOUT_NAME="YOUR_APP_NAME (Staging)".
To disable monitoring: SCOUT_MONITOR=false.
See the full list of configuration options.
Disabling a Node
To disable Scout APM on any node in your environment, just set monitor: false in your scout_apm.yml configuration file on that server, and restart your app server. Example:
common: &defaults
  name: <%= "YOUR_APP_NAME (#{Rails.env})" %>
  key: YOUR_KEY
  log_level: info
  monitor: false

production:
  <<: *defaults
Since the YAML config file allows ERB evaluation, you can even programatically enable/disable nodes based on host name. This example enables Scout APM on web1 through web5:
common: &defaults
  name: <%= "YOUR_APP_NAME (#{Rails.env})" %>
  key: YOUR_KEY
  log_level: info
  monitor: <%= Socket.gethostname.match(/web[1..5]/) %>

production:
  <<: *defaults
After you’ve disabled a node in your configuration file and restarted your app server, the node show up as inactive in the UI after 10 minutes.