Traces
Trace Transactions
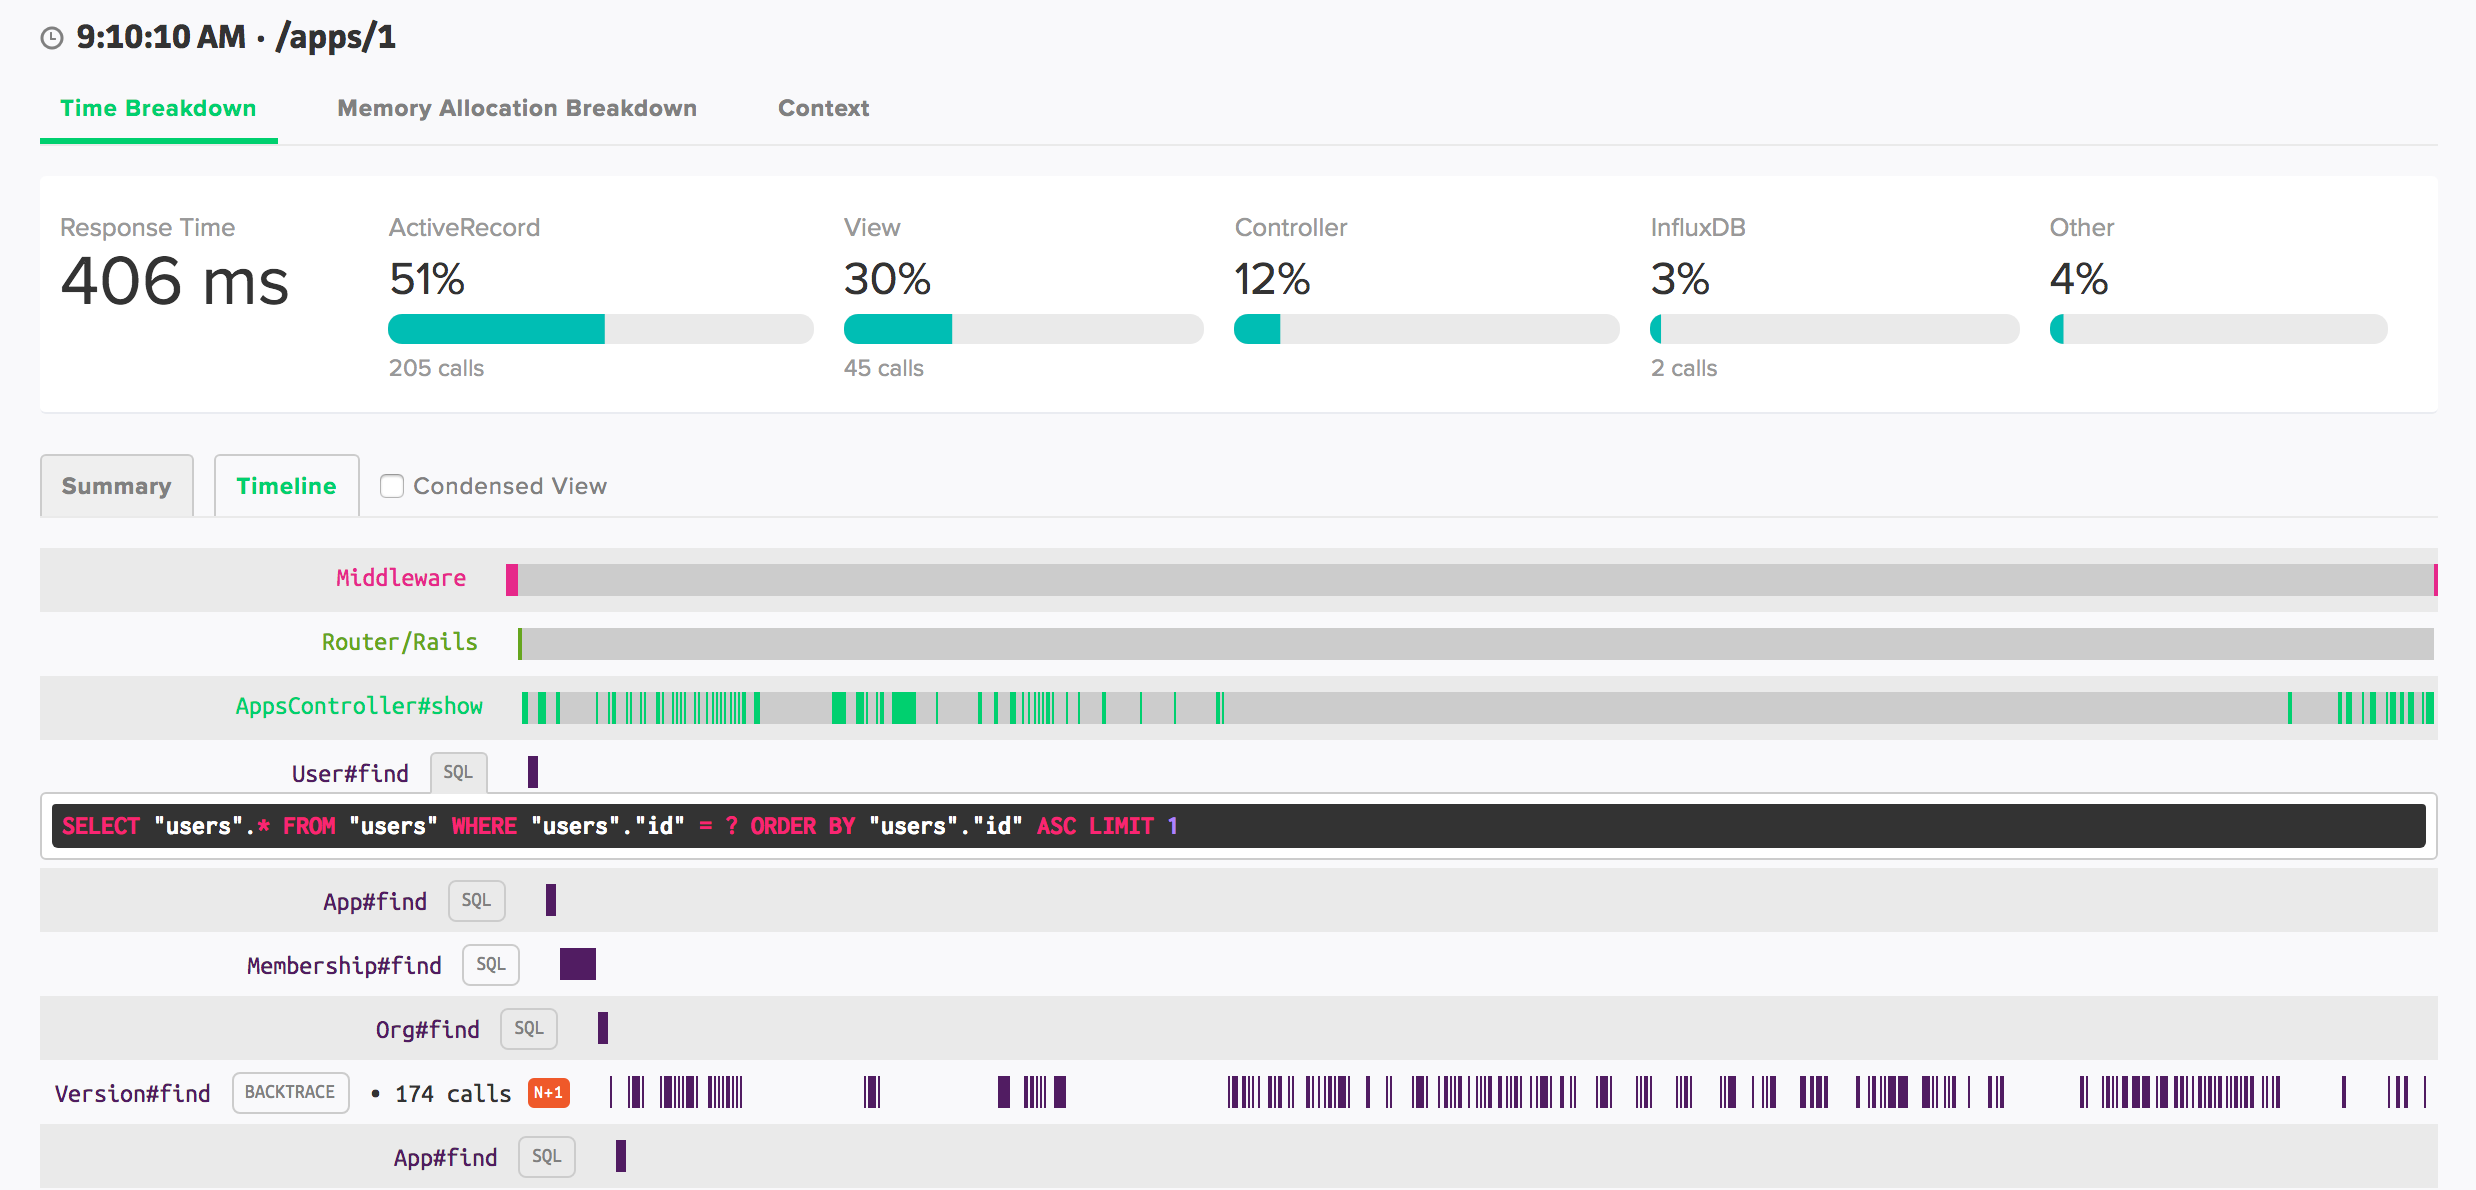
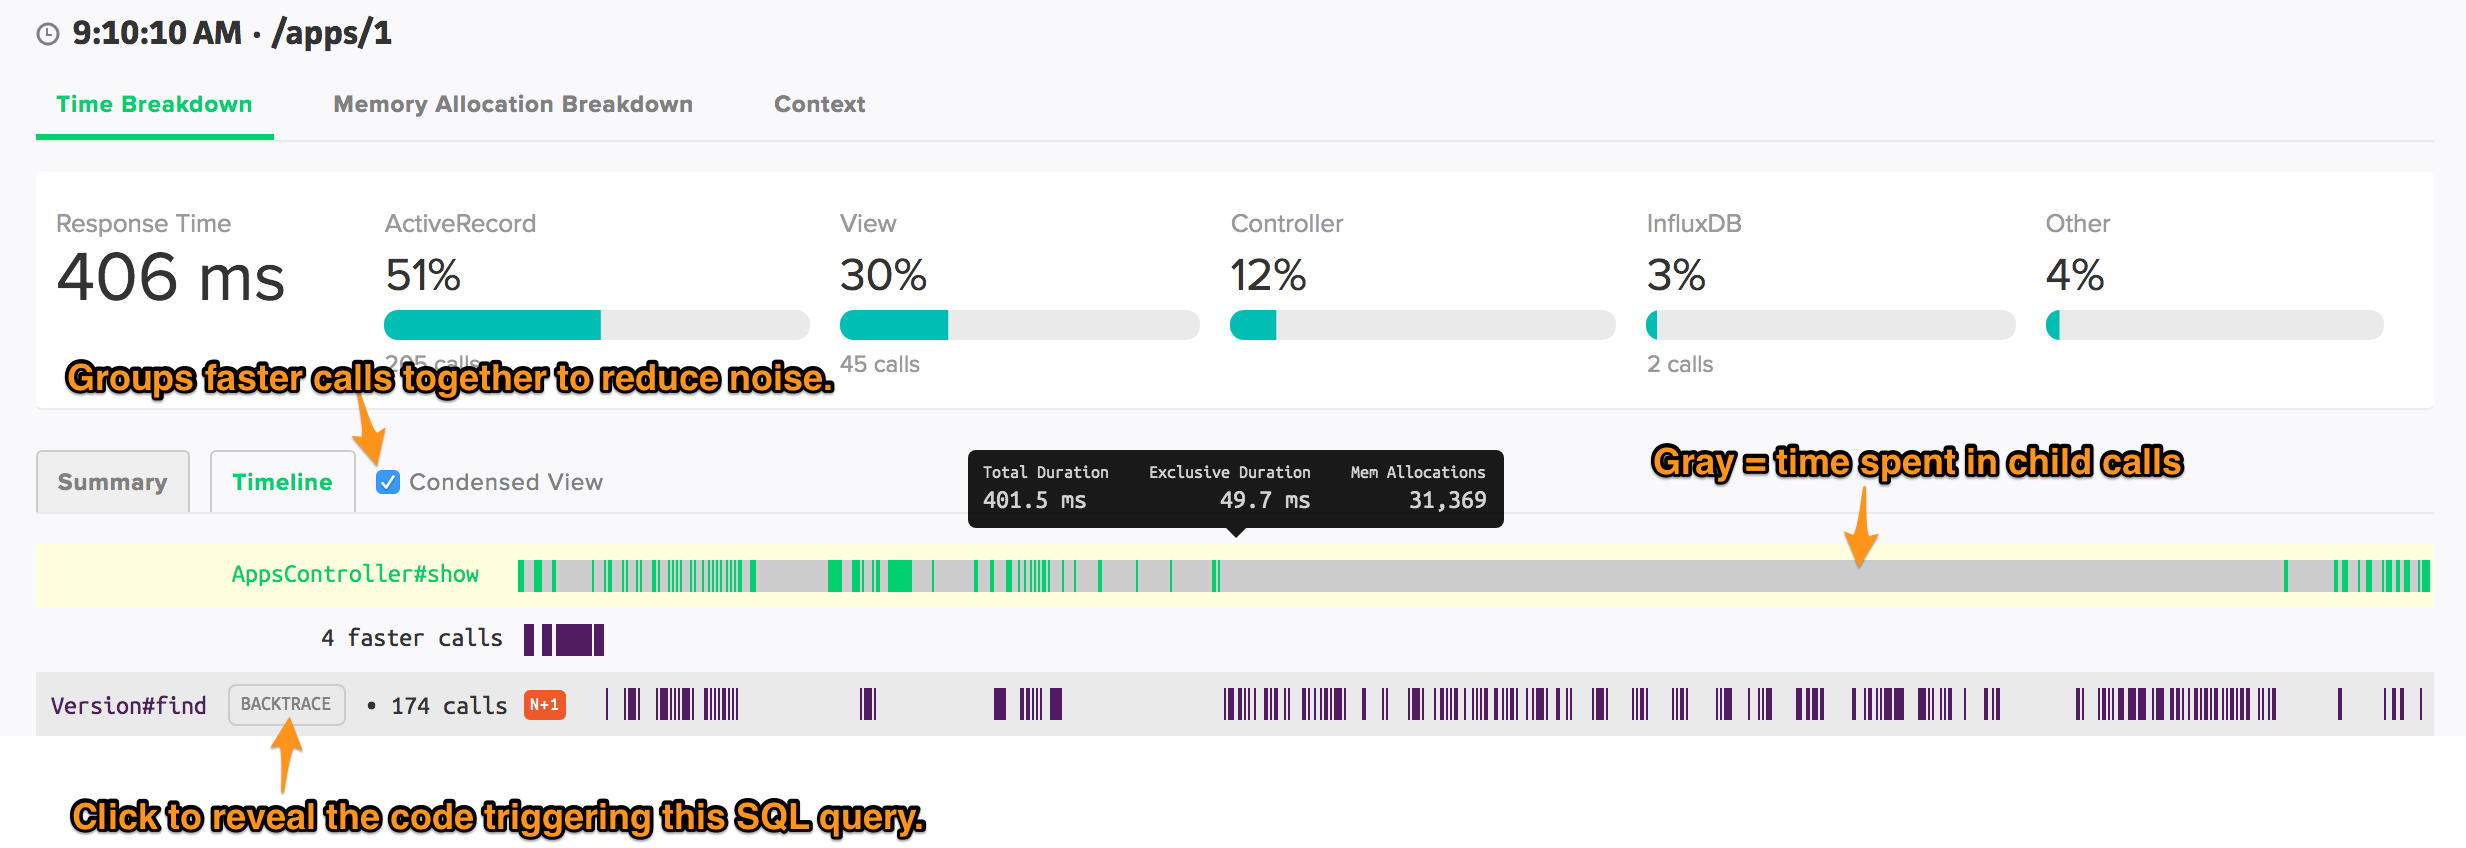
Scout collects detailed transactions across your web endpoints and background jobs automatically. The transaction traces provide a number of visual queues to direct you to hotspots. Dig into bottlenecks - down to the line-of-code, author, commit date, and deploy time - from this view.
SQL Queries
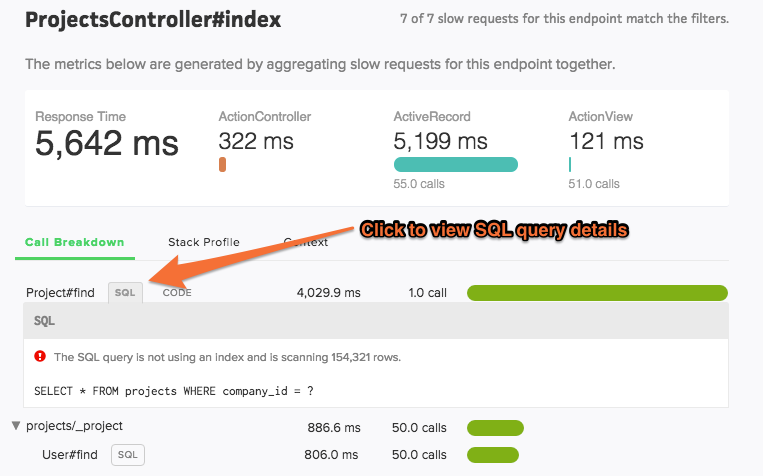
Scout captures a sanitized version of SQL queries. Click the “SQL” button next to a call to view details.
Don’t see an SQL button next to a database query?
Scout collects a sanitized version of SQL queries and displays these in transaction traces. To limit agent overhead sanitizing queries, we do not collect query statements with more than 16k characters.
Code Backtraces
You’ll see “CODE” buttons next to method calls that are >= 500 ms. If you’ve enabled the GitHub integration, you can see the line-of-code, associated SQL or HTTP endpoint (if applicable), author, commit date, and deploy time for the relevant slow code.
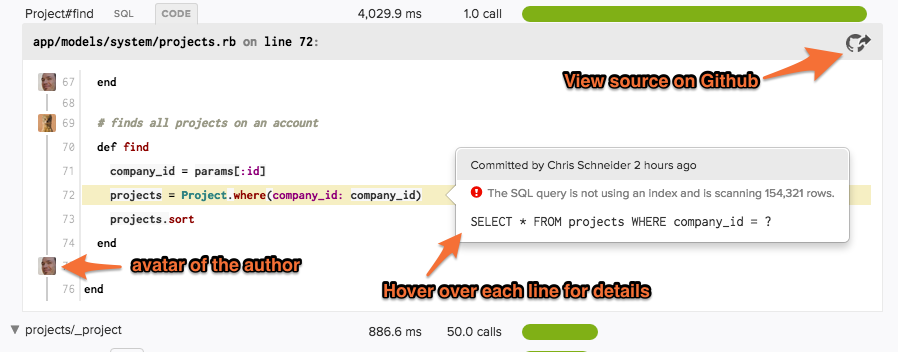
If you don’t enable the GitHub integration, you’ll see a backtrace.
Trace Views
There are two displays for showing the details of a transaction trace:
- Summary View - Method calls are aggregated together and ordered from most to least expensive.
- Timeline View - Shows the execution order of calls as they occur during the transaction.
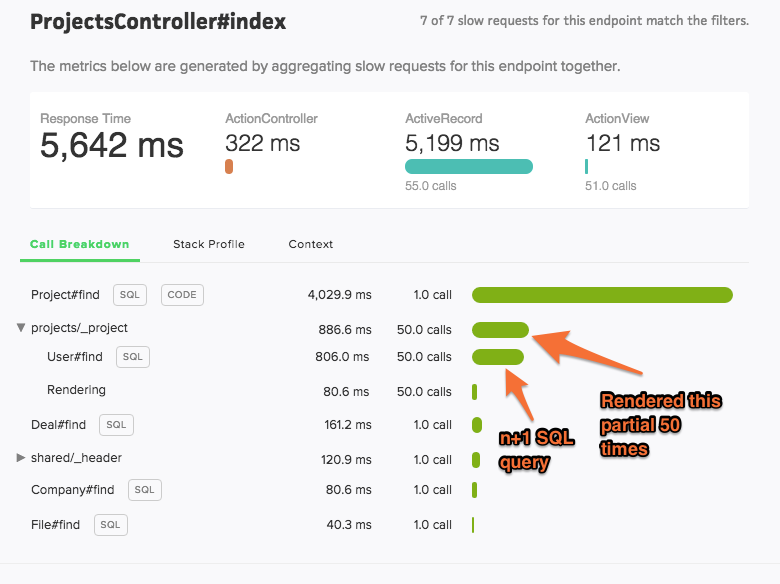
Summary View
Method calls are aggregated together and listed from most expensive to least expensive. The time displayed is the total time across all calls (not the time per-call).
Timeline View
See the execution order of your code.
Create GitHub or Linear Issues
Found an interesting trace and want to create an issue for it? Use the Create Issue dropdown at the top of any trace detail page (and on error detail pages) to open a pre-filled issue in a new tab. The issue title is filled in for you, along with a link back to the Scout page so your team can jump straight to the trace or error.
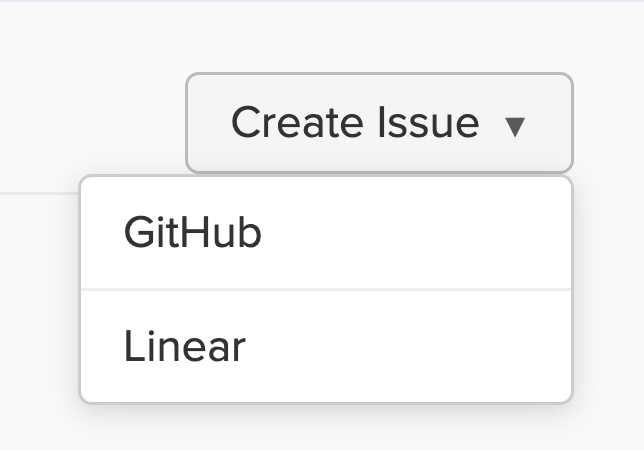
- GitHub — available when your app has a repository configured via the Git integration. If no repository is configured yet, the dropdown links you to the app’s GitHub integration settings.
- Linear — always available; no configuration required.
Trace Explorer
What was the slowest request yesterday? How has the app performed for user@domain.com? Which endpoints are generating the bulk of slow requests? Trace Explorer lets you quickly filter the transaction traces collected by Scout, giving you answers to your unique questions.
Trace Explorer is accessed via the “Traces” navigation link when viewing an app.
How to use Trace Explorer
There are two main areas of Trace Explorer:
- Dimension Histograms - the top portion of the page generates a histogram representation for a number of trace dimensions (the response time distribution, count of traces by endpoints, and a display for each piece of custom context). Selecting a specific area of a chart filters the transactions to just the selected data.
- List of transaction traces - the bottom portion of the page lists the individual traces. The traces are updated to reflect those that match any filtered dimensions. You can increase the height of this pane by clicking and dragging the top portion of the pane. Clicking on a trace URI opens the transaction trace in a new browser tab.
Custom Trace Querying
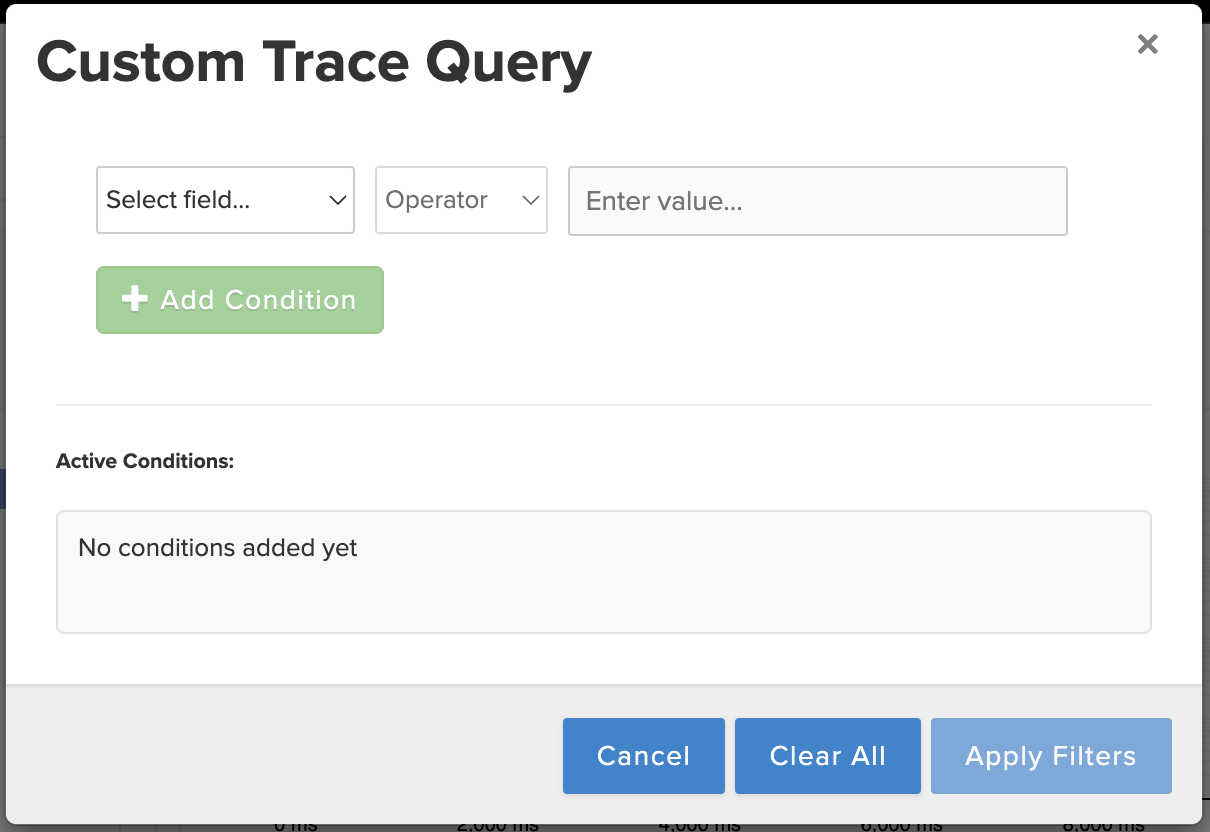
From the top right of the Trace Explorer, you can select a “Dataset” of 1000 traces. These include a random “Sample”, the “Slowest” traces, or those with the “Most Allocations”. In addition, you can select the “Query” button to build a custom query. Here, you can query on any attribute you’d like, including custom context you’ve set. Only want to load traces for a specific user_id? From a certain host? Apply as many conditions as you like, and then select “Apply Filters”.