Log Management
Installation
Our logging solution aims to “just work” with Rails, Python, and Elixir applications.
Each App can have logs enabled individually and requires a unique Ingest Key. Visit the Logs page from an App in the Scout UI to get started.
For a Rails Application
AAdd the scout_apm_logging gem to your gemfile.
BConfigure Scout in your scout_apm.yml configuration file:
common: &defaults

     # ... other Scout APM settings

     logs_monitor: true
     logs_ingest_key: aaaa-1111-aaaa-1111 # Provided in App Logs Page
CDeploy!
Further configuration options are available, but the above is the minimum required to get started.
For a Python Application
AInstall the Scout Python logging package:
pip install scout-apm-logging
BSet SCOUT_LOGS_INGEST_KEY in your existing configuration or via an environment variable. This key is provided in the Logs page of the enabled App.
CAdd the Scout logging handler to your Python logging configuration. Here's an example using dictConfig:
import os
from logging.config import dictConfig
from scout_apm_logging import ScoutOtelHandler

LOGGING_CONFIG = {
    "version": 1,
    "disable_existing_loggers": False,
    "formatters": {
        "verbose": {
            "format": "%(levelname)s %(asctime)s %(module)s %(process)d %(thread)d %(message)s"
        },
        "simple": {"format": "%(levelname)s %(message)s"},
    },
    "handlers": {
        "scout": {
            "level": "DEBUG",
            "class": "scout_apm_logging.ScoutOtelHandler",
            "service_name": "your-python-app",
        },
        "console": {
            "level": "DEBUG",
            "class": "logging.StreamHandler",
            "formatter": "simple",
        },
    },
    "loggers": {
        "": {  # Root logger
            "handlers": ["console", "scout"],
            "level": "DEBUG",
        },
    },
}

# Apply the logging configuration
dictConfig(LOGGING_CONFIG)
This configuration attaches the ScoutOtelHandler to the root logger with the DEBUG log level, which will send all logs from internal libraries to Scout. Python logging is highly configurable, and we provide some common configurations to get you started.
For an Elixir Application
Log management is built into the Scout APM Elixir agent (v2.0+). It integrates with Elixir's built-in Logger.
AIf you haven't already, add scout_apm to your mix.exs:
{:scout_apm, "~> 2.0"}
BEnable log management in your config and provide your ingest key (available in the Logs page of your Scout app):
config :scout_apm,
  logs_enabled: true,
  logs_ingest_key: "your-logs-ingest-key"
CAttach the log handler in your Application.start/2:
def start(_type, _args) do
  ScoutApm.Logging.attach()
  # ... rest of supervision tree
end
DDeploy!
Logs within Scout-tracked requests are automatically enriched with request context. See the Elixir features docs for further configuration options.
Overview
Scout’s Log Management is designed with ease-of-use as a top priority. Sending logs to us and viewing them in the UI should be as simple as possible. By working with our existing agents, we can also gather more context and automatically apply it to your application logs. This gives you extra power to filter and search through your logs, and to correlate them with other performance data. Some highlights:
- Filter logs by entrypoint (i.e. Controller originating the activity)
- Filter logs by Custom Context (attributes - anything you have added to the Scout APM agent)
- Fast in-memory exploration
Functionality
Visiting the Logs page will begin loading the log records that we have received according to the timeframe you have selected, e.g. “Past 3 hours.” Logs will load from most-recent to oldest. We load 10K records initially, more can be loaded as needed. As the logs load, you can rapidly filter to desired Severity Levels and search/filter via regex applied to the message body and attributes. The time window can also be narrowed via horizontal selection (“brush”) on the chart. These filters apply to logs that are already loaded into the browser.
When you determine interesting lines, you can also use the pre-load filters to screen logs closer to the log storage layer, allowing you to scan longer timeframes without pulling too many records into the browser. This two-phase approach can be a powerful and flexible way to efficiently seek through a very large corpus of log records. We hope you love it!
Filtering
Pre-Load Filters
The Logs Filtering allows you to limit the logs that are loaded into the Logs View. These filters are applied to the logs in our storage system before loading them into the application. Filtering by time can especially reduce the amount of data processed and returned by our application. Keep in mind that rapid filtering and manipulation can be further performed within the Logs Table after the Logs have been loaded.
Logs can be filtered by:
- Date and Time: Using the Scout time selector, as usual.
- Message Content: A simple CONTAINS filter is available.
- Attributes: Values of any attributes that are present in the logs can be used to filter.
For Attribute filters, you will need to select the attribute key and then provide a value to filter by. We populate the selection with all the attributes of the logs we’ve loaded so far. See the below gif for adding the ‘org_id’ custom context we have added to our application as a filter.
After changing any of these filters, hitting “Load” will discard the current in-memory logs and begin loading new data matching the filter criteria.
Default Attributes
The Scout Logs agent enriches Rails logs with a few attributes by default:
- entrypoint: The top-level action (e.g. Controller class, in Rails) that the log was generated from.
- location: The file and line number where the log was generated.
In addition, it will capture all key-value pairs from any Custom Context that you have set. This means logs can be filtered by any Custom Context attributes.
Logs List
As records are loading, the Logs List allows you to filter your log data in straightforward ways. These filters also determine the data sent to the rest of the statistics and charts on the screen, allowing you to focus on the most relevant Logs for any given visualization.
Severity Filter
Select any combination of severity levels to filter the logs.
Entrypoint Filter
The entrypoint filter allows you to filter logs pertaining to specific endpoints or background jobs.
Regex Filter
The Regex Filter allows you to filter the Logs List using regex that evaluates against message content as well as log Attributes (both keys and values). We hope it lets you quickly narrow things down, whatever you might want to narrow by.
Loading Controls
At the top of the Logs List are a few controls that allow you to manage the loading of data into the Logs List. These controls are useful for managing the amount of data that is loaded into the Logs List at any given time.
- Progress Info: This section indicates the amount of data that has been returned vs scanned.
- Loading Bar: This bar indicates the progress of the data being loaded. You can hover over to get an approximate numerical value.
- Pause/Resume: These buttons allow you to pause and resume the loading of data. This is useful if you want to stop the loading of data to inspect the data that has already been loaded or if you don’t want to load the default 10K Logs per load.
- Full Screen: This button allows you to expand the Logs List to full screen mode.
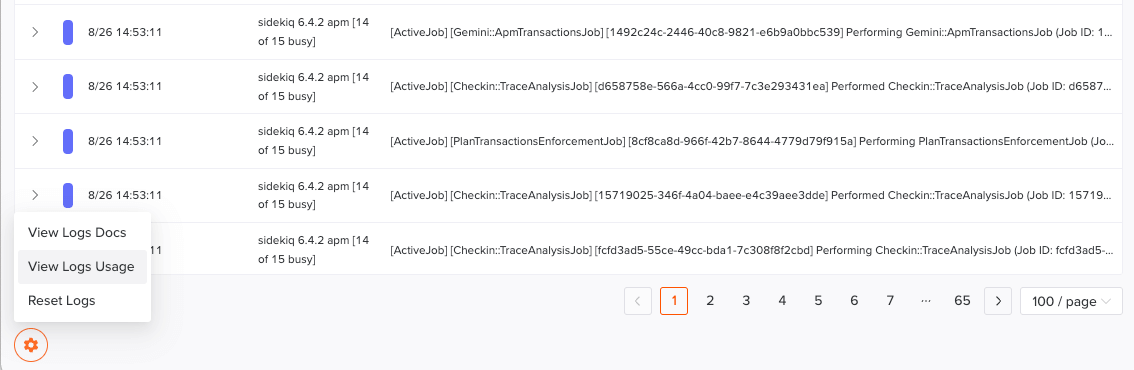
Usage & Billing
Usage can be broken out into two categories. Write usage and read usage. Write usage is the total bytes of uncompressed data sent to our servers in OTLP format. Read usage is the number of bytes of total uncompressed data that we traversed when performing an operation.
To view your usage, click the cog in the bottom left, which will display a list of options to choose from. Within this list click “View Logs Usage”. Here, you will have 14 days of both write and read usage streamed in.
For detailed configuration options and advanced setup instructions, see:
FAQ
How does this work?
For Rails applications, if you are using 7.1+ we will add a custom logger, which has a formatter that utilizes the OpenTelemetry Ruby SDK to send logs to us, to the broadcast logger. For Rails applications before 7.1, we will use this same custom logger but we will also create a proxy logger which we will swap out for all instances of the old logger, and this proxy logger will log to the old logger as well as the custom one.
For Python applications, we provide a custom logging handler which wraps the OpenTelemetry Python SDK. This handler integrates with your existing logging setup, and sends logs directly to Scout without requiring the Otel Collector to be installed separately.
For Elixir applications, a custom Logger handler is attached that captures log messages, enriches them with Scout APM context (request ID, transaction name, custom tags), and sends them to Scout via OTLP. Your existing Logger configuration is not modified.
The logs will be available in the Scout UI for you to search and filter. For Rails, we will automatically set a custom log formatter to include additional context in the logs sent to us. Your original logs will not be altered. The Ruby, Python, and Elixir agents are open source and available on Github.
What is the retention period on this log data?
Scout retains your log data for 14 days. If you require longer-term storage, please let us know as we would like to create options for our customers, but at this point you will need to also send them to an alternative location.