OpenTelemetry
Scout is excited to announce that we have brought an OpenTelemetry/observability product to market called TelemetryHub!
View the three pillars of your mission critical monitoring stack – traces, logs and metrics – all within a single pane of glass.
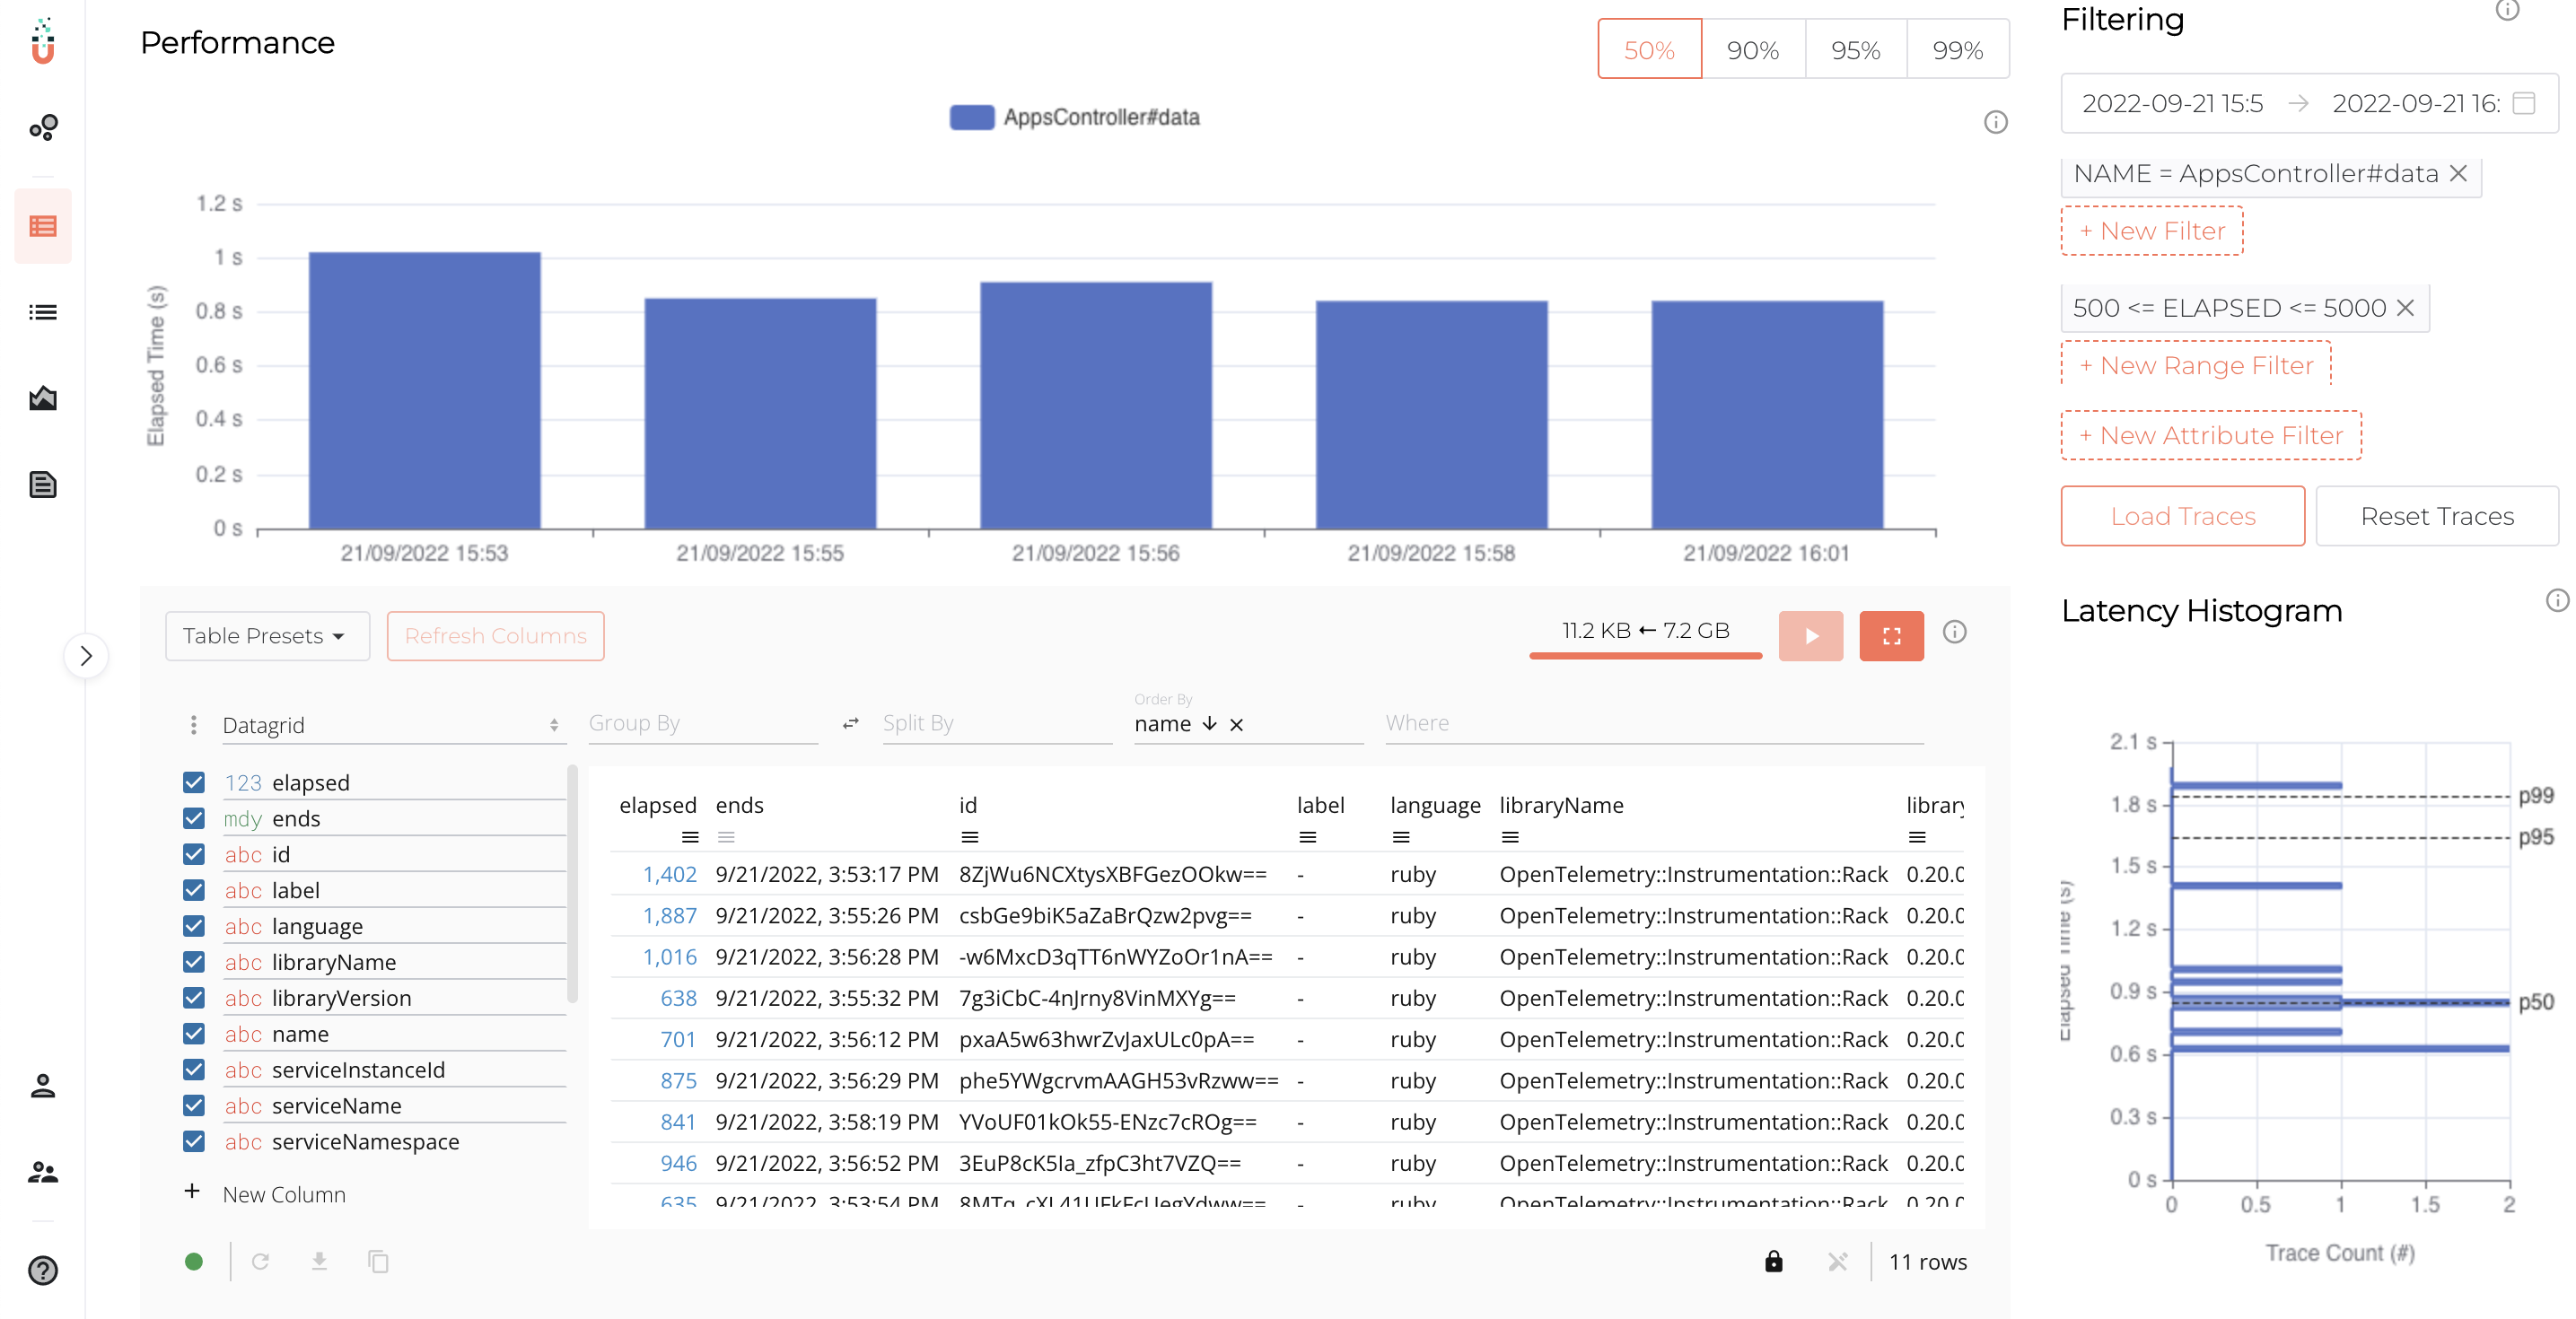
Traces
View and be able to filter down the traces that matter to you most. With both in memory filtering as well as back-end aggregation filtering, you can both quickly and easily get to the bottom of your monitoring needs.
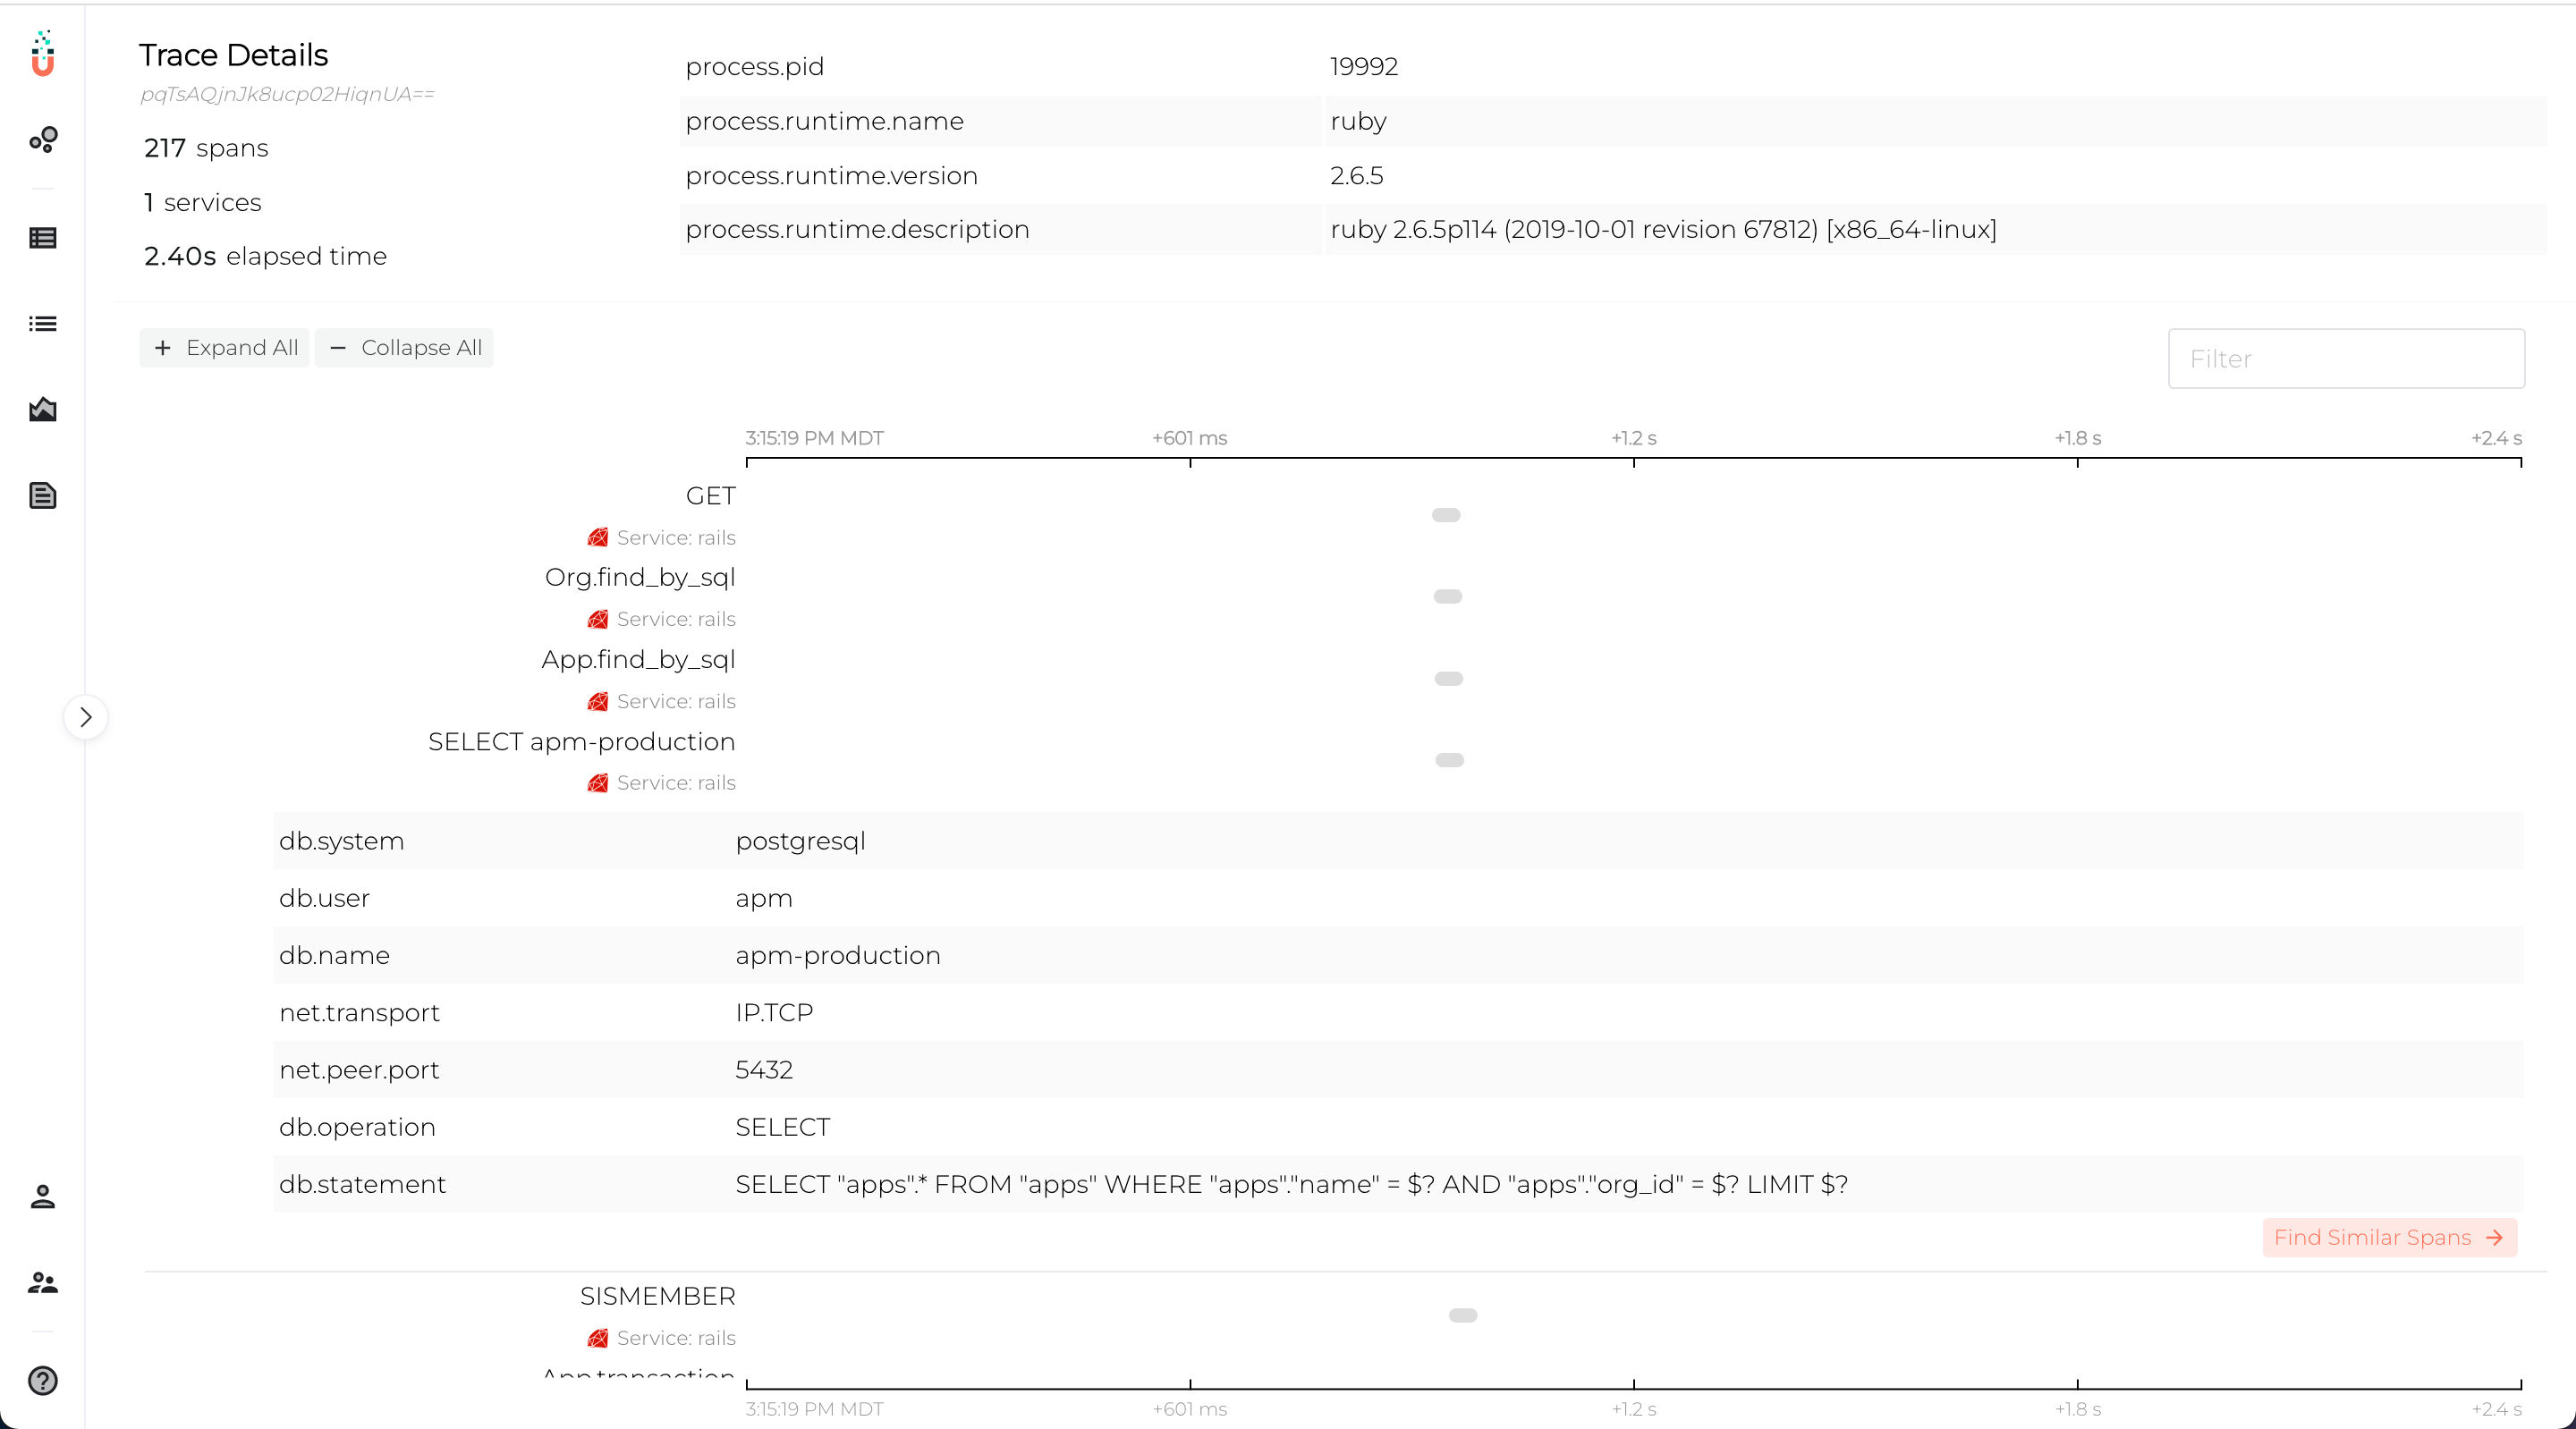
Trace drill down
Drill down into individual traces and spans to identify which part of the request / transaction / job / task / run is causing unexpected or undesirable behavior.
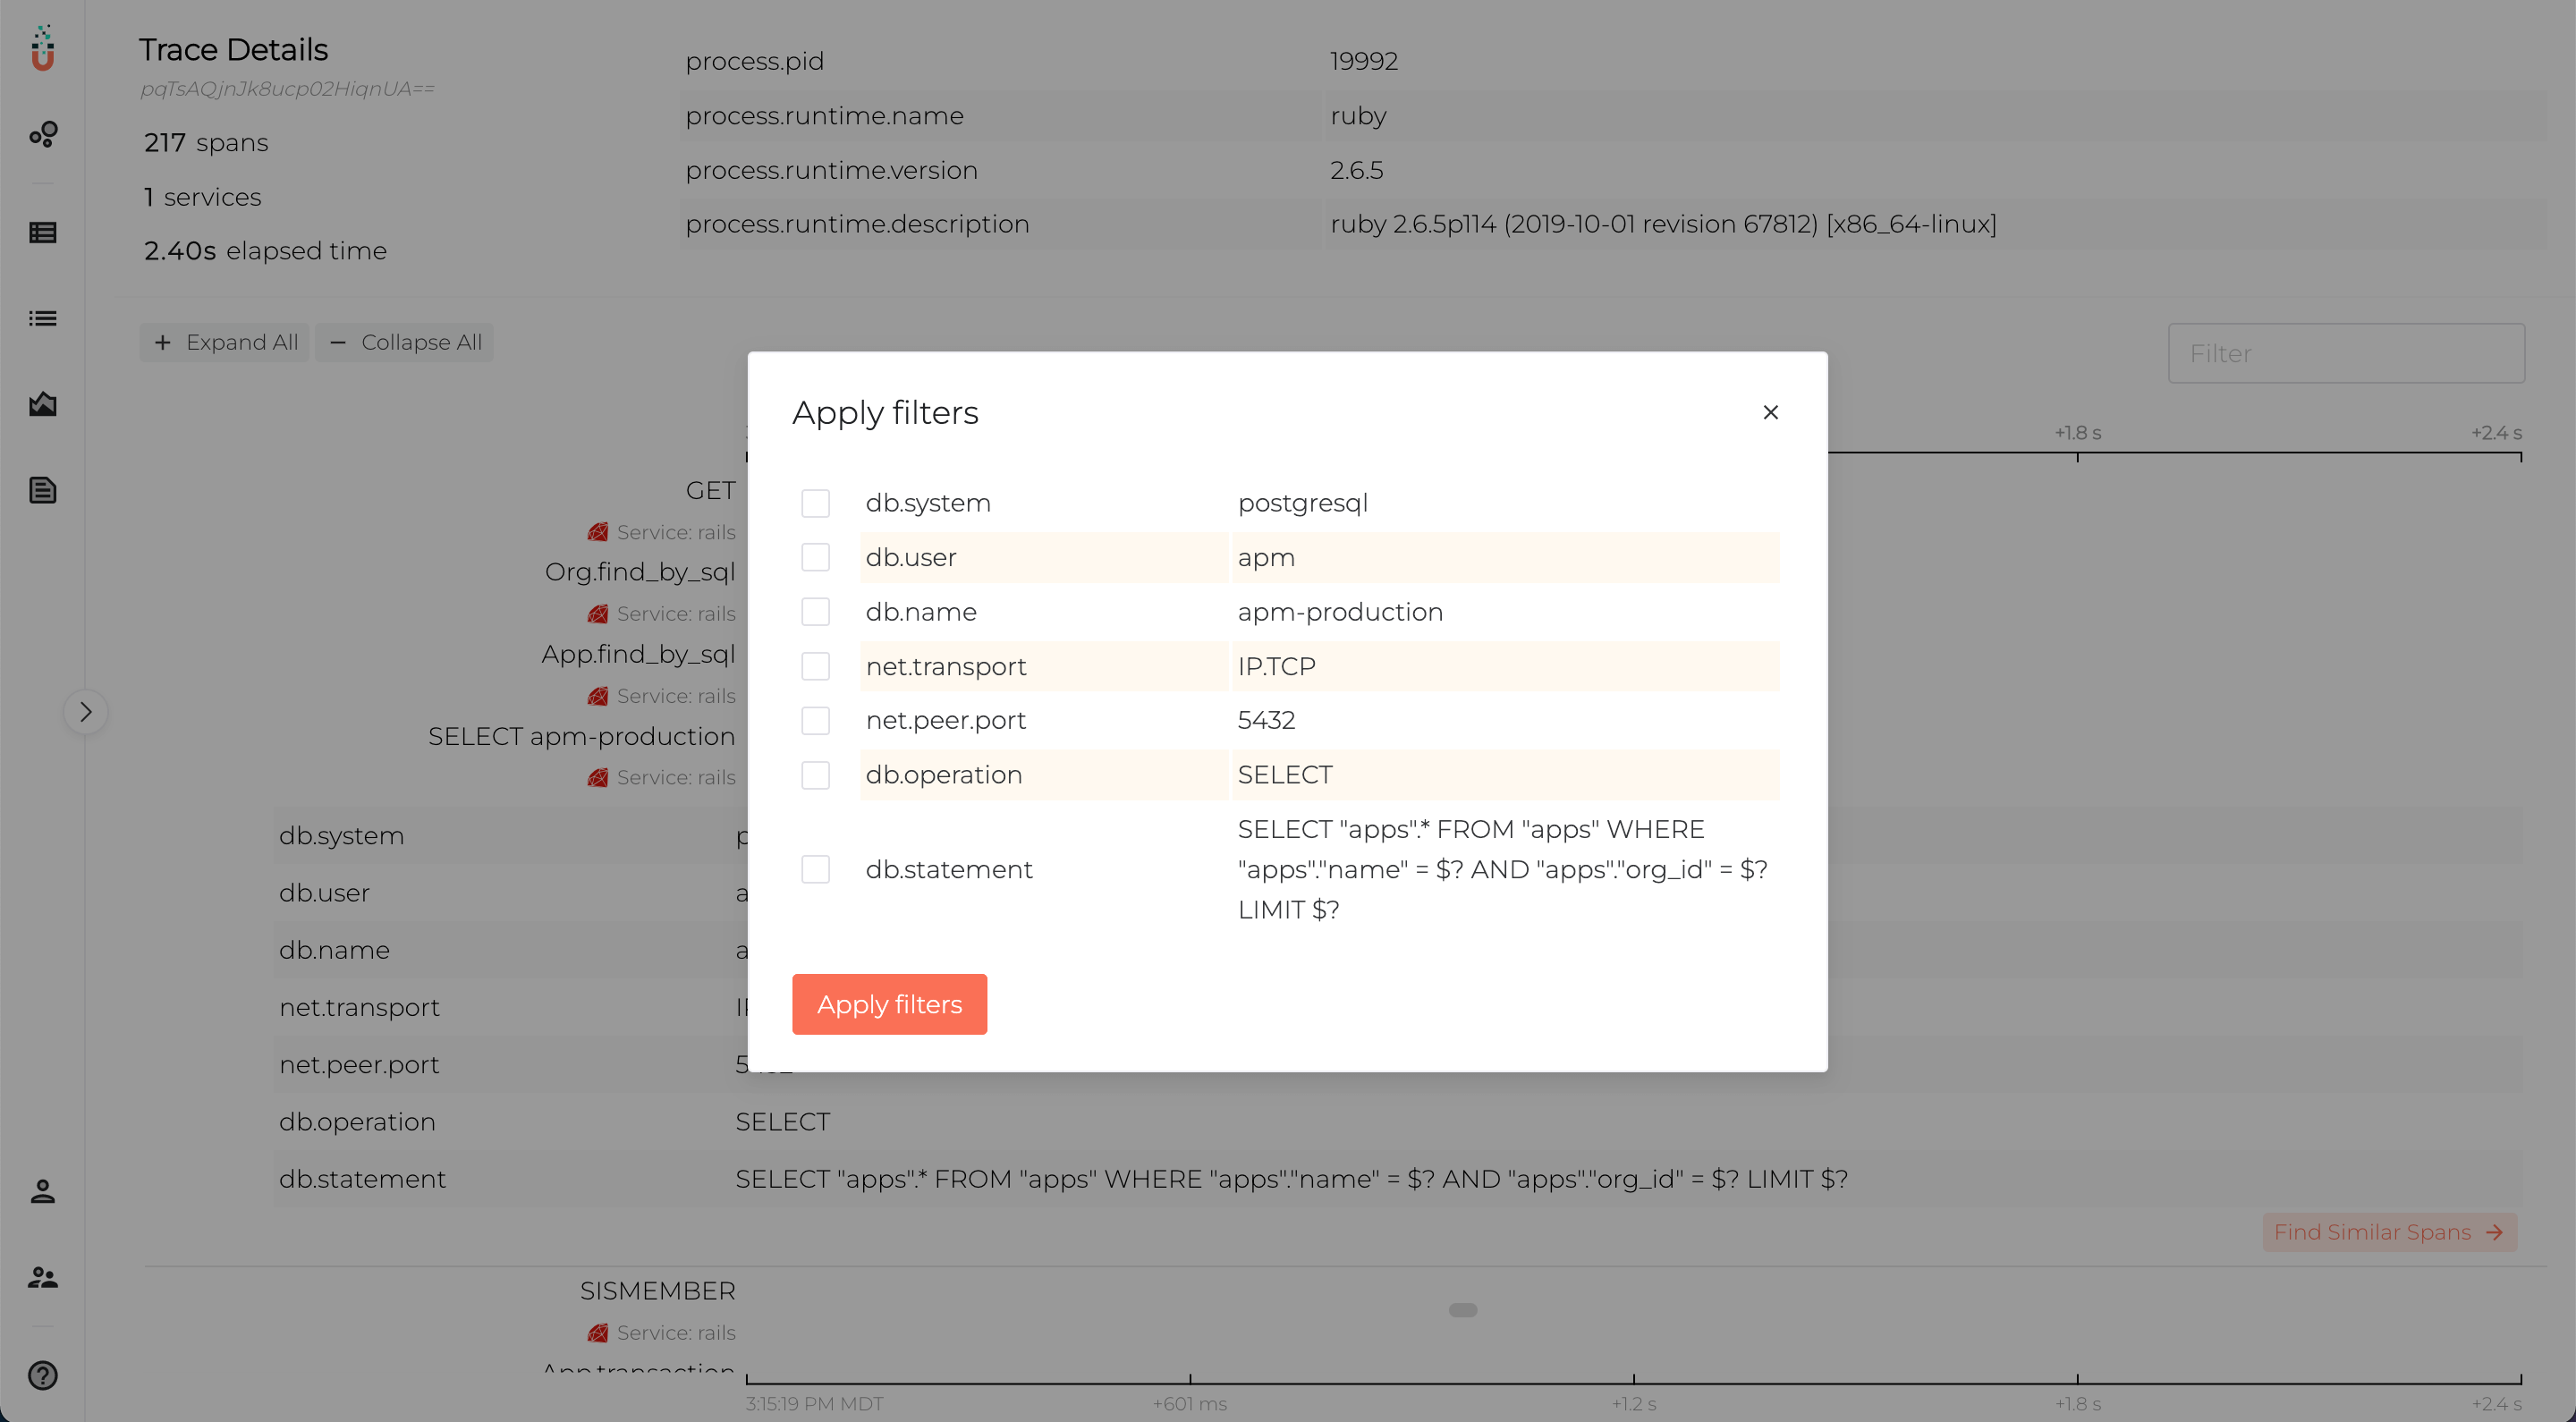
Similar spans
Whether it be DB transaction, network requests, file reads, etc. problems usually come in bunches. Wondering whether a long DB transaction is impacting multiple parts of your application and/or service group? Look for similar spans where we have seen this attribute.
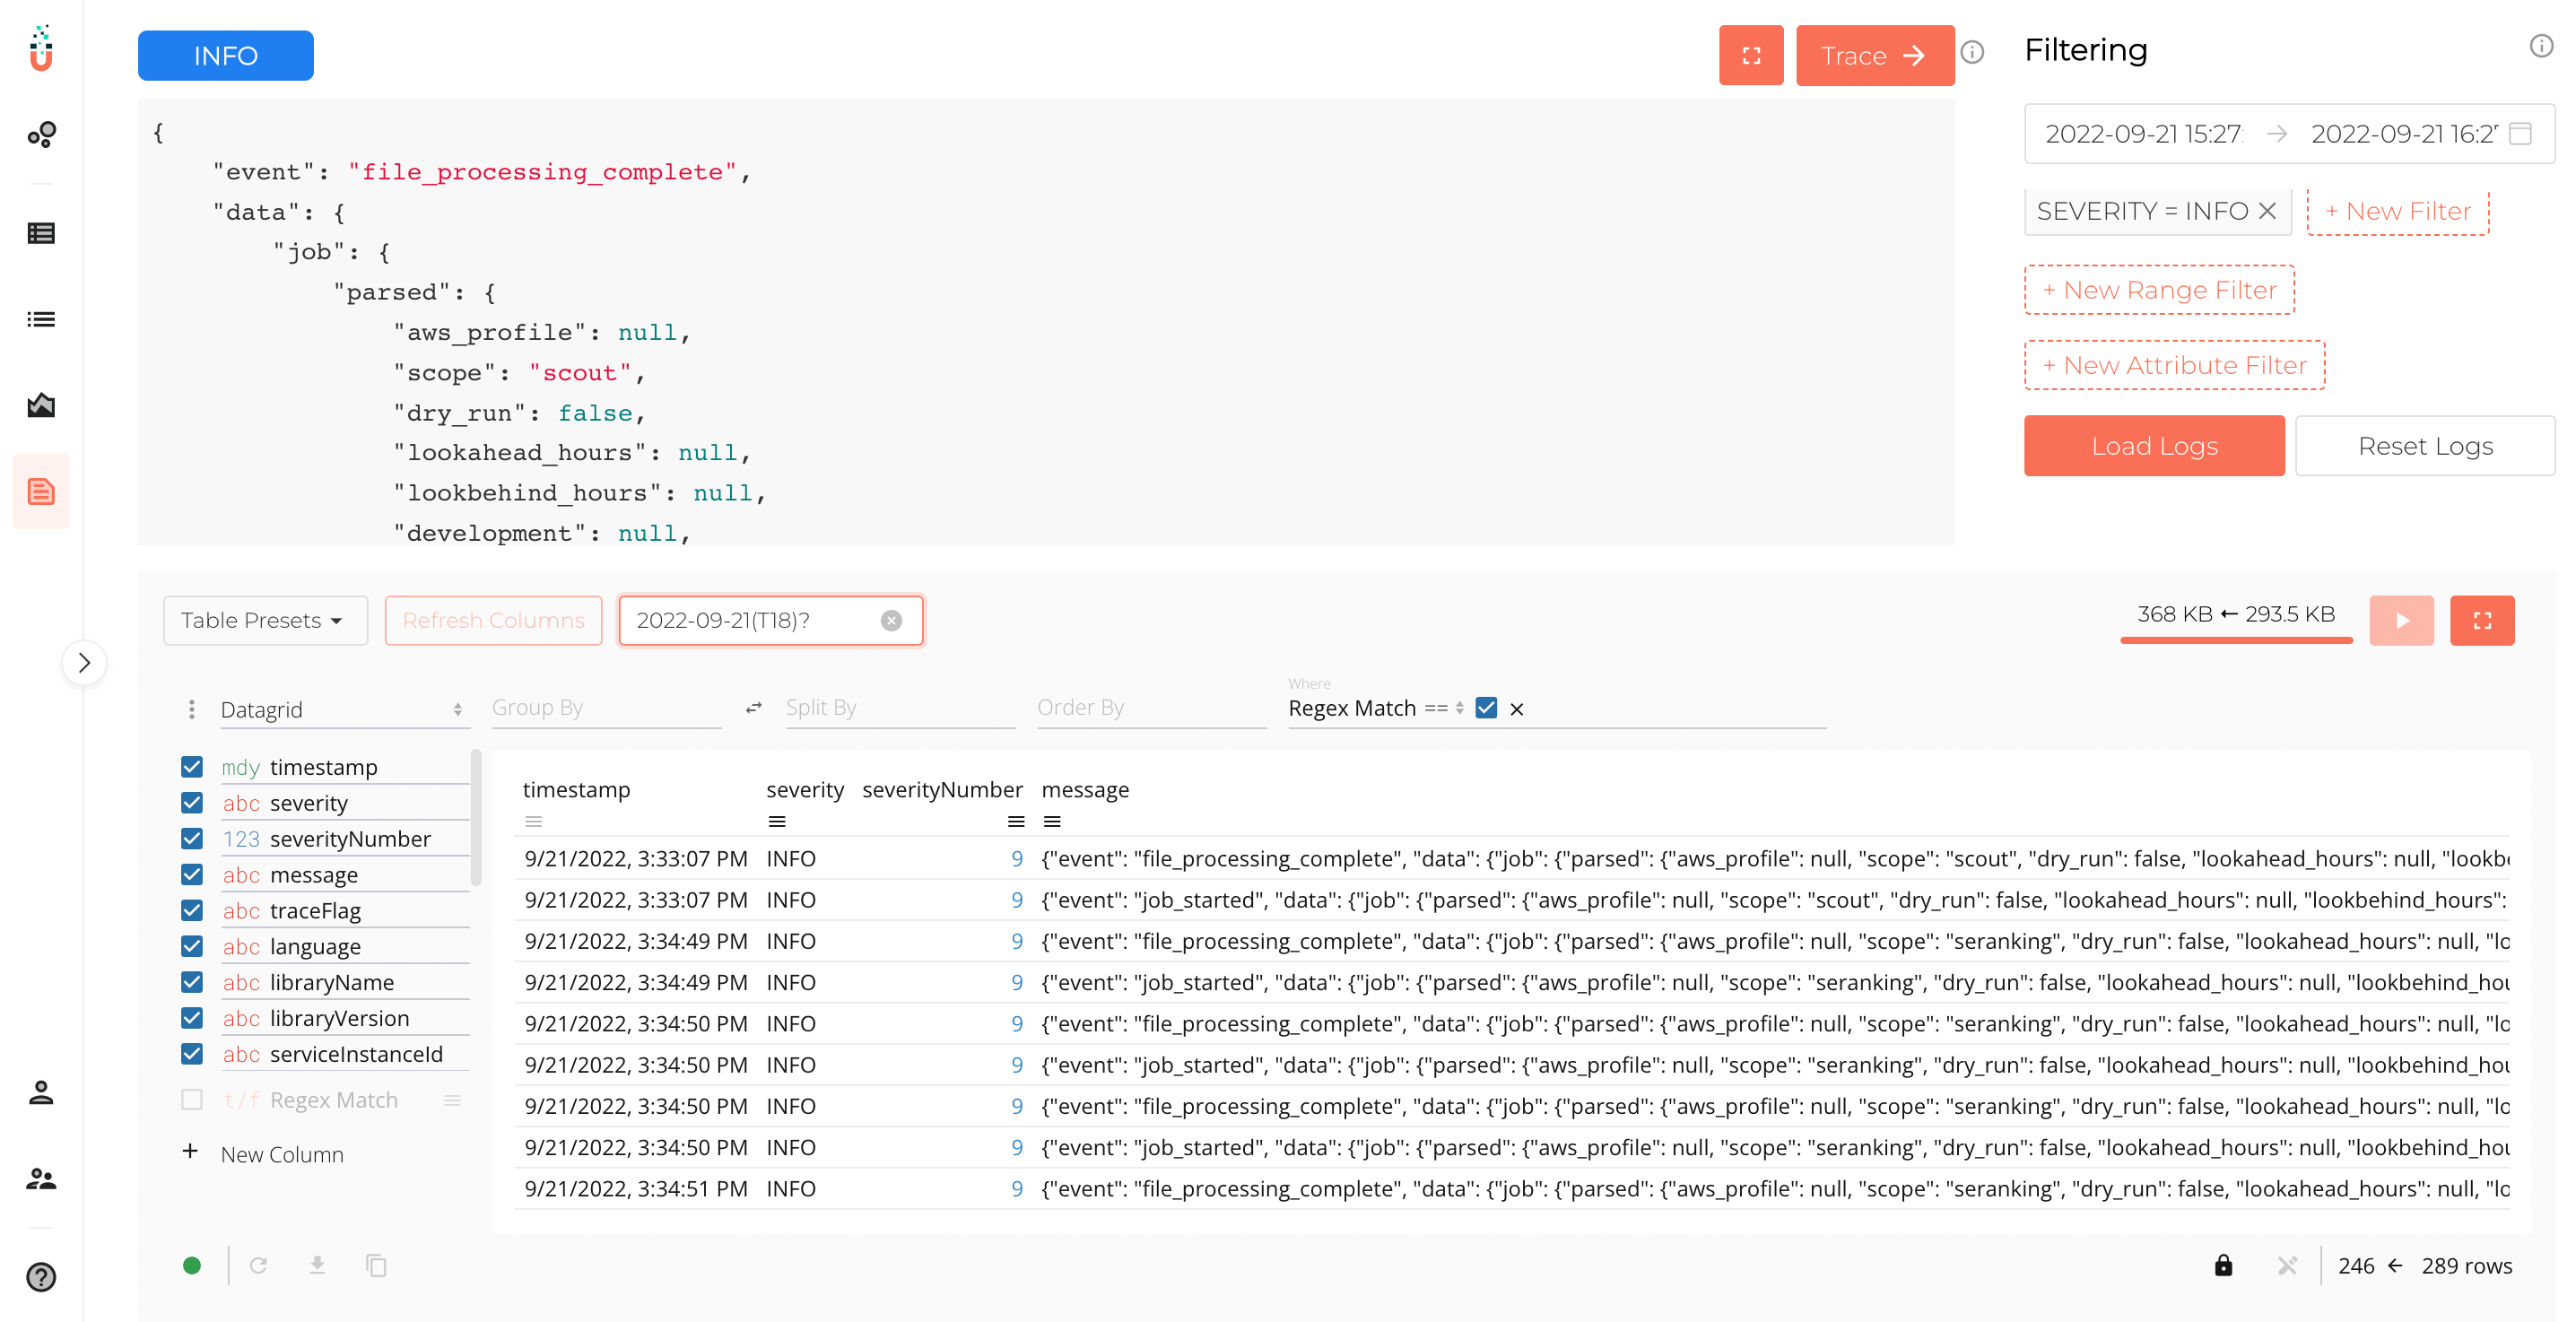
Logs
Logging is a critical piece to any application, so why not get the most of it? Use TelemetryHub’s logging tool to filter both on the backend and in memory to find that piece of information you’re looking for. Whether it be a customer ID or a critical log, our filtering tool can quickly help you get to the desired information. Additionally, go directly to the trace that was associated with the log, adding more context and dimensions to your logging and allowing for quicker resolution.
Metrics
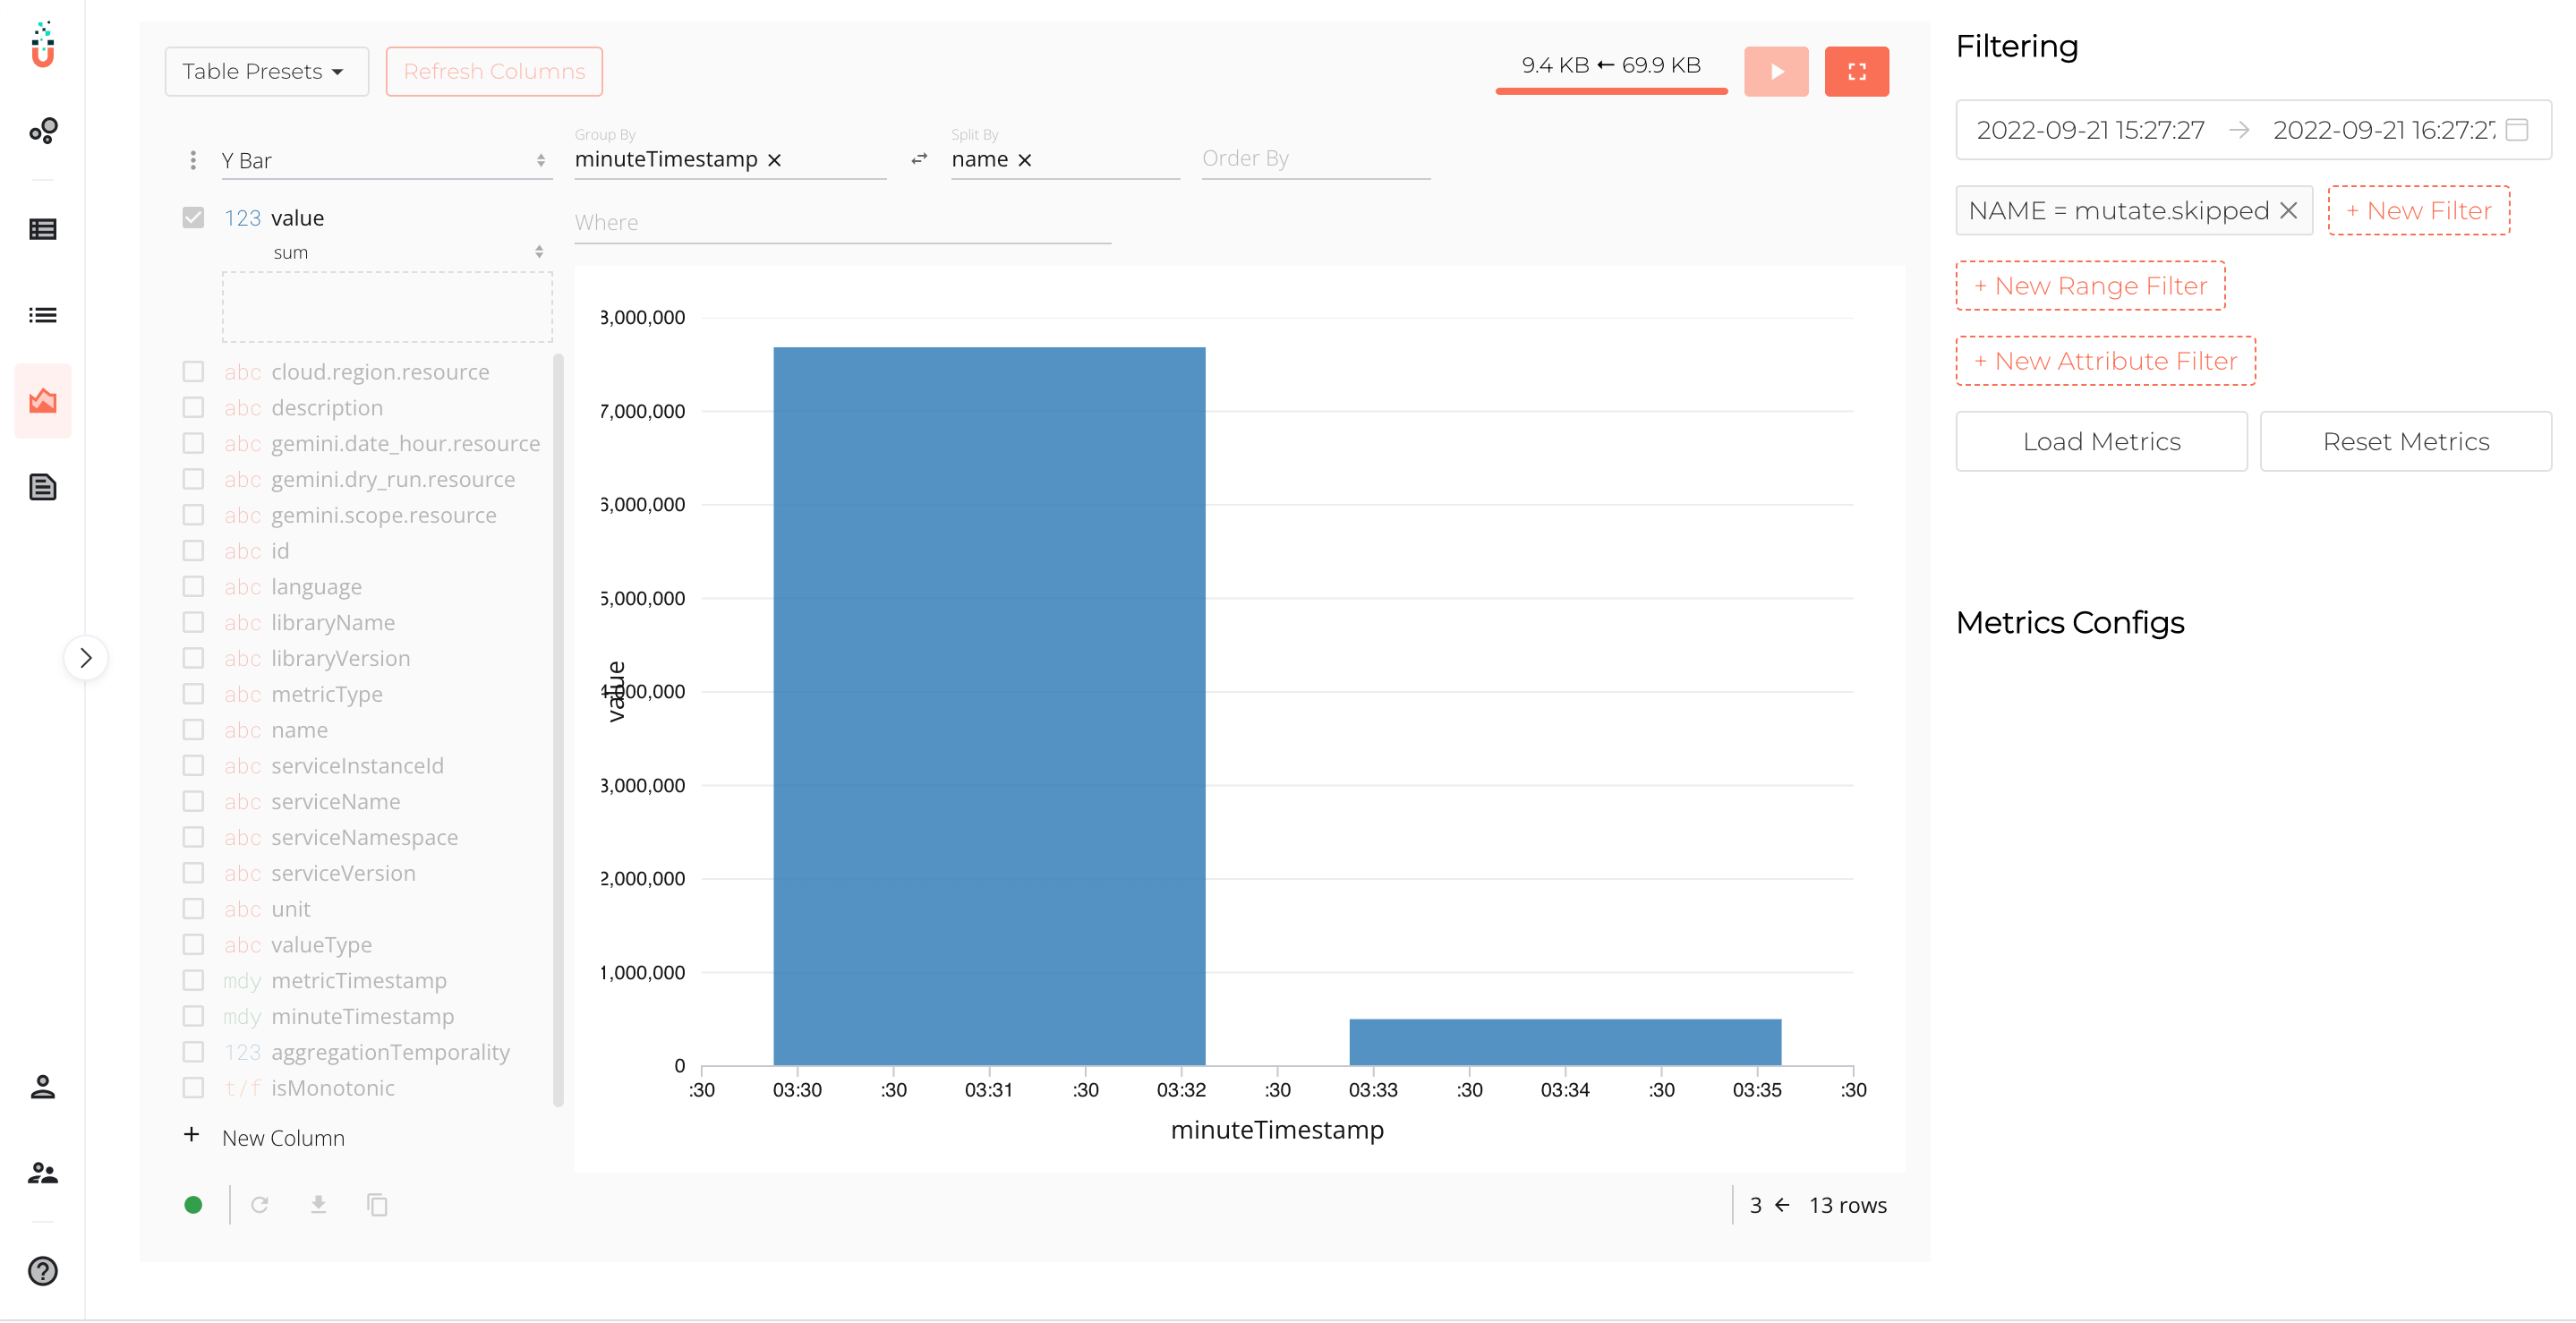
Get quick and visual feedback on the values/metrics that matter to you most. Being able to understand how things have behaved, and seeing a trajectory can quickly help you understand where you need to go – whether it be understanding when to increase resources, understanding anomaly occurrence, etc.
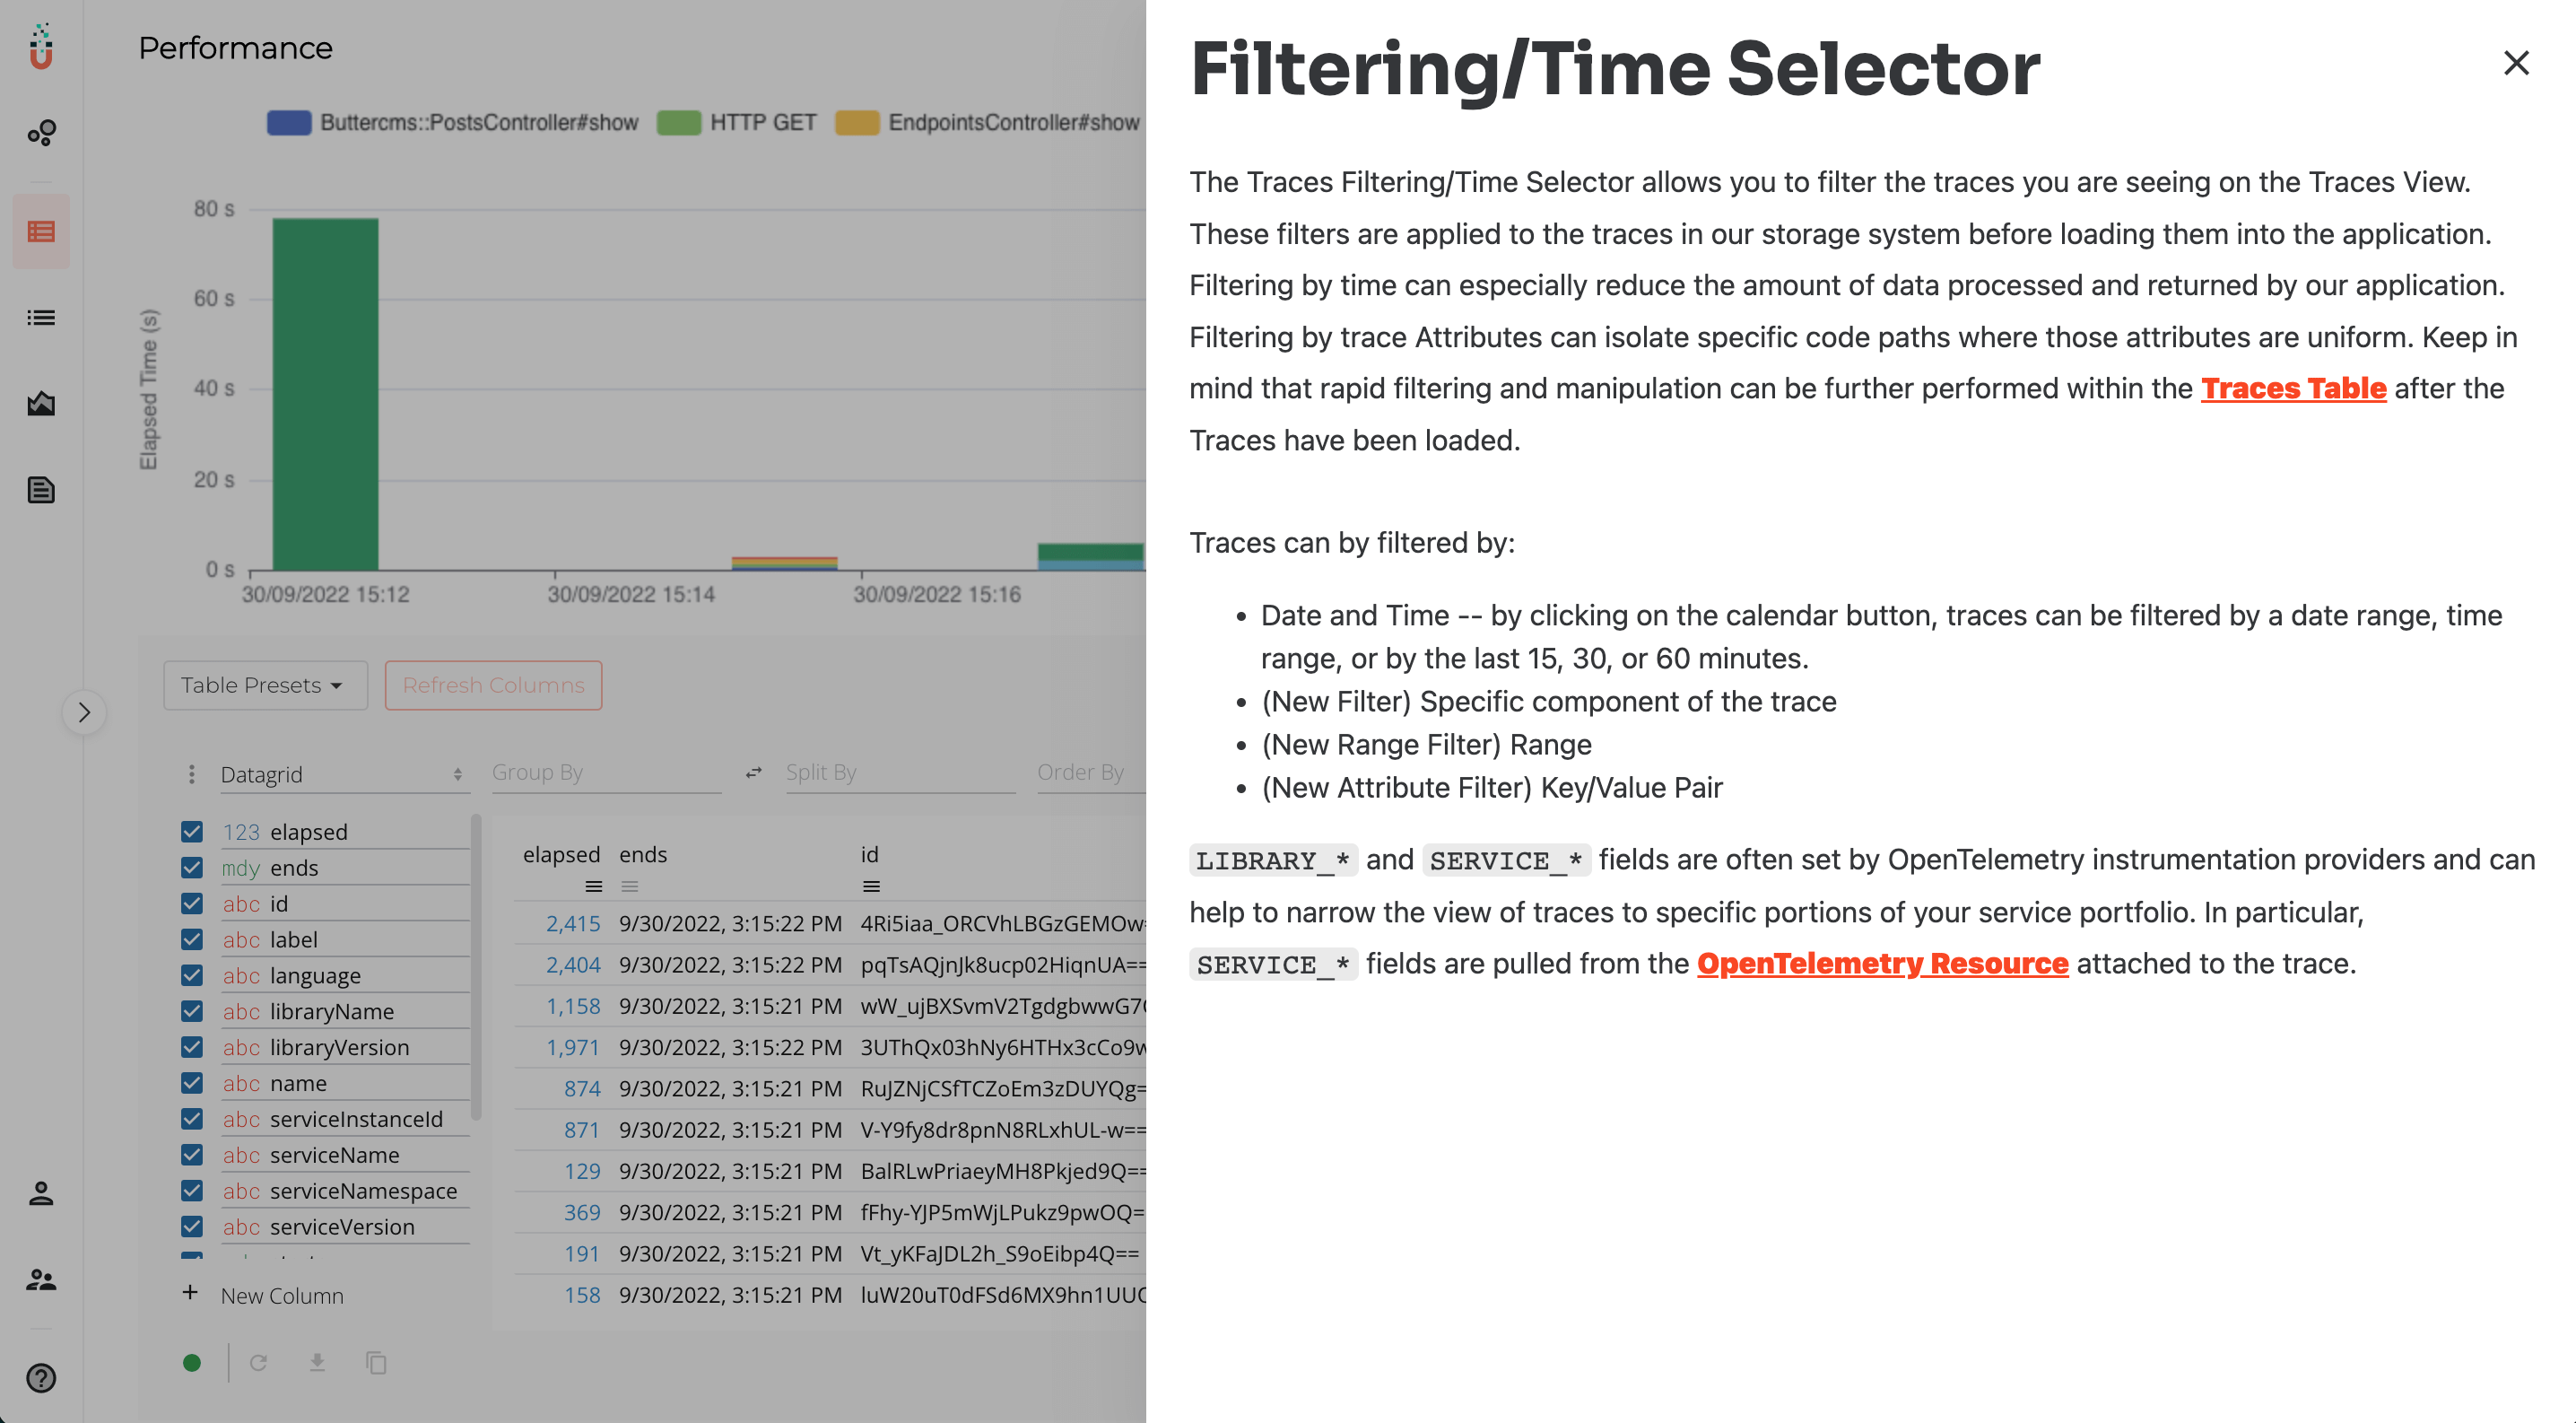
Documentation
Get the information you want right when you need it. We have built a powerful in app (as well as external) documentation engine to get you the answers you seek. Enabling you to get the most out of your monitoring solution.
Administration
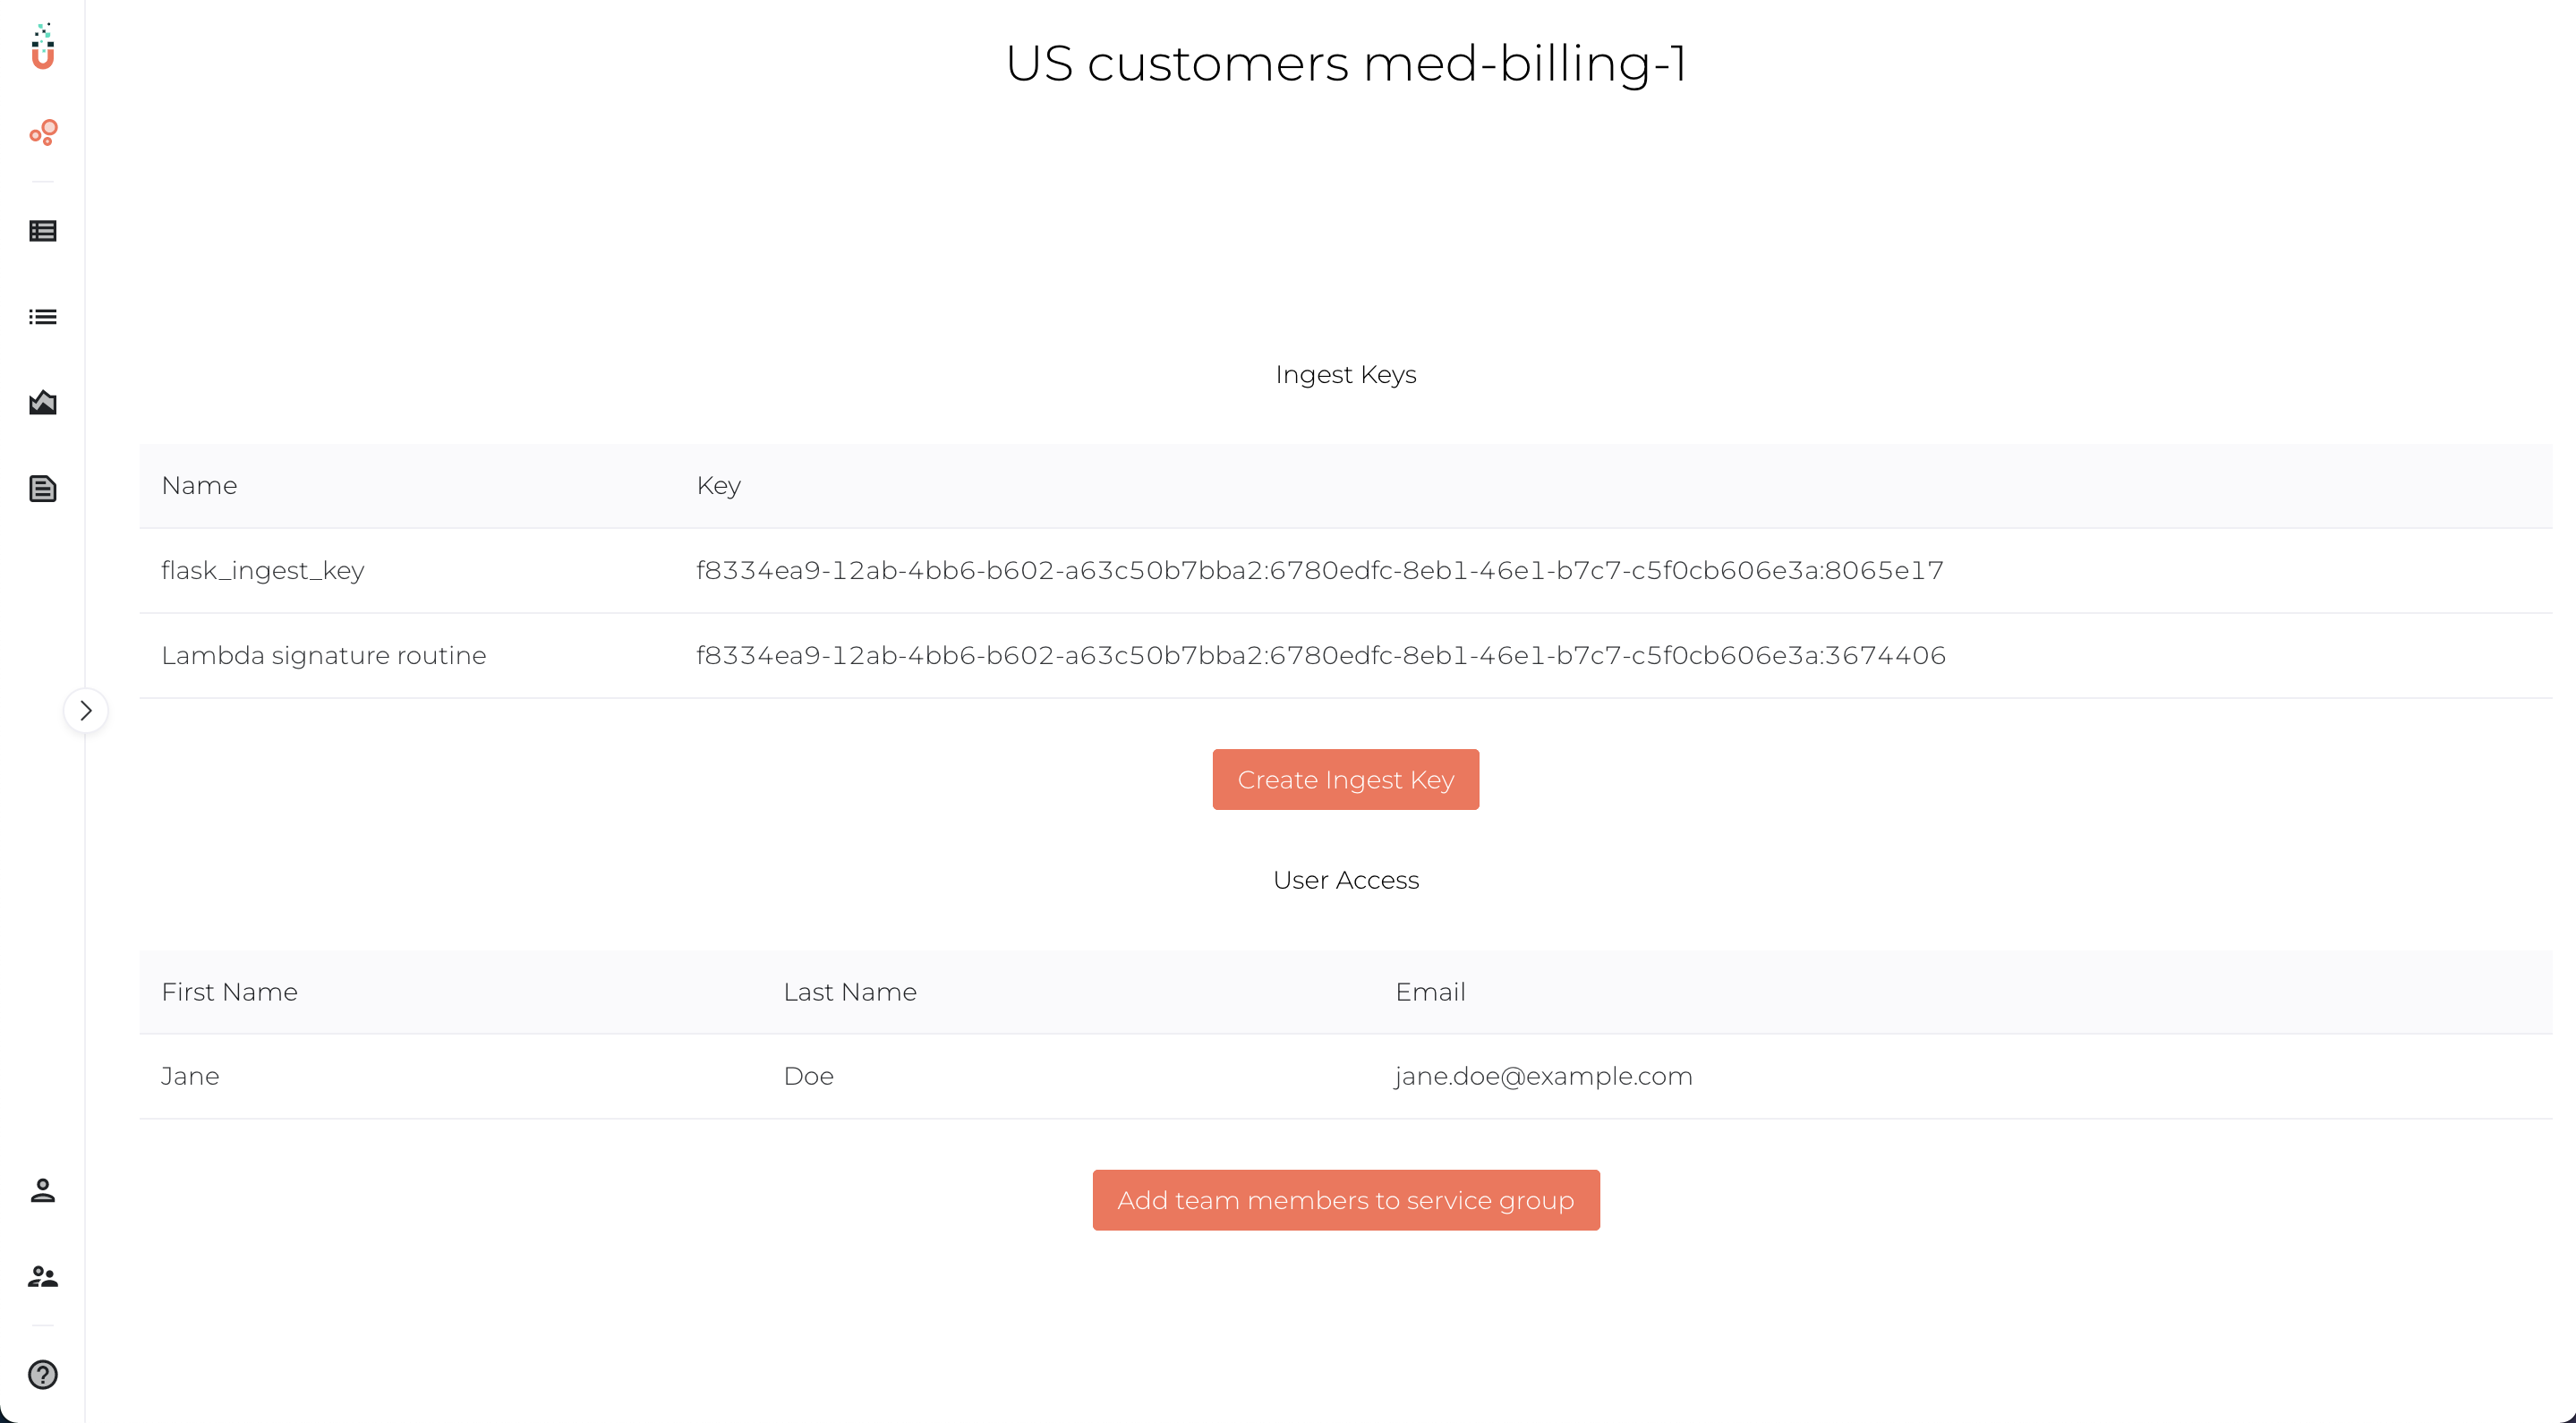
Have many services that interact with each other and delegating from where the problem arises is a game of hot potato? No problem!
Create as many service groups as you require with the ability to limit who has access to which service group in your organization.
Usage
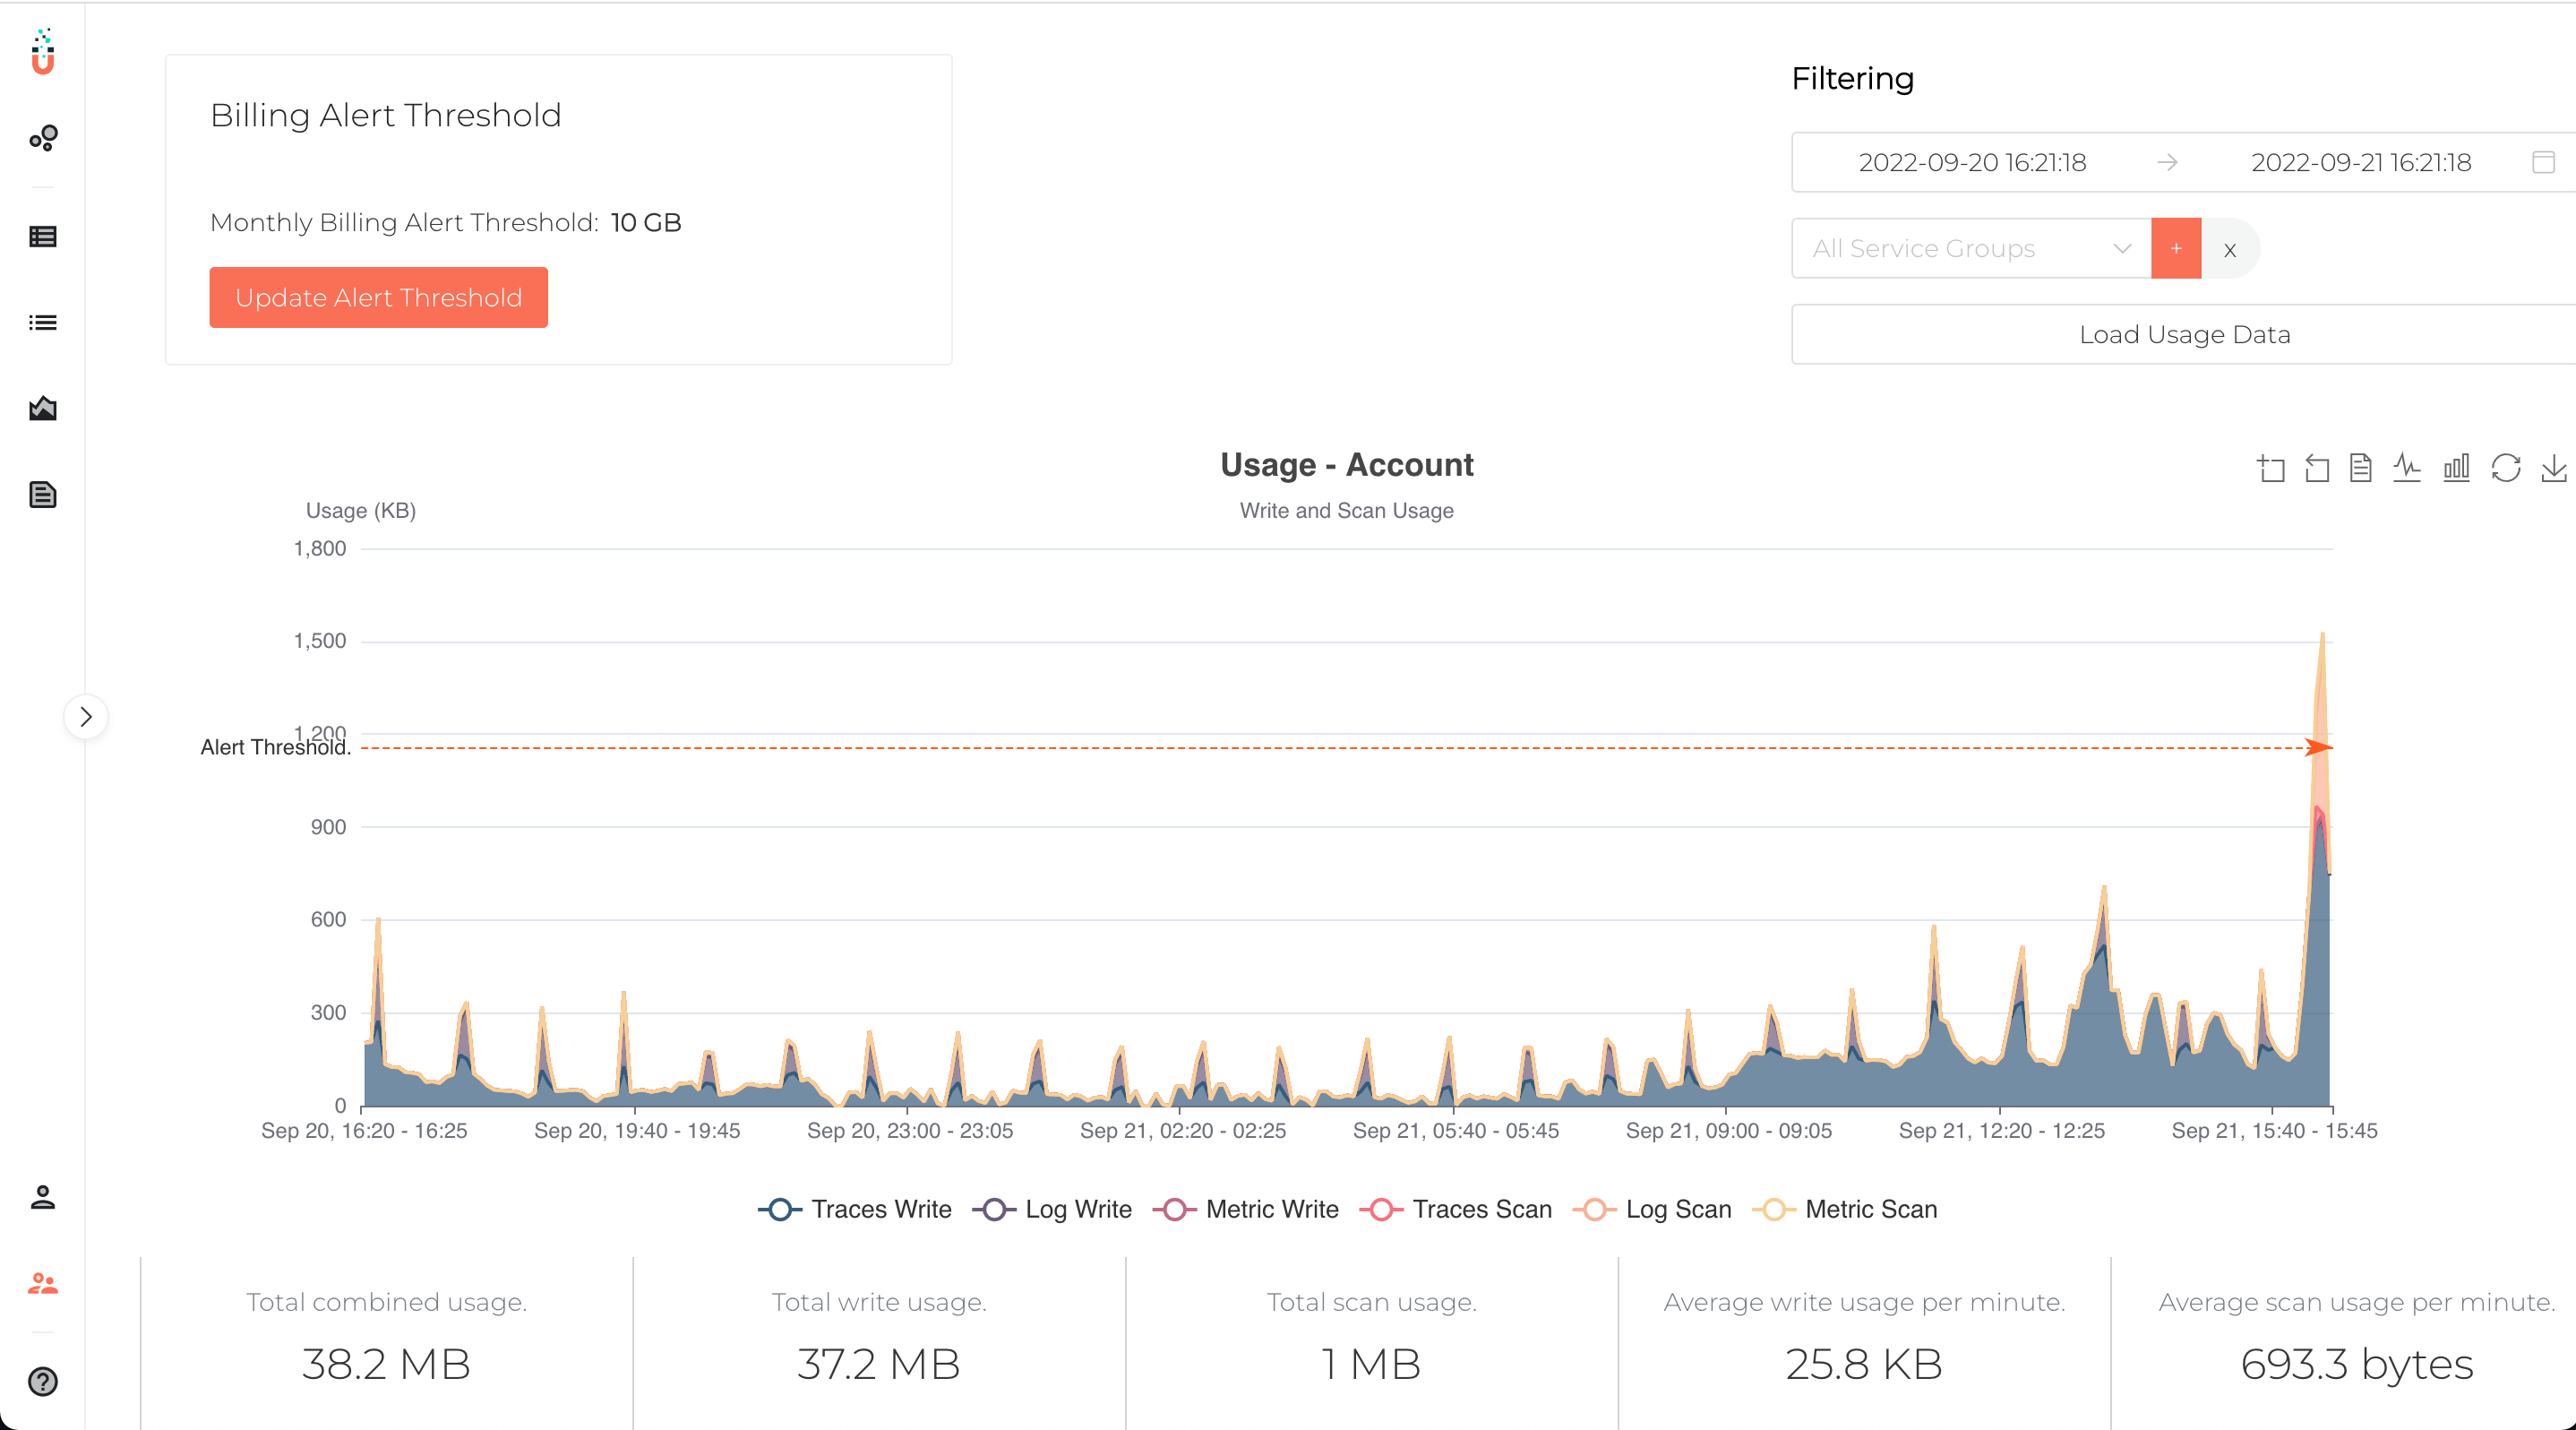
Get fast insights into the amount of data your account, or any particular service group, is utilizing. With predictive look ahead billing alerts, get notified of when it appears your usage is going to be out of bounds.
Early Access
Interested in trying out TelemetryHub? Good news! We offer a free trial upon sign up. Learn more about the free trial and our pricing at: https://telemetryhub.com/plans-pricing/
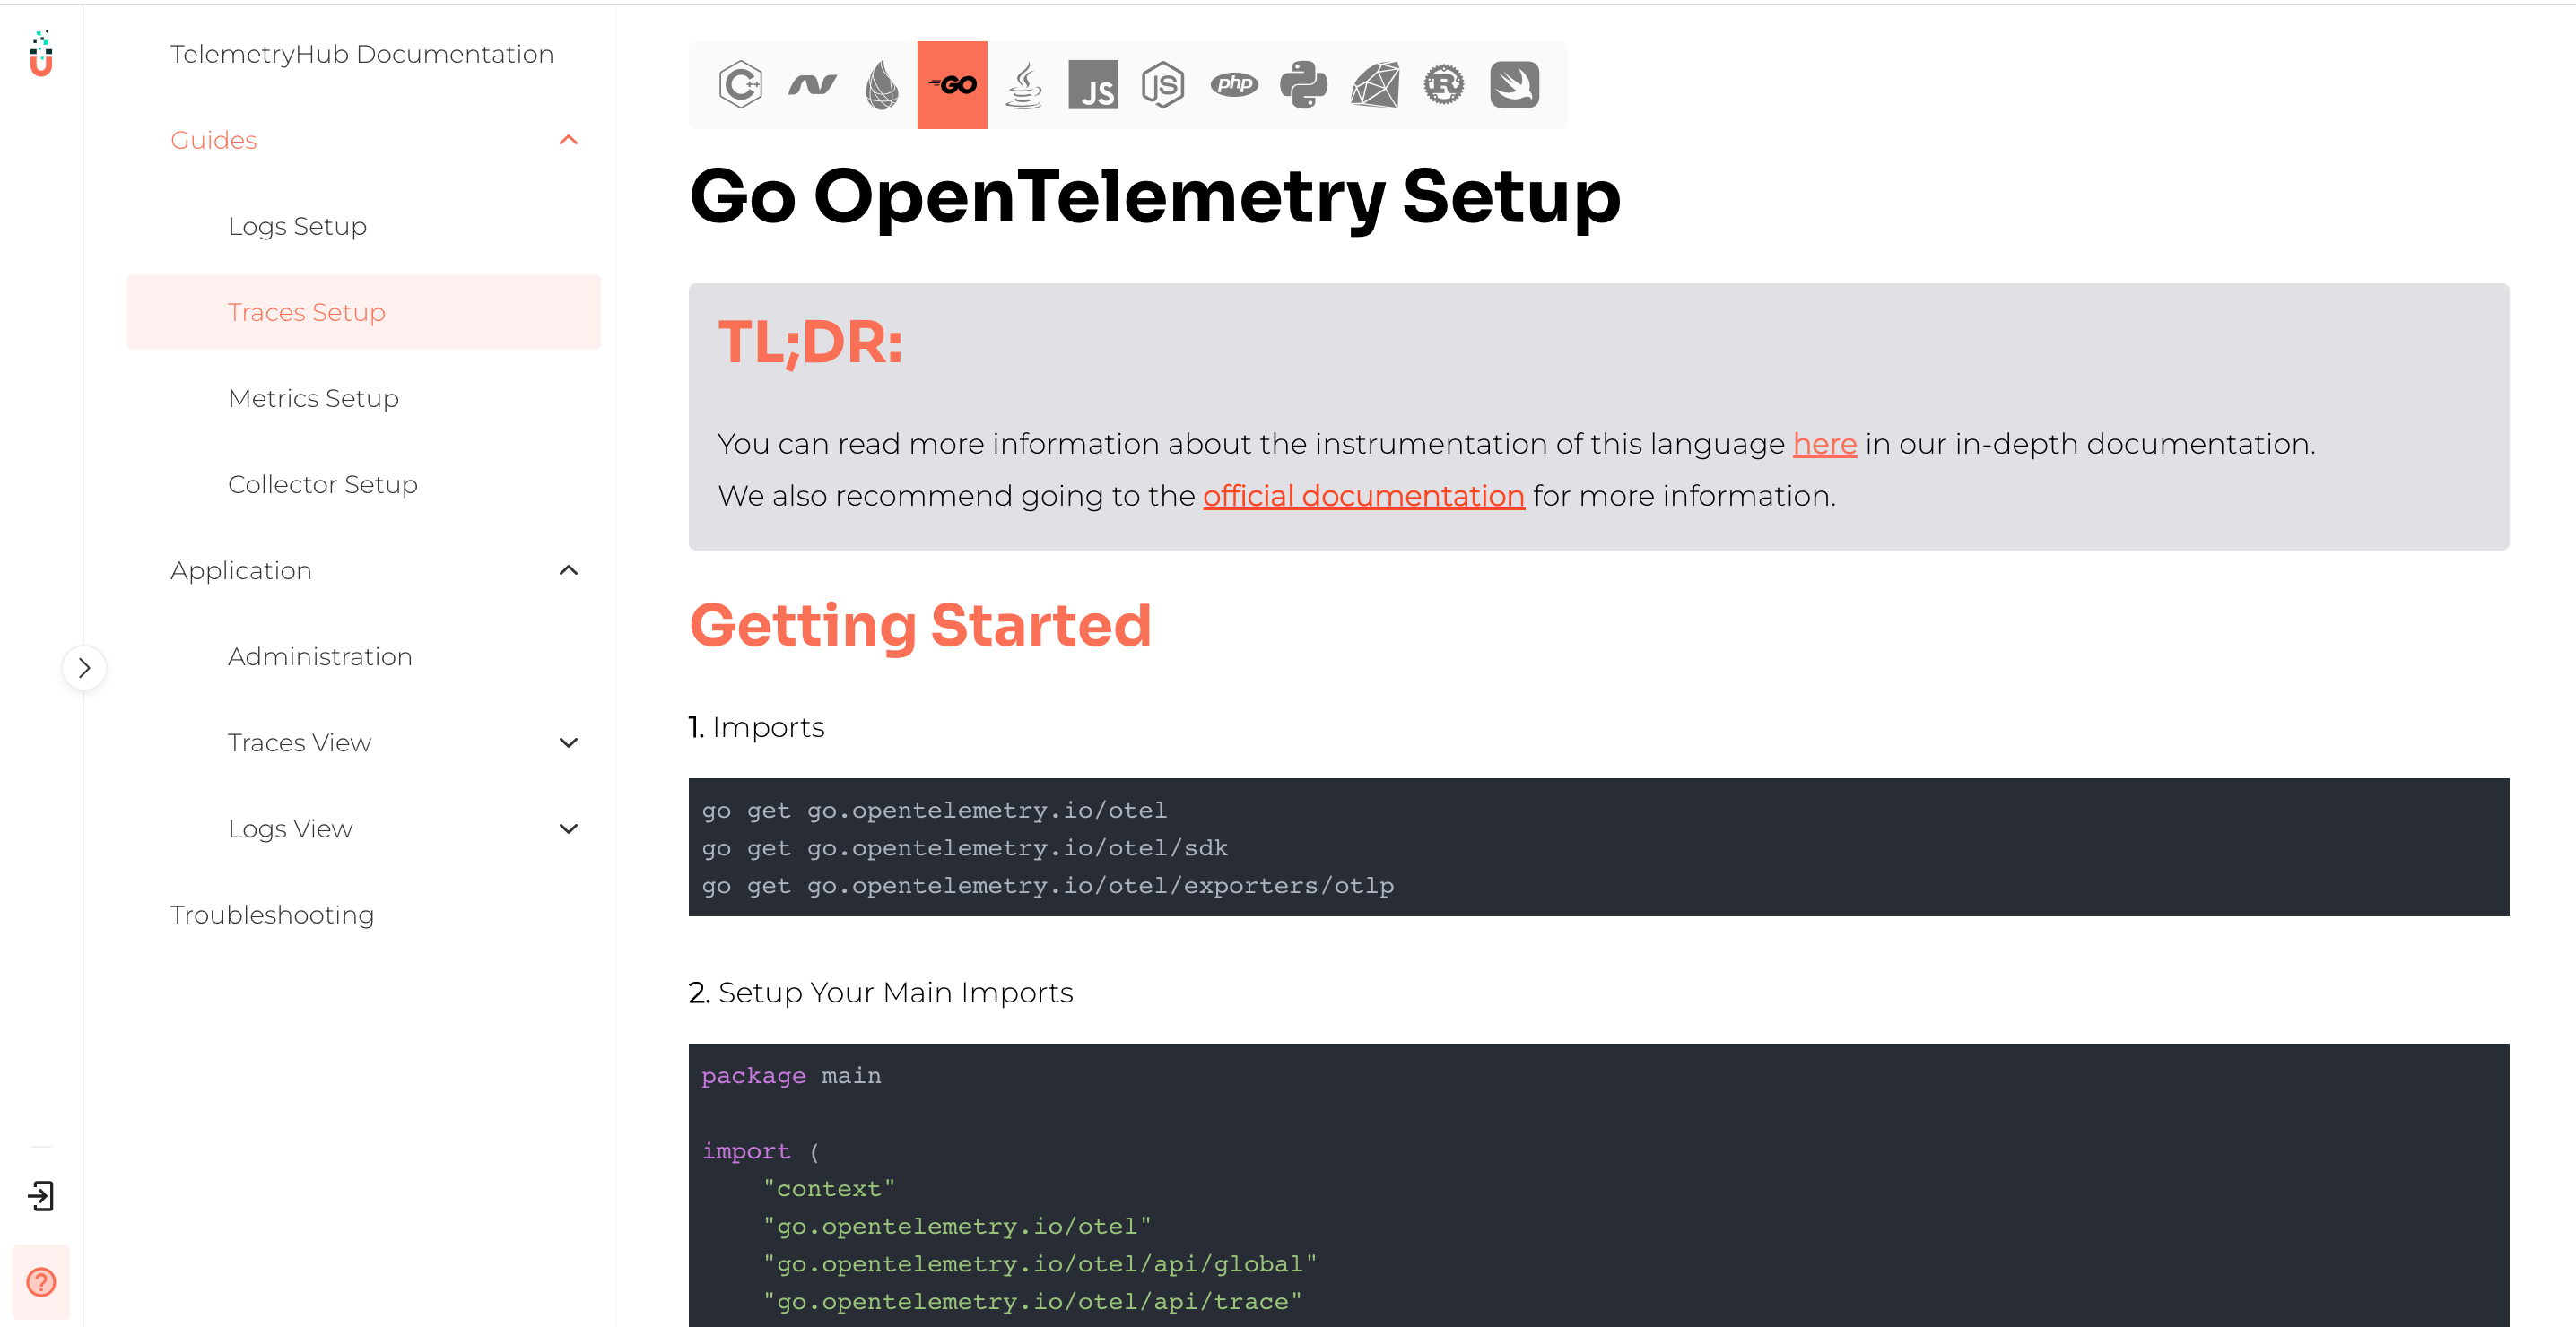
Ready to jump in? View our documentation page and get started on the future of observability today: https://app.telemetryhub.com/docs
Also, visit our blog for more information on why Scout is all in on OpenTelemetry:
What is OpenTelemetry and Why is Scout All In?
Want to learn more? Interested in a demo?
Reach out to support@scoutapm.com and ask us questions about our product and where observability is heading!
