Efficiently Managing Ruby Memory Usage
 Scout APM
on
May 31, 2023
Scout APM
on
May 31, 2023

Even the most prominent and reliable frameworks are notorious for burning out resources if not configured perfectly. In this post, we are about to take a look at how Ruby, one of the most prominent programming languages and an awesome web application alternative when combined with Rails, manages memory, and how you can make it perform even better.
Ruby is a scripting language built for use in web applications and similar stuff. The term “scripted” affirms the presence of a ruby interpreter, which basically translates your code line by line into machine-understandable form. In this post, we are going to cover the language’s memory management systems in great detail.
Understanding the Fundamentals of Ruby Memory Management
Memory in Ruby revolves around a certain set of factors, which as a whole manage the judicious use of system resources. Primarily, memory management relies on the Ruby runtime, the host operating system, and the system kernel. Apart from these, the runtime garbage collection also plays an important role in determining how memory is managed and recycled.
Ruby
Ruby organizes objects into segments called heap pages. The heap space is divided into used (Eden) and empty (Tomb) heap pages. When trying to create new objects, Ruby looks for free space in the Eden pages first; if no space is found empty, only then does it take a page from the Tomb.
Heap pages are split into equal-sized slots, allowing one object each, irrespective of its data type. Now these slots can be free or occupied, and when Ruby is looking to allocate a new object a slot, it looks for a free one (from the Eden pages). If a slot could not be found, then Ruby allocates a new heap page altogether (from the Tomb). When the object goes into garbage collection, the heap pages used by it are added back to the Tomb.
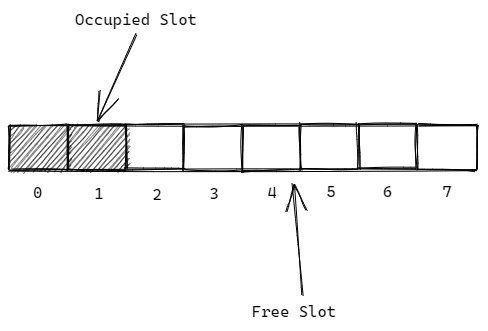
Slots are small memory locations, nearly 40 bytes each. It is evident that not all kinds of data would fit in them, so to deal with this issue, Ruby stores any overflowing information in a different location outside the heap page, and stores a pointer in the slot that can be used to locate the external information.
All of the allocation in the Ruby runtime, including the allocation of heap pages and external data with pointers, is done by the system’s memory allocator.
Operating System
Memory allocation calls are handled by the host operating system’s memory allocator. Generally, it is a bunch of C functions, namely ‘malloc’, ‘calloc’, ‘realloc’, and ‘free’. Let's quickly run through each one of them to understand what they do.
Malloc
Malloc stands for ‘memory allocation’, and it does just that. It takes in the size of the memory to be allocated, finds an empty bunch on the RAM which just fits, and returns a pointer to the starting index of the allocated memory. Following this, it's totally up to you to make sure that you stick inside the size that you’ve been allotted with the pointer, or else unexpected things are bound to happen.
Calloc
Calloc stands for ‘contiguous allocation’, and it allows you to allocate consecutive blocks of memory at once. It comes really handy when handling arrays of variables whose unit sizes are well-known. It also returns a pointer to the starting index of the allocated memory.
Realloc
Realloc stands for ‘re-allocation’, meaning, it is used to re-allocate memory that was previously allocated, with a new size. This, however, requires that you know beforehand, the required amount of memory, and adapt it based on runtime conditions.
Free
As obvious as it sounds, the ‘free’ function is used to clear out any pre-allocated set of memory locations. It takes in a pointer to the starting index of the memory location that has to be freed up.
Kernel
As evident already, the memory allocation by the operating system has to be performed for varying sizes, which brings a whole new set of problems with itself. This memory allocation is carried out by the system kernel, which can only allocate chunks of 4 KBs of memory, called pages. Also, invoking this level of memory management is really expensive; so in order to minimize kernel calls, the memory allocators always try to allocate more memory than is actually needed.
Garbage Collection
The garbage collection scheme used in a runtime greatly affects how well the available memory is utilized by the environment. Luckily, Ruby has a pretty advanced garbage collection system that utilizes all of the above-mentioned API calls to ensure that the application has access to the appropriate amount of memory to carry out its activities properly.
An interesting thing to note about Ruby’s garbage collection scheme is that it actually stops the entire application to clean the memory! Yes, you read that right. The application is halted to carry out garbage collection. This is done so as to ensure that no objects are allocated any memory while garbage is being collected. As a result, this puts forth a requirement to have super fast garbage collection to ensure top quality application performance.
Determining memory usage
Since the memory is managed at so many different levels, and each level keeps some extra memory to avoid repetitive use of expensive resources, it is safe to say that a lot of memory goes untracked and unutilized in some way or the other.
Command-line tools such as top, which are used to measure a process’s memory usage present the usage from the kernel's point of view. This gives us some insight into how all the other layers have to manually work in sync to maintain efficient use of memory.
With the traditional mark-and-sweep approach, reinforced by incremental cleaning and alternative allocation, Ruby’s garbage collector has been highly improved over the years by Ruby’s creators. However, our focus is to understand what can still beat this super-optimized mechanism?
Addressing Common Ruby Memory Issues
Even with the presence of an advanced garbage collection and heap paging mechanism, memory management in Ruby can still raise concerns if not handled properly. Some common issues include memory bloat, memory fragmentation, memory leaks, etc. Let's take a look at each one of these in detail, and try to figure out how to avoid them.
Memory Fragmentation
Memory fragmentation is a common issue in memory systems, and is a result of unmanaged use of memory blocks over long periods of time. Since memory is allocated to objects in small chunks, when parts of the memory are freed, only that particular chunk or slot is released. This means that sometimes you might have some empty slots spread across the heap page, but not a contiguous block of free memory that could have been utilized to allocate to a new object.
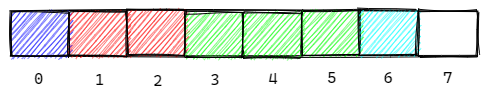
For example, let’s say a total of 7 out of 8 available slots from a heap page were allocated during a run of a certain program. The page would look something like this:
Each color here represents a block of memory allocated on a certain request, which may or may not be of one slot in length. Let's imagine that during the course of the program, some of these blocks were freed. Let’s suppose that the page now looks like this:
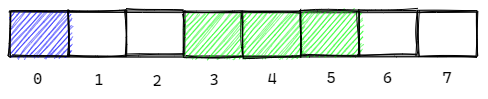
Now, if we were to allocate memory to a block containing 4 slots, we would be unable to do so even though we clearly have 4 distinct slots available. This is what fragmentation does to available memory.
As we saw that Ruby at its own level manages memory in the form of heap pages which contain slots, it is pretty evident that it becomes really unlikely that an entire heap page may ever become free after a few garbage collection life-cycles. This will prevent the heap page from going back into the Tomb section, from where they can be reallocated. This would mean that even though Ruby would have free memory slots, memory allocator and kernel would assume them to be used, as they would not be in the Tomb region.
At the kernel level, this is an even bigger problem. The memory allocator can not release any OS page unless all allocations made on that page have been freed. This can lead to situations in which there are lots of free slots in the heaps, but not many OS pages that are free. If you’re really unlucky, you might end up in a situation in which there are many sets of free slots scattered around the memory, but none can meet your new allocation request’s requirements. What happens then? An entire OS heap is allocated, bringing in more unnecessary and unused slots.
How to fix this? There are a number of measures that can be adopted as developers to curb the presence of memory fragmentation. Here are some of them -
- Try to do all of your static allocations in one big block. If you can get all your permanent classes and data to wind up on the same heap pages, a lot of other pages will be free for longer times compared to the usual scenario. This can make your fragmentation ratio significantly better.
- For big dynamic allocations, try to do all of them at the beginning of the code. This will make it easier for the slots to be allocated closer to your bigger block of static allocations, and might also give you more freed pages for later requests.
- If you declare a reference to some object that uses memory, make sure to dispose of it when its job is done. This is a great way to ensure that memory is not withheld unnecessarily.
- If you have a cache that’s small and never cleared, try to club it with the permanent allocations in the beginning, or remove it altogether.
Memory Leaks
Memory leaks are scenarios in which allocated memory slots are not freed up after they have been used. This results in more and more slots being allocated as the code keeps running. A naive example to understand the situation better can be:
arr = [ ]
b = { }

loop {
 sleep(1)

 20_000.times { arr << "apm" }

 puts GC.stat(b)[:heap_live_slots]
}
This creates 20,000 strings every second and prints an object count:
285051
295052
305053
315054
325055
335056
345057
The count keeps going up because the garbage collector is unable to collect the strings that are continuously being added to the array, as they are referenced by the array (arr), and never go out of scope. Otherwise, the garbage collector would have been able to collect these and the numbers would stay in the expected ranges.
This situation typically arises when referring to a dynamically allocated block of memory is lost, and thus the slot becomes unreachable. To counter this, garbage collectors of many languages automatically recycle slots that are not referenced anymore, assuming that they are not useful anymore. However, in such situations, dereferencing a slot to declare it ready for garbage collection becomes important, and lack of such dereferencing often results in a memory overuse, as the garbage collector still takes such slots to be useful, even though they are not.
As apparent, the best solution here is to code sensibly. Use a memory profiler to monitor your app’s memory consumption, and then identify the resources/variables that are not being properly disposed of and dereferenced, and fix them accordingly.
An alternate solution: jemalloc
In cases where you are handling memory properly on your end but still facing memory leaks, it might be safe to blame the memory allocator methods. Ruby traditionally uses malloc calls to allocate, free, and re-allocate memories, as mentioned previously. An alternate implementation of these methods is jemalloc, developed by Jason Evans, which appears to be more effective at managing memory compared to other allocators, mainly due to its emphasis on fragmentation avoidance, heap profiling, and extensive monitoring/tuning hooks.
Its installation is pretty straightforward -
gem 'jemalloc'Simply add the above to your Gemfile and bundle install.
Now you can try re-running the memory profilers and observe the change in your app’s memory consumption.
Memory Bloat
While memory leak centers around unfreed objects piling up, memory bloat is more about unplanned memory allocation in code. This issue does not originate from the runtime environment or bad memory management, but instead from too many objects being allocated memory at once. It is denoted by a spike in the memory vs time graph. This is how a usual memory bloat incident appears on the scale:
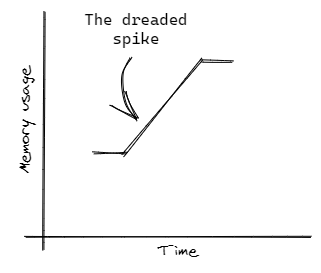
This spike might seem harmless at first, but it is important to note that the pace at which memory is freed can never match the pace at which it is allocated. Due to constraints like fragmentation, memory deallocation is always slower than allocation. This results in a greater than normal amount of memory being used by the application throughout its life-cycle, and greatly affects its performance.
There’s no “one size fits all” kind of solution for this, but a good process to follow can be to use a ruby memory profiler to identify the code block causing the spike, and then refactor your code to utilize memory more efficiently. We will discuss in a later section how an application monitoring (APM) tool like Scout APM can save the day in such situations.
Memory Leaks vs Memory Bloat
Memory bloat is better defined as a sharp increase in memory usage, due to an increase in the number of simultaneous object allocations. As quoted in the Scout APM Book, memory bloat is a more time-sensitive issue as compared to a memory leak.
Memory leaks, however, are more about memory-intensive objects not being recycled properly at the end of their use. A comparative visualization can help understand the difference between the two better:
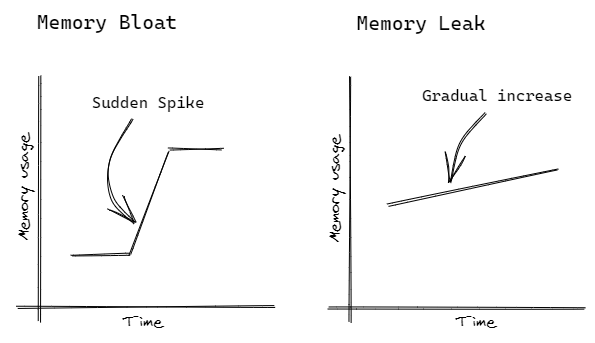
As can be seen, memory bloats are the result of a steep increase in memory usage, likely caused by lines of code that allocate way too much memory at once. This can not be fixed by restarting the code, as the spike will again manifest in the next run. On the other hand, in the case of memory leaks, memory usage grows gradually over time, with more and more iterations of the code. If you restart the runtime, the entire memory stack will be refreshed, starting from the beginning, so the memory usage will also start from zero. However, as temporary as this solution may be, it's still effective in handling memory leaks suddenly discovered in production environments.
Memory leaks are a little less likely to occur in the latest versions of Ruby, as it’s garbage collector is now intelligent enough to dispose of objects that can be deemed unnecessary after a certain point in time. However, the risk of running into memory bloats is always high, as it depends upon how efficiently the code manages its memory.
A good way of understanding how these two are different is by taking the case of cache. If you observe that your cache is growing steadily over time throughout the life-cycle of your application, it is probably a memory leak. However, if you observe that the cache has been unusually large throughout the life-cycle, it is probably a memory bloat.
Staying Ahead: Monitoring Memory in Ruby Applications
Monitoring memory is a crucial first step in identifying memory issues and determining their causes. Identifying issues is comparatively easier, but isolating their sources can be a tough job. A lot of libraries (Ruby gems) are available that help you track down the usage of memory across time (and code) throughout your application.
You can also use application performance monitoring services, such as Scout APM, to track your application’s memory and other resource usages in real-time, in both production and development environments.
Using ScoutAPM to track performance
Scout can help in identifying memory-sensitive areas of your Ruby app in a number of ways:
- Identifying the controller-actions that generates the greatest amount of allocations.
- Viewing transaction traces of memory-intensive requests to isolate hot-spots and eventually mark them down to lines of code.
- Identifying users who are triggering memory bloats.
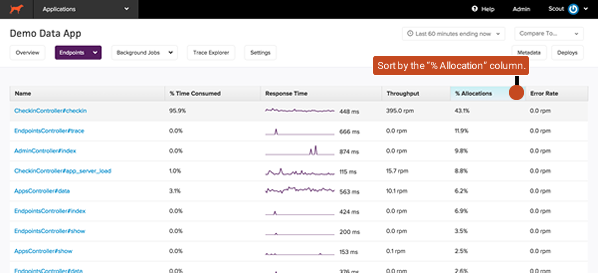
Identifying allocation-heavy activities
The endpoints section of Scout can be a great place to gain a general understanding of which controller-actions are responsible for the biggest amount of memory bloat in your application.
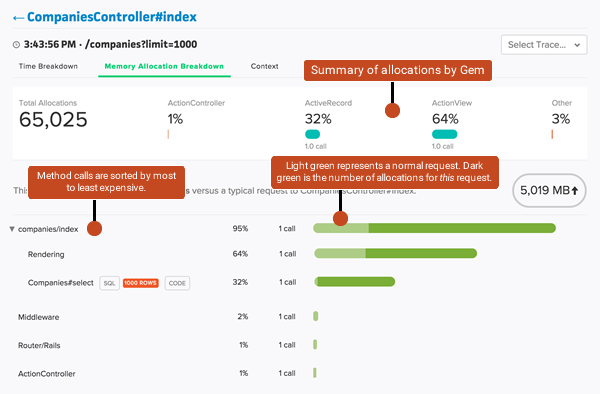
Analyzing a Scout memory trace
As shown below, method calls that are displayed in the trace details are ordered from most to least allocations. The horizontal bars next to the calls count represent the number of allocations associated with the number of calls. The light green shade represents the usual case, whereas the darker green represents the memory bloat case.
Identifying users triggering memory bloat
Scout’s context API can be used to associate your app’s `current_user` with each transaction if it can not be easily identified from a trace URL.
Measure Ruby Memory Allocation
The Memory Profiler gem is an effective way of tracking the memory usage of ruby code.
Here’s a sample code to help get you started:
require "memory_profiler"
require "yaml"

mappings = nil

report = MemoryProfiler.report do
 mappings = YAML.load_file("./config/mappings.yml")
end

report.pretty_print
This will give you a result similar to:
Total allocated: 2069188 bytes (21455 objects)
Total allocated: 584820 bytes (6825 objects)
Also, to check if you have a memory leak in an environment, you can try running:
bundle exec derailed exec perf:mem_over_timeThis command will send a bunch of requests to your application, and track memory usage over time. In case of a memory leak, the memory usage will keep on increasing over time. If there’s no leak, you’ll observe the usage increase gradually until it hits a plateau, and totals out.
For other Ruby profiling tools, follow the link to our article here.
Memory Doesn’t Have to Be a Mystery
It is not possible to never face any issue with Ruby memory management. However, this does not mean that memory has to be a mystery to the people who handle it. While it may be a challenging task to monitor each line of code individually to ensure that no resource abuse takes place, it still is important to be able to monitor how your resources are being consumed.
There are methods such as memory profiling to help find out memory issues on the fly. But when real-time applications come into play, even the best would want a solution that provides quick and accurate statistics, with a user-friendly interface. Scout APM does all of that, and tops the APM charts by providing timely summaries of your app’s performance, specifically isolating Ruby memory bloat, tracking N+1 queries, and much more at a very low overhead.


