How Common Application Issues Kill Performance

In the modern era of digital businesses, web applications need to deliver on several grounds–performance, user experience, robustness, and scalability. However, many developers might agree that performance is of the utmost importance in any software application.
The bells and whistles of a fancy UI and extensive functionalities can sometimes force performance to take the back seat. Additionally, there are a lot of reasons for performance to degrade over time.
As web applications scale and grow, several performance-limiting factors start coming into the picture and make things difficult. In this post, we’ll take a closer look at some of the most common application performance issues, and try to understand why they happen, and how they can be tackled.
Slow Response time
One of the most common issues that can severely affect application performance is slow request or response time. This can be due to multiple reasons -
- Sudden spike in traffic: For example, in the case of a flash sale offered by your website, you are likely to see a sudden spike in traffic. If your server resources are not enough, it can easily slow down response time.
- Requests consuming more resources than required: Quite often, you’ll find that a particular request in your application is consuming more resources than it should, for example – in the event of a memory leak, or because of slow database queries. We’ll dive deeper into this in a later section of this post.
- Lack of caching solution: Caching allows your website content to reach users faster. A good example of this is a Content Delivery Network (CDN) that caches the application to a proxy server closest to the end-user to deliver content more quickly.
- Poor server hosting: Poor or suboptimal web hosting can be another reason for your app’s response time taking a hit. For example, if you have hosted your application on a server shared among a bunch of other web applications, it is quite likely to lead to increased response times.
For some context - Google's PageSpeed Insights recommends an ideal server response time to be under 200 milliseconds.
Memory Leaks
In simple words, a memory leak happens when a part of your code is continuing to consume more memory than it needs, instead of releasing it.
Here’s a more detailed explanation - when your application executes your code, it creates multiple object references for your variables and assigns memory to them. Once it is done with the execution involving those objects, the garbage collector scans object graphs and checks which parts of the process are not being used. It then pulls them out and frees up the memory. In certain cases, some of those objects might continue to consume memory even though they are no longer required. Memory leaks like this are usually caused by inefficient code in your application.
Database deadlock
Database deadlocks are also known to heavily impact application performance. Before jumping into the reasons for database deadlocks, let's get their meaning out of the way.
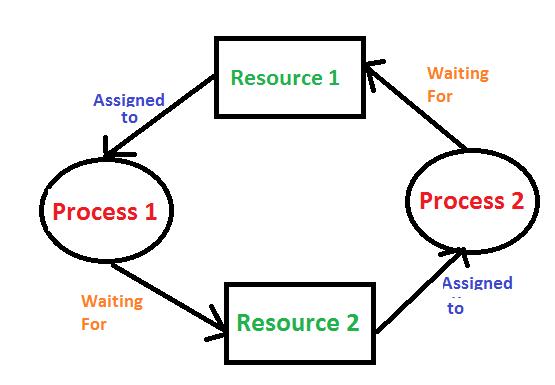
To put it simply, a deadlock happens when two processes are trying to access resources locked by each other.
In the above diagram, Process 1 locks Resource 1 (after acquiring it), and Process 2 locks Resource 2. Now Process 1 is trying to access Resource 2, and Process 2 is trying to access Resource 1, and both are stuck, in what is known as a deadlock.
When a deadlock occurs, the application doesn't respond to incoming requests as the thread is being blocked. Consequently, every request is piled up in the execution loop engine, often causing applications to ultimately crash.
The locked resources that we talked about above could very well be database tables that our applications are working with. When this happens, database transactions and queries to those tables will be blocked. In relational databases, a deadlock like this can sometimes kill the thread and revert the transaction, being quite dangerous. The impact can be extremely high for operations involving sensitive or important information, as in the case of banking transactions.
Why Application Performance Issues Get Worse Over Time
Performance issues are difficult to track in local development environments and usually come to the surface only when deployed to staging or production servers - when opened up to multiple users. Therefore, it can be slightly difficult to analyze code efficiency and real-time application performance in initial development routines. These inefficiencies can easily go unnoticed, and with time, as your application code grows, performance can keep deteriorating - usually exponentially.
Performance issues can also manifest from suboptimal database designs. And just like in most other cases, these issues continue to gradually gain momentum and hamper performance until they become potential roadblocks for your application. For example, a badly designed database might perform well initially (with < 10k records). But as it keeps growing, it can become a serious bottleneck and take a toll on your performance.
Common Slow Burn Performance Issues and How To Troubleshoot Them
Let’s discuss some other, very common performance issues in web applications and see how they can impact your website. We’ll also try to get some sense of how these issues can be tackled by adopting certain good practices and using application performance monitoring (APM) tools.
Poorly Code Quality
Your application’s performance is directly proportional to the quality of the underlying code – if not looked into, it can lead to higher memory consumption, memory leaks, higher response times, etc. Any code that is written without keeping future requirements in mind can cause similar issues.
Troubleshooting
There might not be a metric for directly evaluating code quality, but there sure are several metrics that allow you to quantify its performance – such as response times, throughput, memory consumption, etc. that can serve as good ways of evaluating how efficient your code is. Evaluating such performance metrics is made super easy using APM tools like ScoutAPM that allow developers to spend less time debugging and more time building. Among its many features, such a tool also enables you to isolate suboptimal or faulty controller routes in your app and focus on them to improve performance. Below is a preview of what the APM dashboard looks like, and the several metrics and insights it provides about your application.
Database Growth
Your application’s database gradually ends up being a major chunk of the overall setup. As its number of records grows, there should be prior accommodations configured to handle the scalability. Effective database schemas can go a long way in helping your application scale. This can be achieved through indexing, foreign key references, managing database transactions to maintain data integrity, and many other ways.
Troubleshooting
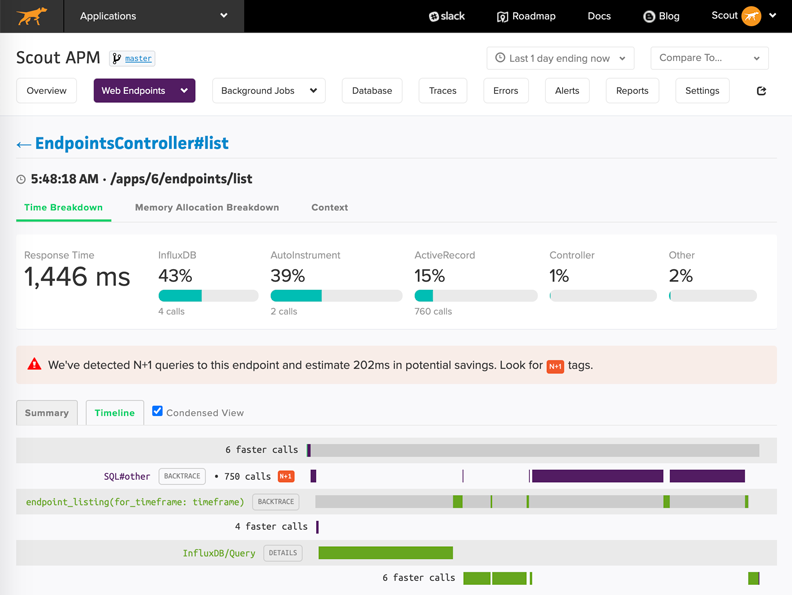
Once database configuration is set properly, it's always recommended to track your database queries’ transaction time and other metrics. Support for database transaction monitoring is another thing that APM tools bring to the table. Below is a preview from ScoutAPM’s dashboard that allows developers to inspect, evaluate, and compare database queries, response times, and memory consumption.
Spikes in Traffic
Depending on your application, it is usually possible to predict events or times of the year that might bring about a notable jump in user traffic. This could be during flash sales, product or feature launches, press coverage, festive seasons, etc.
Such spikes in the traffic can lead to slow servers, delayed server responses, and request timeouts if your application is not prepared – either because of lack of computing capabilities or code that is not optimized to handle many concurrent users.
Increased traffic is usually a good thing for your business. But the inability to deliver during these times can lead to a terrible user experience, making business suffer in a time where it is (ideally) most likely to prosper.
Troubleshooting
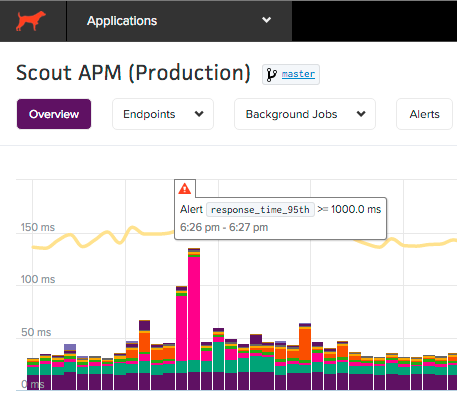
Several APM tools like Scout provide support for live alerts that can notify you about spikes in network traffic, and corresponding dips in response times. This can help developers immediately taking action to ensure the allocation of required compute resources to deal with increased traffic.
Lack of bandwidth
While developing applications, it is important to consider that several users might access the application from low bandwidth networks. Such issues might not be easily noticeable to developers because of decent development environments, as compared to connectivity and bandwidth issues in remote locations. It is however the responsibility of developers to keep such issues in mind and build applications that are light-weight and fast, even on slower network connections.
Troubleshooting
A common reason for websites being slow and unresponsive is the fetching of huge script files and assets from the server. Therefore, it is always considered a good practice to compress/minify your website’s code using common, easily available HTML, CSS, and JS minifiers before hosting it to the cloud. This will mean that your webpage contents will now take lesser time to be downloaded over any network, resulting in a better user experience.
Memory Management – Leaks and Bloats
Memory management is the process of allocating the memory to objects and variables that need it and releasing it when it’s no longer required. There is a difference between memory bloat and memory leak. A memory leak is a gradual increase in (wasteful) memory consumption, whereas, memory bloat is a sharp increase in memory usage due to the allocation of many objects. Visit our other articles to read more about Memory Bloats and Leaks.
If your app is suffering from high memory usage, it’s best to investigate memory bloat first given it’s an easier problem to solve than a leak.
Troubleshooting
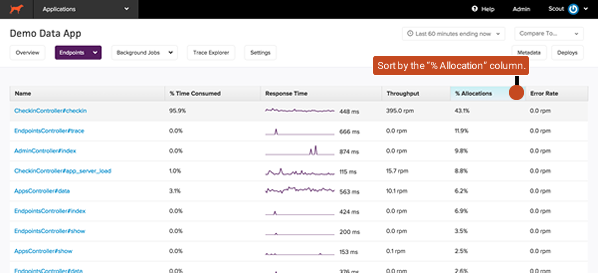
As we’ve seen with most other issues, APM tools seldom fail to make things easy for developers when it comes to optimizing application performance. With a tool like ScoutAPM, you can easily isolate the controller actions that are responsible for the most amount of memory allocations and start from there. It also allows you to observe transaction traces of specific memory-hungry requests and isolate hotspots to specific areas of your code. These quick insights coupled with their effective alerting systems ensure that such bottlenecks in performance are picked up before they impact the user’s experience.
Identify Performance Issues Before It’s Too Late
These were some of the most common and most important performance issues that are likely to affect your application’s performance. Now it is your responsibility to identify and track these issues before they impact performance and end-user experience. It can be difficult, and sometimes even impossible to be alert and prepared to tackle issues on all the frontiers of a web application. However, as we discussed, Application Performance Monitoring (APM) tools like Scout can take a lot of burden off developer teams and enterprises by taking care of tracking and monitoring all aspects of your website’s performance, allowing developers to spend more time building and less time debugging issues.
Happy coding!

