How to Identify and Debug Memory Bloat
 Prince Sinha
on
January 13, 2021
Prince Sinha
on
January 13, 2021

Even the systems that run smoothly day and night, can flounder when short of memory. Efficient memory usage has become of utmost importance for software applications. Nowadays, with growing audiences and faster speed and data retrieval expectations, memory issues pose a huge threat to performance and can lead to huge losses in terms of customers and money.
Therefore, it is very important to build memory-efficient applications that ensure overall performance and a smooth customer experience. In this article, we will be covering a common scenario in web applications, known as memory bloat. We’ll talk about what this term refers to and discuss ways of identifying and debugging it in your application.
Use the links below to navigate or skip ahead in the tutorial:
- What is Memory Bloat?
- Memory Bloat vs Memory Leak
- More about Memory Bloat
- Fixing Memory Bloat
- Using Scout APM to Save Time and Debug Memory Bloat Faster
- Spend More Time Building and Less Time Debugging
What is Memory Bloat?
Memory bloat is caused by loading too much into memory, usually as a result of poor memory management in the software, for example – when you load lots of unnecessary data objects into memory that are neither utilized by the application nor released from memory.
Memory Bloat vs Memory Leak
Though quite different, memory bloat is often confused with a memory leak.
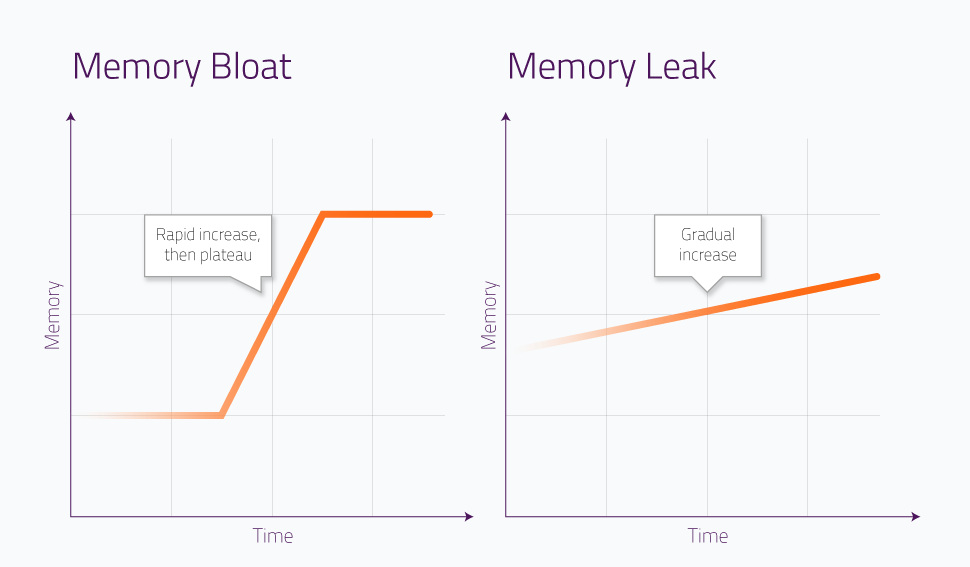
Memory bloat is a sudden increase in memory consumption whereas a memory leak is more of a slow, gradual increase in memory usage. Unlike a memory leak, memory bloat is usually more time-sensitive because of its sudden nature, making it a more critical issue that might require immediate attention to avoid failure.
Hacks, such as scheduled restarting of your systems, can save you from memory leaks, but not from memory bloats. However, while a memory bloat can damage performance more rapidly, it is usually easier to track down as compared to a leak.
If plotted on a memory vs time graph, memory bloat will look like a plateau after a rapid incline due to a sudden surge in memory consumption. On the other hand, a memory leak can be represented by a relatively less steep incline – showing a steady increase.
More about Memory Bloat
Before we look at ways to overcome memory bloat, let’s try to understand a little more about them, and about memory usage, in general, in web applications.
- Unlike other issues such as slow database queries that might produce a temporary impact on performance, memory bloat, once triggered, continues to affect performance until the end. This can also be seen in the diagram above. Even though memory is eventually freed, the process is usually extremely slow in languages like Ruby.
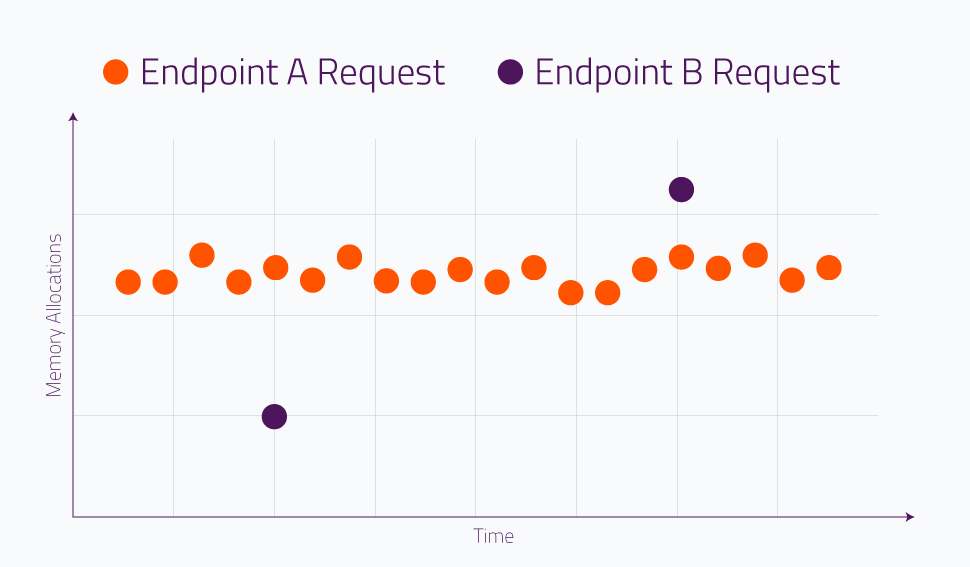
- A single request with a large number of memory allocations has a greater impact on performance as compared to a large number of requests with relatively lower memory allocations.
A single request that renders the results of 1,000 ActiveRecord objects vs. 10 will trigger many allocations and have a long-term impact on your app’s memory usage.
For example, in the diagram below, it is more critical to investigate memory allocation issues for endpoint B’s request when optimizing for memory (instead of endpoint A).
- When analyzing web requests, keep in mind that some requests might show increased usage initially. This is because dynamic library loading in languages like Ruby can seem to indicate increased memory consumption in the beginning. However, these should not be taken into consideration.
Fixing Memory Bloat
When it comes to fixing memory bloat, there are a bunch of ways to go about it.
For Ruby applications, Nate Berkopec, from Speedshop, suggests:
- Using a different memory allocator, like jemalloc.
- Setting the environment variable MALLOC_ARENA_MAX=2.
Another thing you can try is inspecting the performance and memory tab of your browser’s developer tools. This can give you a bunch of insights about the memory consumption of your website, along with highlighting any oddities in usage.
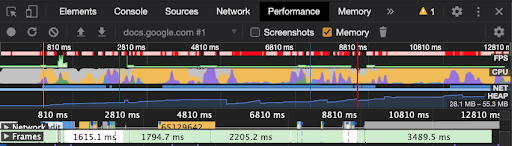
Chrome Developer Tools Performance Tab Example
However, these tools can be effective in preventing and fixing memory-related problems only when observed regularly. Because memory bloat can unexpectedly shut down your application in a matter of seconds, manual monitoring can be very inefficient and time taking.
This is where an Application Performance Monitoring (APM) tool like Scout comes into the picture. Let’s look at how this can help.
Using Scout APM to Save Time and Debug Memory Bloat Faster
Scout is an APM tool that constantly monitors your application’s memory usage. It also helps you in discovering specific allocations that are likely to be causing memory bloat. Insights like these can go a long way in helping you remove unnecessary overhead from your applications.
Scout provides an easy interface to dive into issues that are affecting your application’s performance, including memory bloat. A separate ‘Memory Bloat Insights’ tab makes it super easy for developers to focus on detailed traces of memory allocation activities.
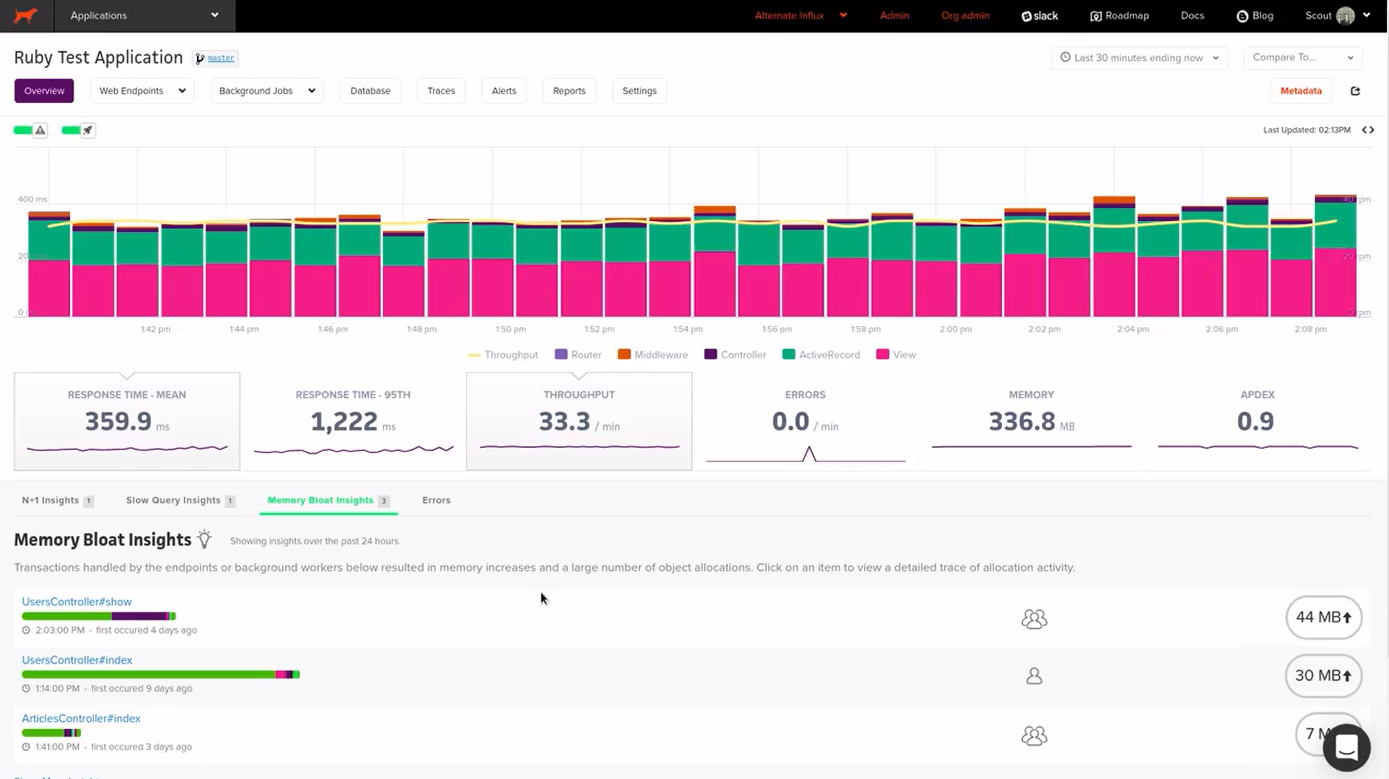
Here, the list of memory-hungry endpoints can be easily seen, along with other endpoint-specific information such as memory usage and (single/multiple) user access.
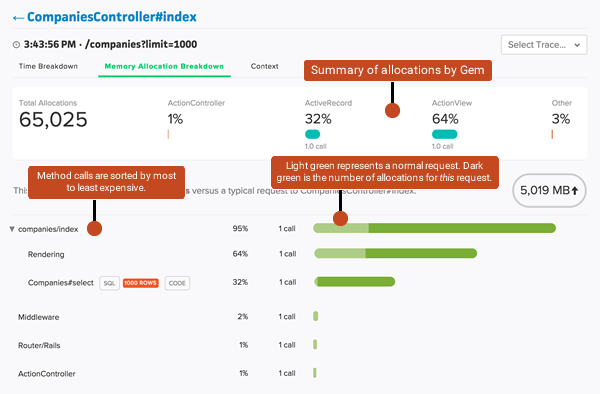
One thing that makes Scout stand out from several other APM tools is how it provides full memory allocation breakdowns for all traces. It gives you a detailed and transparent view of how much memory was allocated at each step of a given endpoint request or a background task. It also allows you to enable Github integration for identifying specific lines of code that are responsible for deteriorating your application’s performance and likely causing the bloat.
You can use the ‘Endpoints’ section in Scout to compare the memory allocation of each controller. The ‘% allocation’ column provides information about the maximum number of allocations recorded by a specific controller in a given timeframe. You can also dive into the details of the allocations by clicking on the endpoint for information about corresponding method calls, memory allocation, and other metric charts.
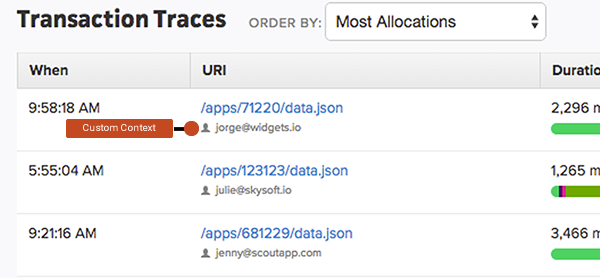
Because memory bloats are likely to be caused by a specific set of users, you can also use Scout’s Context API to identify and isolate specific user requests that have resulted in most memory allocation (and perhaps bloat too).
Spend More Time Building and Less Time Debugging
As we discussed, memory bloat can be disastrous for web applications and take your website down in a matter of seconds. So it is very important to solve them as soon as possible.
We also looked at how effective APM tools like Scout can turn out to be for monitoring and debugging issues in your application. Here are some of its most important features that Scout APM brings to the table:
- Detection of memory bloat
- N+1 detection
- Slow database queries detection
- Live alerts
- Easy installation
- Low overhead
We hope you found this article interesting and learned something new. Here are some related articles that you might find interesting:
Happy coding!