How to Monitor Kubernetes Applications
 Sarmad Saleem
on
November 17, 2020
Sarmad Saleem
on
November 17, 2020
Software companies large and small are embracing microservices as a superior approach to application development and management, compared to the earlier monolithic model. These software teams tend to reach out for containerization as their preferred way of packaging and shipping applications. Containers provide a lightweight encapsulation of any application, whether it is a traditional monolith or a modular microservice. Some of the benefits that containers can afford us, as opposed to bare metal or virtual machines, include superior fault isolation, better resource utilization, and the ability to scale workloads faster. Even though there are other container runtimes out there, people tend to use containers and Dockers almost interchangeably, showing the impact Docker has had on the landscape.
While containers by themselves are extremely useful, they can become quite challenging to deploy, manage, and scale across multiple hosts in different environments. That's where container orchestration comes into play. A number of tools have since been developed to address this pain-point. While they have been around for a few years, many consider 2017 to be the year that container tools came of age. As of today, there are several open-source and proprietary solutions to manage containers out there. Similar to how Docker became the de-facto for containerization, the industry has found Kubernetes as the front runner in the container orchestration landscape. At its core, Kubernetes eases the management of containerized apps at scale by pools underlying resources, like compute, memory, disk space, etc, into one unified blob and allows you to manage that pool using different objects via an API. These objects work together to deliver a robust, reliable, and resilient application experience.
You might have heard the analogy of pets vs cattle in a cloud-native context, the idea is that the old way of maintaining indispensable servers was the pet way of doing things, whereas moving towards low-maintenance ephemeral servers is close to the cattle model as they don’t require the same level of nurturing and attention. This paradigm shift allows tools like Kubernetes to really shine. While Kubernetes drastically streamlines container lifecycle management at scale, it also comes with its own set of complexities and maintenance overhead. Legacy ways of monitoring infrastructure and troubleshooting workflows that were primarily focused on the static target (pet model) fall flat in today's dynamic world of Kubernetes (cattle model). The abstractions that make Kubernetes powerful, also force us to redefine the way we monitor underlying infrastructure, the cluster itself, and the applications running atop.
In this guide, we'll unpack Kubernetes monitoring by discussing why legacy methods fail, why we need specialized monitoring, what we should monitor and some of the popular tools teams tend to reach out for. Monitoring can be an overwhelming topic when it comes to Kubernetes, the goal of this post is to help break down the topic into digestible bits.
Kubernetes primer
Before we jump into the why of monitoring, let's use this primer as a brief recap of Kubernetes, a topic we have covered in detail in a dedicated blog post, An Intro to Kubernetes and Its Uses. It's open-source software that has become the gold standard for orchestrating containerized workloads in private, public, and hybrid cloud environments. At its core, it orchestrates clusters of virtual machines and schedules containerized apps to run atop based on specified constraints.
On a higher level, Kubernetes architecture consists of a control plane and group(s) of worker nodes. The control plane is the brain responsible for accepting user instructions and figuring out the best way to execute them. Whereas worker nodes are machines responsible for obeying instructions from the control plane and running containerized workloads. Control plane and worker nodes use Kubernetes native objects like pods, deployments, stateful set, daemon set, service, ingress, etc to orchestrate workloads.
Containers are grouped into pods, the basic operational unit for Kubernetes, and those pods scale to your desired state typically using high-level objects like deployment, stateful set, or daemon set. These high-level objects are then tied to services for automatic service discovery. Kubernetes also incorporates load balancing, tracks resource allocation, and scales based on compute utilization. And, it checks the health of individual resources and enables apps to self-heal by automatically restarting or replicating containers.
Some of the major features include self-healing, horizontal scaling, load balancing, service discovery, automated rollouts and rollbacks, secrets and configuration management, storage orchestration, and batch execution. With that recapped, let's dig into why we need monitoring in general and how that evolves within the Kubernetes context.
Why do we need monitoring?
Generally speaking, monitoring helps maximize availability and performance for your applications and services by collecting, analyzing, and acting on telemetry from your environment. It not only helps you understand how your applications are performing but also proactively identifies issues so that you can resolve them thus minimizing the time end-user is affected.
In other words, it's the feedback from your applications. Monitoring helps achieve the goal of ensuring high availability by minimizing time to detect (TTD) and time to mitigate (TTM). Additionally, monitoring also enables validated learning by tracking usage. The concept of validated learning relates to development teams collecting data to support the hypotheses that led to the development of a feature and eventual deployment. If a hypothesis is proved wrong, the team can fail fast or pivot, thus enforcing a strong feedback loop. Effective monitoring is essential to allow DevOps teams to deliver at speed, get feedback from production, and increase customer satisfaction, acquisition, and retention.
How is Kubernetes monitoring different?
From a developer experience perspective, Kubernetes abstractions may seem straightforward. For example, your containers are placed inside pods, pods are grouped under deployments, deployments are exposed via services and services accept external traffic via ingresses. The learning curve seems to be manageable here, but in this example, the scope is limited to your application workloads. If we change the scope to running a Kubernetes cluster itself, there's a lot more that we need to think about. For example, how to provision a cluster, secure it, monitor it, make it scale, bootstrap it with necessary add-ons as per application needs, perform back-ups, upgrade to a newer version, and handle disaster recovery. This can be an overwhelming task and requires in-depth knowledge about Kubernetes. Now, what if someone can run Kubernetes for you? That's exactly the pain-point that managed Kubernetes services like AWS Elastic Kubernetes Service, GCP Google Kubernetes Engine & Microsoft Azure Kubernetes Service among others, attempt to solve. The idea is that the cloud providers will manage the master nodes for us given some SLA, that way a fair bit of additional overhead is outsourced.
Some of the challenges that make Kubernetes monitoring more complicated that traditional approaches include:
- There's no static target, applications are constantly moving in the form of containers and pods across different nodes.
- Prior to Kubernetes, having distributed and dynamic apps deployed in multi-region and multi-cloud fashion was not trivial. Since Kubernetes makes this easier and more accessible to teams, we have a new set of problems.
- Comparing Kubernetes monitoring with legacy ways is a lot similar to comparing microservices with monoliths, instead of one big static piece, there are many smaller dynamic pieces to monitor.
- We touched upon the pet vs cattle analogy and some of the merits of treating your infrastructure as cattle. Kubernetes embraces the cattle approach fully, in that making it easy to implement high volume and ephemeral infrastructure, while leveraging identifiers such as labels and annotations to deal with the dynamic nature of things.
Regardless of whether you run your own Kubernetes cluster on bare metal or use a managed Kubernetes service, the approach towards monitoring your cluster remains relatively similar. You identify metrics worth monitoring, establish rules around those metrics defining the desired state, and alert respective teams if any of those rules are breached. Even though what we care most about are our application workloads, we need to monitor the cluster itself so that Kubernetes continues to function as intended and our applications can leverage the goodness of Kubernetes.
What should I monitor?
As discussed before, Kubernetes solved some old problems but it also created some new challenges like added complexity to logging and monitoring in a dynamic environment. There are a bunch of variables at play, underlying hosts, the platform itself, containers, and objects that orchestrate those containers, all of which must be monitored. You can look at this question of what to monitor from multiple lenses, for example, control plane metrics, cluster state metrics, resource metrics, bandwidth, latency, application health, and performance. To keep things digestible, let's try to transform the afore-mentioned lenses into two supersets i.e. Kubernetes monitoring & application monitoring.
Key metrics for Kubernetes monitoring
Kubernetes exposes a bunch of metrics out of the box. Additionally, you can pair some add-ons that can help aggregate data collected from the kubelet on each node in a more streamlined manner. This can then be used by a number of visualization tools. Speaking of metrics, the interface of the metrics registry consists of three separate APIs, namely Resource Metrics API, Custom Metrics API & External Metrics API. For now, we'll only focus on Resource Metrics API. Some key metrics to consider monitoring include:
- Cluster state metrics, including the health and availability of pods.
- Node status, including readiness, memory, disk or processor overload, and network availability.
- Pod availability, since unavailable pods can indicate configuration issues or poorly designed readiness probes.
- Memory utilization at the pod and node level.
- Disk utilization including a lack of space for file system and index nodes.
- CPU utilization in relation to the number of CPU resources allocated to the pod.
- API requests latency measured in milliseconds, where the lower the number the better the latency.
What about my applications? How do I monitor them?
Our application workloads are composed of Kubernetes objects like pods, deployments, services, ingresses, etc., most of which are covered by the key metrics we discussed above. Let's zoom into the probe mechanism, something we brushed on above. Some of the above-mentioned metrics depend on this mechanism heavily. Kubernetes uses liveness probes to determine when to restart a container, whereas it uses readiness probes to decide when a container is ready to accept traffic.
Great! So using these probes Kubernetes can understand when containers are alive and ready to accept traffic, this understanding feeds into the state of different objects (pods, deployments, etc) and giving us a holistic picture. But that's not where the story of monitoring our applications ends. So far we have talked about monitoring pod availability, resource utilization, and using probes, all of these things are very Kubernetes specific.
What about application-specific metrics? One of the ways to do application-specific custom metrics on Kubernetes is through the previously mentioned Custom Metrics API. For example, you could instrument your application to expose the metric as a Prometheus metric, install and configure Prometheus to collect it from all pods, and use Prometheus Adapter to expose it as a custom metric. This metric can then be used for visualization, reporting, and even dynamically autoscaling workloads if needed. We'll learn more about Prometheus later in the post. Another way is to keep application-specific metrics isolated from the infrastructure and orchestration layer altogether.
What about application logging? A container running on Kubernetes writes its logs to stdout and stderr streams, which are then picked up by kubelet service running on that node and delegated to the container engine for handling based on the logging driver configured. Another way to handle logs is to leverage a side-car pattern. Most third-party logger aggregation services use a similar pattern to implement their agent. Typically the purpose of logging is to create an ongoing record of application events so that teams can refer to this record to troubleshoot issues. Monitoring on the other hand is more metric-focused, these metrics are then used to alert teams of any analogies. You can think of monitoring as a security alarm whereas logs as security camera footage. On the open-source side, some of the popular stacks include ELK (ElasticSearch, Logstash, Kibana), EFK (ElasticSearch, Fluentd, Kibana), and Graylog. Let's keep it brief on the logging side as it's beyond the scope of this post and probably deserves a dedicated post of its own.
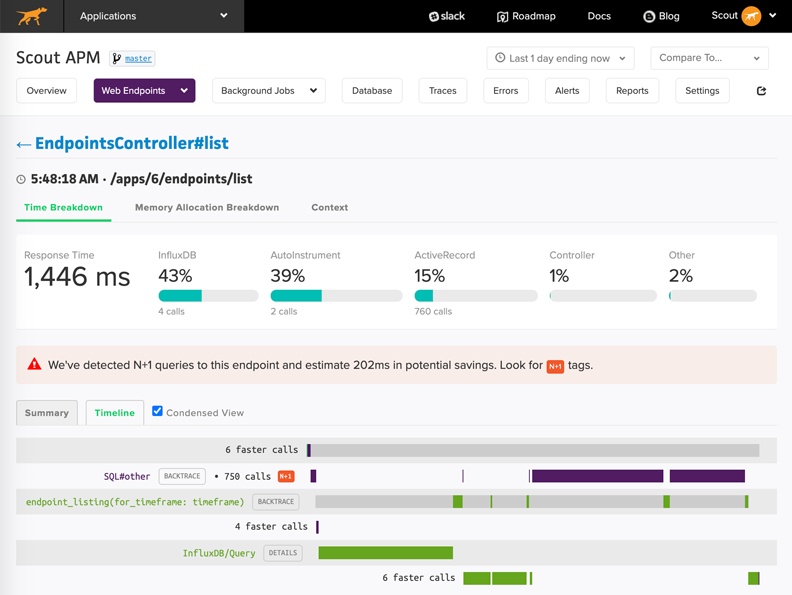
What about application performance monitoring? You can bring your own APM tool to help monitor gaps in application performance allowing you to focus on solving customer experience issues and not just application health issues. This is where ScoutAPM can help. Scout is an application performance monitoring product that helps developers drill down into the fine-grained details of app performance and stability issues. With Scout, you can get to the bottom of the exact cause of N+1 database queries, sluggish queries, memory bloat, and other performance abnormalities.
Kubernetes monitoring tools
Now that we have gone through a primer on Kubernetes, looked into why we need monitoring, and discussed what we should monitor, let's dive into some of the monitoring tools. Let's start with some rudimentary out of the box options and build up to more popular production-ready solutions. Some of the tools we'll touch upon include:
- Metrics API using kubectl
- Kubernetes Metrics Server
- Kubernetes Dashboard
- Lens - Kubernetes IDE
- Prometheus, Grafana & AlertManager stack
- Proprietary tools
In this section, we'll learn by the example of all these tools stack up against each other. We'll be using a cluster created on AWS EKS (Elastic Kubernetes Service) using eksctl command-line utility. Please note that trying to replicate this on your end will require an AWS account and will cost money. As an alternative, you can also try to follow along locally using Kubernetes bundled with Docker Desktop or Minikube. As long as you have access to a cluster via kubectl, the following examples should apply as is.
# Install eksctl
brew tap weaveworks/tap
brew install weaveworks/tap/eksctl
eksctl version
0.31.0

# Declare desired cluster manifest
cat cluster.yaml
apiVersion: eksctl.io/v1alpha5
kind: ClusterConfig

metadata:
  name: basic-cluster
  region: eu-central-1

nodeGroups:
  - name: ng-1
    instanceType: t3a.small
    desiredCapacity: 3
    volumeSize: 100

# Provision cluster on AWS EKS based on manifest
eksctl create cluster -f cluster.yaml
Metrics API using kubectl
Kubernetes API server exposes a number of metrics out of the box that is useful for monitoring and analysis. These metrics are exposed internally through a metrics endpoint that refers to the /metrics HTTP API. We'll see in a later section that these raw metrics can be used in conjunction with some tools to create a more robust monitoring solution. Let's see it in action:
# Get raw metrics in <metric_name>{"<tag>"="<value>"[<,...>]} <value> format
kubectl get --raw /metrics
...
# HELP rest_client_requests_total Number of HTTP requests, partitioned by status code, method, and host.
# TYPE rest_client_requests_total counter
rest_client_requests_total{code="200",host="127.0.0.1:21362",method="POST"} 4994
rest_client_requests_total{code="200",host="127.0.0.1:443",method="DELETE"} 1
rest_client_requests_total{code="200",host="127.0.0.1:443",method="GET"} 1.326086e+06
rest_client_requests_total{code="200",host="127.0.0.1:443",method="PUT"} 862173
rest_client_requests_total{code="404",host="127.0.0.1:443",method="GET"} 2
rest_client_requests_total{code="409",host="127.0.0.1:443",method="POST"} 3
rest_client_requests_total{code="409",host="127.0.0.1:443",method="PUT"} 8
# HELP ssh_tunnel_open_count Counter of ssh tunnel total open attempts
# TYPE ssh_tunnel_open_count counter
ssh_tunnel_open_count 0
# HELP ssh_tunnel_open_fail_count Counter of ssh tunnel failed open attempts
# TYPE ssh_tunnel_open_fail_count counter
ssh_tunnel_open_fail_count 0
Kubernetes Metric Server
Kubernetes Metrics Server is a scalable, efficient source of container resource metrics for Kubernetes built-in autoscaling pipelines. This add-on collects resource metrics from Kubelets and exposes them in Kubernetes apiserver through Metrics API for use by Horizontal Pod Autoscaler and Vertical Pod Autoscaler. Metrics API can also be accessed by kubectl top, making it easier to debug autoscaling pipelines. While the metric server is useful to get resource usage metrics for nodes or pods, by itself it's very bare-bones and is typically used in conjunction with pod scalers, Kubernetes Dashboard, etc.
# Deploy metric-server
kubectl apply -f
https://github.com/kubernetes-sigs/metrics-server/releases/download/v0.3.6/components.yaml

# Verify deployment
kubectl get deployment metrics-server -n kube-system
NAME             READY   UP-TO-DATE   AVAILABLE   AGE
metrics-server   1/1     1            1           42m

# Get node resource usage
kubectl top nodes
NAME                                              CPU(cores)   CPU%   MEMORY(bytes)
MEMORY%
ip-xxx.eu-central-1.compute.internal   53m          2%     428Mi           28%
ip-xxx.eu-central-1.compute.internal   64m          3%     409Mi           26%
ip-xxx.eu-central-1.compute.internal   62m          3%     438Mi           28%
Kubernetes Dashboard
Kubernetes Dashboard is a general-purpose, web-based UI for Kubernetes clusters. It allows users to manage applications running in the cluster and troubleshoot them, as well as manage the cluster itself. The dashboard also provides information on the state of Kubernetes resources in your cluster and on any errors that may have occurred. Let's deploy the dashboard on our cluster and see what value it provides. Kubernetes dashboard assumes the metric server is already installed, in our case we did that in the section above.
# Deploy kubernetes dashboard
kubectl apply -f
https://raw.githubusercontent.com/kubernetes/dashboard/v2.0.0/aio/deploy/recommended.yaml

# Verify deployment
kubectl get deployment -n kubernetes-dashboard

# Get access token
kubectl -n kube-system describe secret $(kubectl -n kube-system get secret | grep eks-admin | awk '{print $1}')

# Start proxy
kubectl proxy

# Launch dashboard
Open
http://localhost:8001/api/v1/namespaces/kubernetes-dashboard/services/https:kubernetes-dashboard:/proxy/#!/login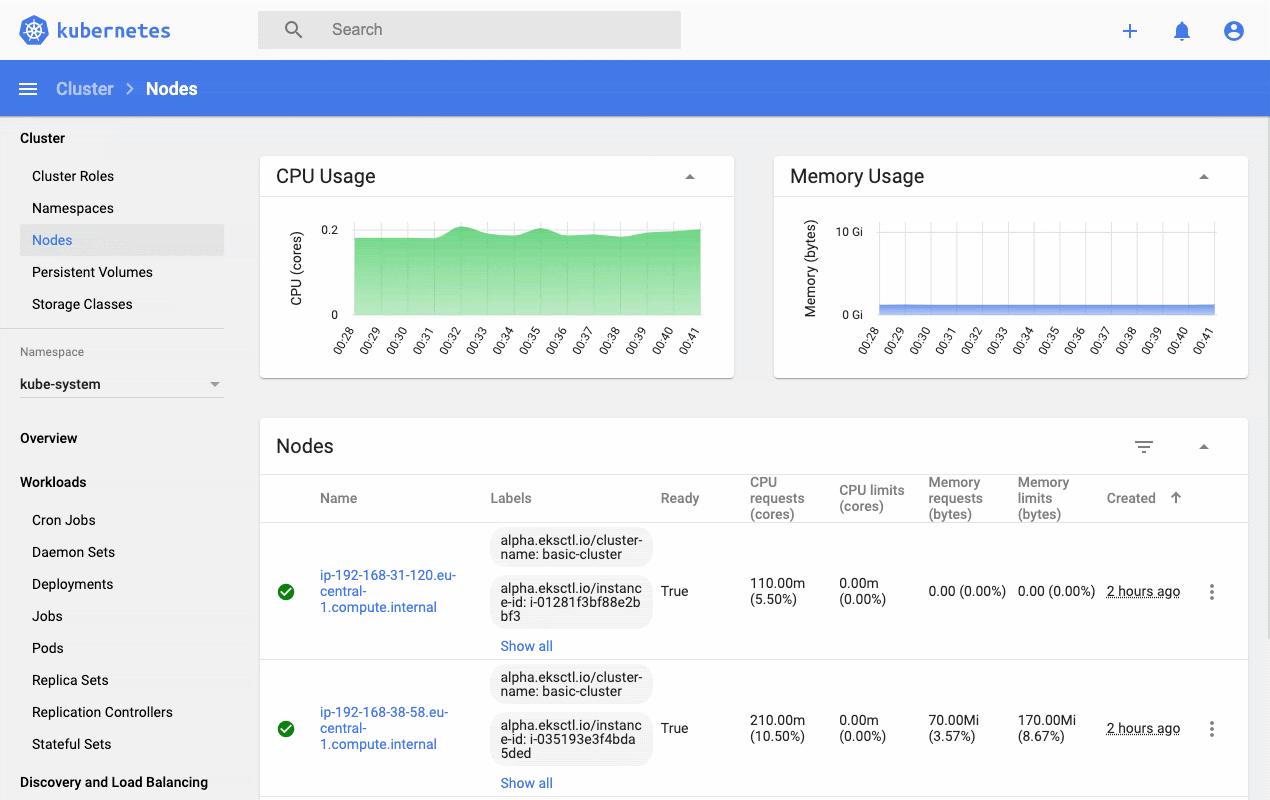
As you can see, Kubernetes Dashboard incorporates raw metrics and the metric server to provide a web-based interface that provides a high-level overview as well as resource-level drill-down functionality. It's a good place to start but teams soon outgrow this dashboard and reach out for more production-ready solutions like Prometheus and kubewatch.
Lens - Kubernetes IDE
Lens advertises itself as the only Kubernetes IDE you'll ever need to take control of your Kubernetes clusters. It is a standalone application for macOS, Windows, and Linux operating systems. It is open-source and free. It extends a lot of Kubernetes dashboard functionality while capitalizing on good usability, multi-cluster management, terminal access to nodes, and pods to name a few.
# Install Lens
brew cask install lens

# Launch Lens & select desired kubeconfig to connect to your cluster
open /Applications/Lens.app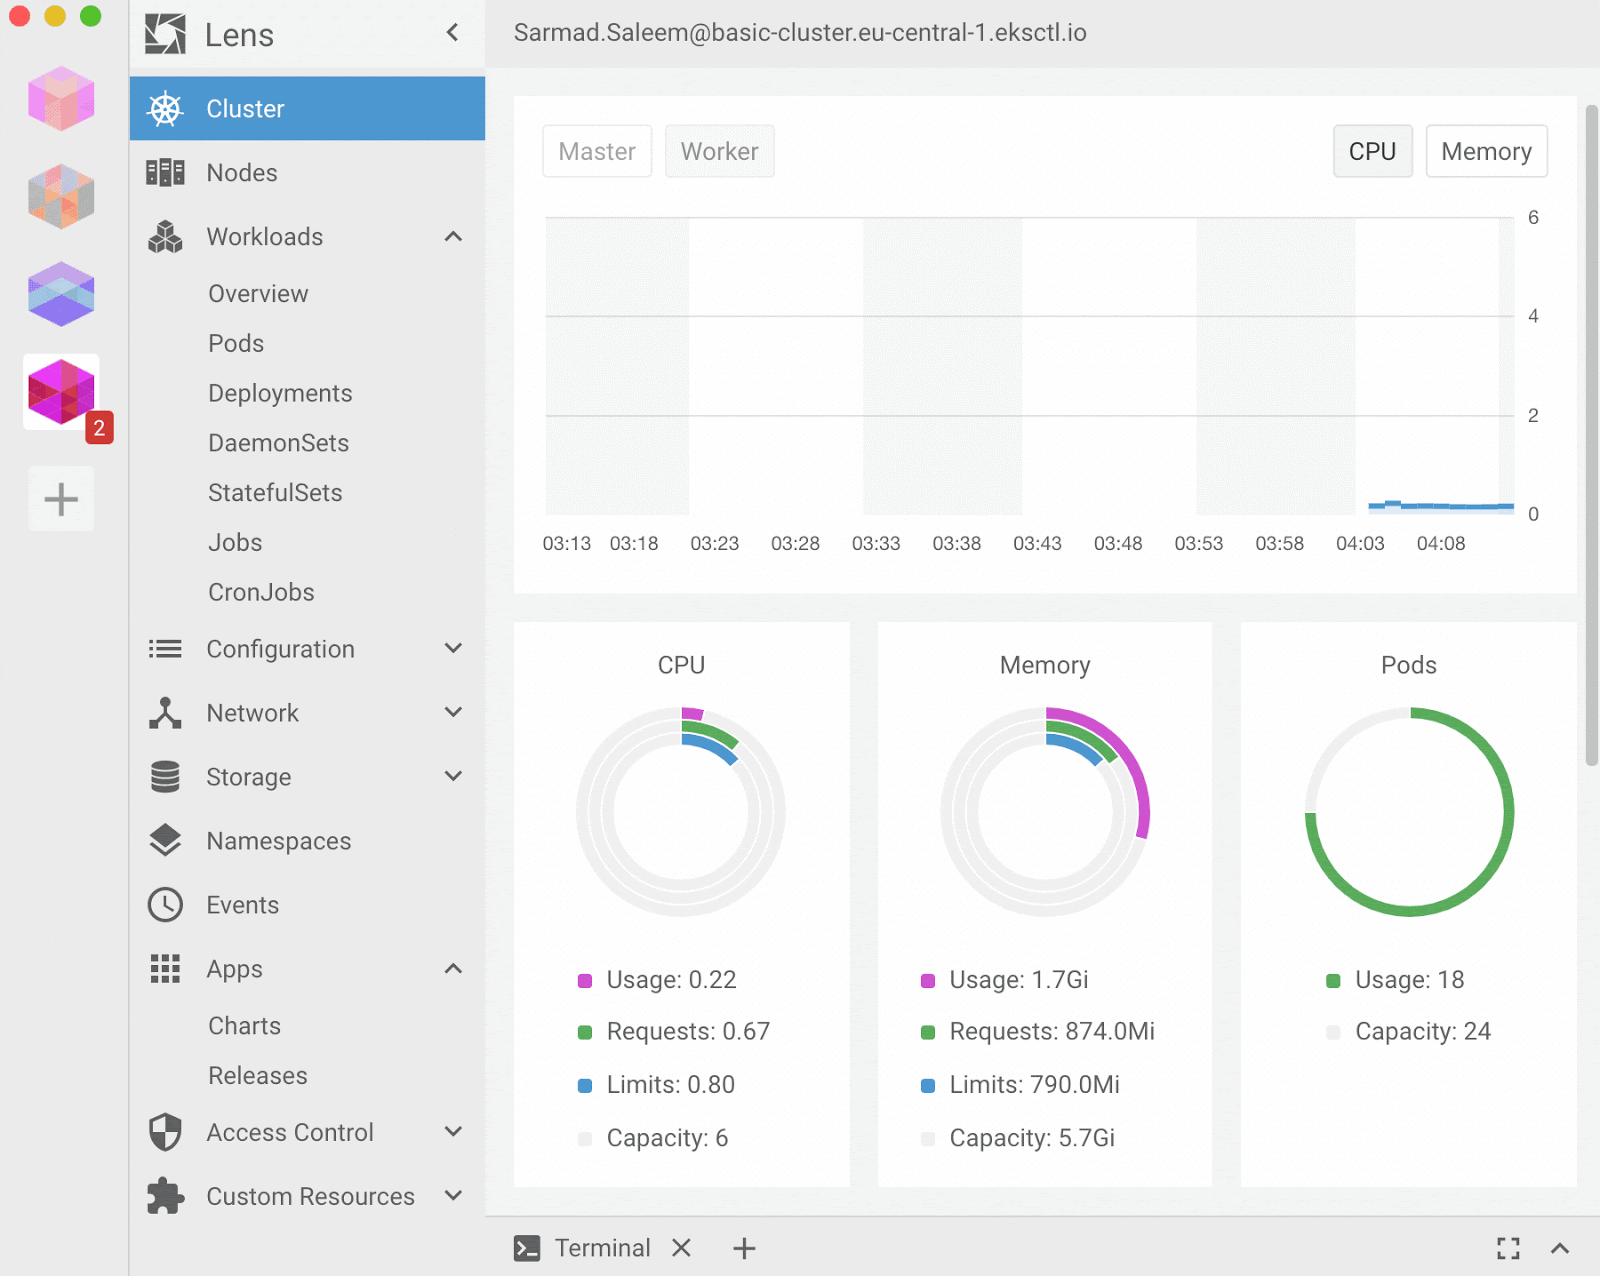
Lens is quite comparable to Kubernetes Dashboard, a good GUI alternative that can save some time doing repetitive tasks over the API. However, it still falls under basic monitoring as there's no concept of rules or alerts out of the box. For that kind of setup, you'll have to side with Prometheus or third-party services.
Prometheus, Grafana & Alert Manager stack
So far the tools we have been looking at are following a progression from rudimentary to more production-ready setups. Speaking of robust and production-ready stacks, typically such a monitoring system consists of a time-series database that houses metric data and a visualization layer. In addition, an alerting layer creates and manages alerts, handing them off to integrations and external services as necessary. Finally, one or more components generate or expose the metric data that will be stored, visualized, and processed for alerts by the stack.
One popular monitoring solution is the open-source Prometheus, Grafana, and Alertmanager stack, deployed alongside kube-state-metrics and node_exporter to expose cluster-level Kubernetes object metrics as well as machine-level metrics like CPU and memory usage.
- Prometheus - It is a time-series database and monitoring tool that works by polling metrics endpoints and scraping and processing the data exposed by these endpoints. It allows you to query this data using PromQL, a time series data query language.
- Grafana - It is a data visualization and analytics tool that allows you to build dashboards and graphs for your metrics data.
- Alertmanager - Typically installed alongside Prometheus, forms the alerting layer of the stack, handling alerts generated by Prometheus and deduplicating, grouping, and routing them to integrations like email or PagerDuty.
- kube-state-metrics - Add-on agent that listens to the Kubernetes API server and generates metrics about the state of Kubernetes objects like Deployments and Pods. These metrics are served as plaintext on HTTP endpoints and consumed by Prometheus.
- node-exporter - Prometheus exporter that runs on cluster nodes and provides OS and hardware metrics like CPU and memory usage to Prometheus.
We'll be using Kubernetes package manager Helm to install this to our cluster instead of applying multiple manifests individually.
# Create namespace
kubectl create namespace prometheus

# Deploy prometheus
helm repo add prometheus-community https://prometheus-community.github.io/helm-charts
helm repo add stable https://charts.helm.sh/stable
helm install prometheus prometheus-community/prometheus \
  --namespace prometheus \
  --set alertmanager.persistentVolume.storageClass="gp2" \
  --set server.persistentVolume.storageClass="gp2"

# Verify deployment
kubectl get deployment -n prometheus
NAME                            READY   UP-TO-DATE   AVAILABLE   AGE
prometheus-alertmanager         1/1     1            1           8m20s
prometheus-kube-state-metrics   1/1     1            1           8m20s
prometheus-pushgateway          1/1     1            1           8m20s
prometheus-server               1/1     1            1           8m20s

# Port forward prometheus
kubectl --namespace=prometheus port-forward deploy/prometheus-server 9090
open localhost:9090
This gives you an insight into how Prometheus gives us an expressive query language to sift through a plethora of metrics and define alerts based on that. Let's throw Grafana into the fix and visualize some of the metrics.
# Create namespace
kubectl create namespace grafana

# Declare grafana datasource
cat grafana-values.yaml
datasources:
  datasources.yaml:
    apiVersion: 1
    datasources:
    - name: Prometheus
      type: prometheus
      url: http://prometheus-server.prometheus.svc.cluster.local
      access: proxy
      isDefault: true

# Deploy grafana
helm repo add grafana https://grafana.github.io/helm-charts
helm install grafana grafana/grafana \
  --namespace grafana \
  --set persistence.storageClassName="gp2" \
  --set persistence.enabled=true \
  --set adminPassword='super-secret-password' \
  --values grafana-values.yaml \
  --set service.type=LoadBalancer

# Verify deployment
kubectl get deployment -n grafana
NAME                      READY   UP-TO-DATE   AVAILABLE   AGE
deployment.apps/grafana   1/1     1            1           53s

# Access grafana dashboard with admin and super-secret-password
export ELB=$(kubectl get svc -n grafana grafana -o
jsonpath='{.status.loadBalancer.ingress[0].hostname}')
open "http://$ELB"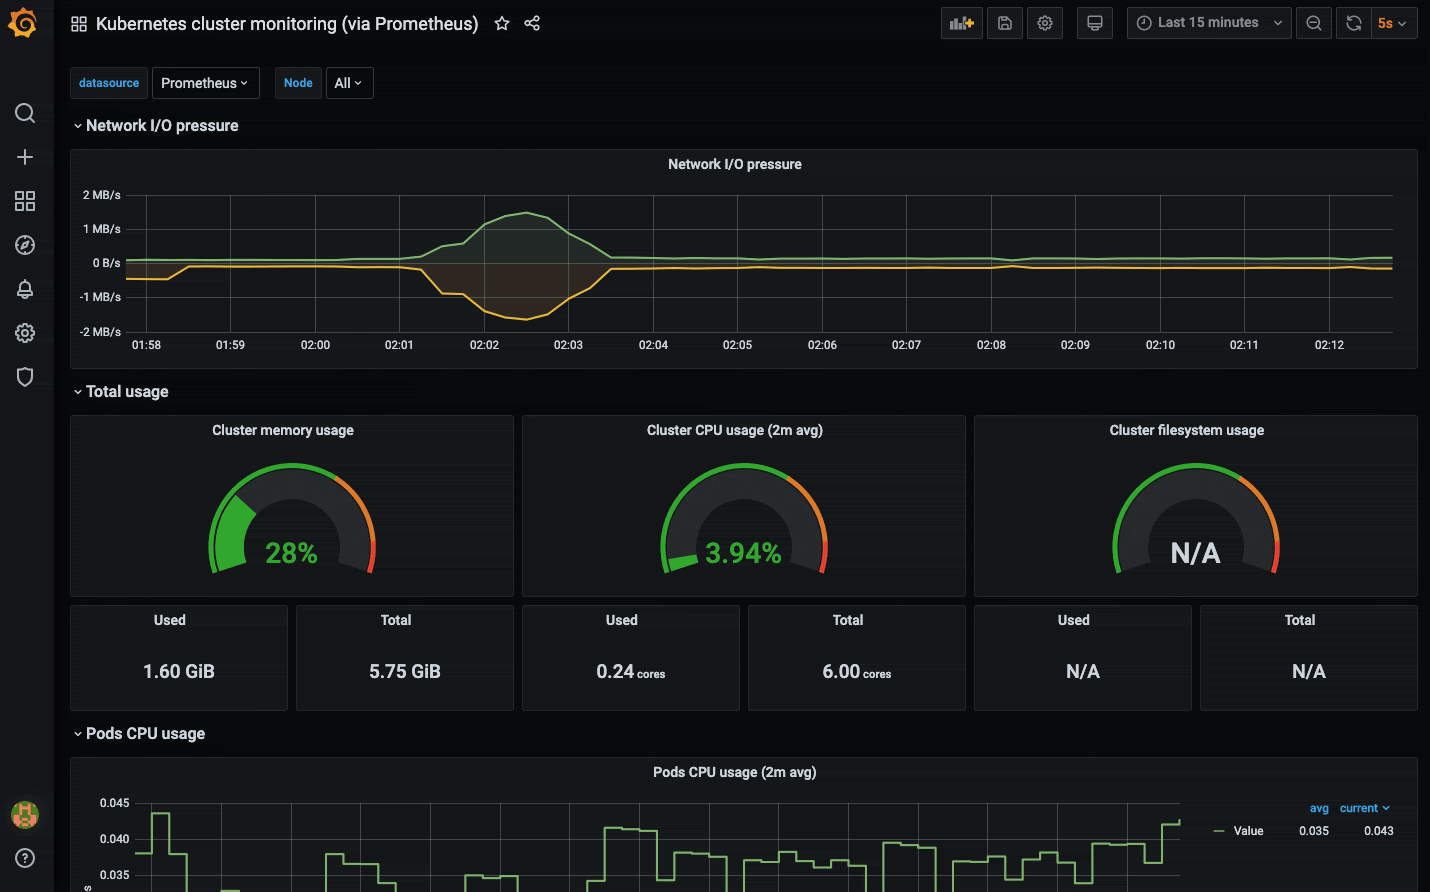
Now that we have seen Prometheus and Grafana in action, it's easy to imagine how alerts can be set up on some of the metrics using AlertManager. Just to recap, Prometheus collects metrics and forwards them to AlertManager which takes care of deduplicating, grouping, and routing them to the correct receiver integration such as email, PagerDuty, or Slack. An example rule may look something like this:
# Sample configuration for prometheus rule and alert
cat prometheus-values.yaml
serverFiles:
alerting_rules.yml:
groups:
- name: Instances
rules:
- alert: InstanceDown
expr: up == 0
for: 5m
labels:
severity: page
annotations:
description: '{{ $labels.instance }} of job {{ $labels.job }} has been down for more than 5 minutes.'
summary: 'Instance {{ $labels.instance }} down'
alertmanagerFiles:
alertmanager.yml:
global: null
route:
group_by: [alertname, job]
receiver: slack_alerting
receivers:
- name: slack_alerting
slack_configs:
- api_url: '<https://hooks.slack.com/foo>'
username: 'Alertmanager'
channel: '#prometheus-alerts'
send_resolved: true
title: |-
...
text: >-
...
# Update prometheus to use newly specified rule and alert
helm upgrade prometheus prometheus-community/prometheus \
--namespace prometheus \
--set alertmanager.persistentVolume.storageClass="gp2" \
--set server.persistentVolume.storageClass="gp2" \
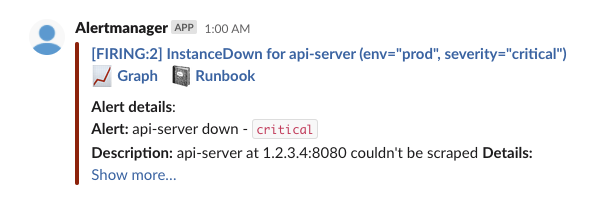
--values prometheus-values.yamlIt's okay if this doesn't make much sense by the look of it. The key takeaway here is that Prometheus and AlertManager allow us to declare rules based on metrics and notify teams using mediums like Slack, PagerDuty, Email, etc when those rules are breached. In our example, if a Kubernetes worker instance goes down, we trigger an alert to a Slack channel which can look like this:
Note: In our example, we used Prometheus Helm Chart to deploy the stack onto our cluster. A new project that's currently in beta makes prometheus even more native to Kubernetes, it's called Prometheus Operator. The purpose of this project is to simplify and automate the configuration of a Prometheus based monitoring stack for Kubernetes clusters. It defines custom resource definitions including the following:
- Prometheus defines the desired Prometheus deployment.
- Alertmanager defines Alertmanager deployment.
- ThanosRuler handles Thanos Ruler resources.
- ServiceMonitor specifies how services should be monitored.
- PodMonitor specifies how groups of pods should be monitored.
- Probe specifies how groups of ingresses or static targets should be monitored.
- PrometheusRule defines the desired set of Prometheus alerting and/or recording rules.
- AlertmanagerConfig specifies subsections of the Alertmanager configuration, allowing routing of alerts to custom receivers, and setting inhibit rules.
Proprietary solutions
Similar to the above mentioned open source solutions, the monitoring landscape is ripe with proprietary ones as well. They take the pain away from setting up and maintaining your own monitoring and alerting system. However this comes at a certain cost. So depending on your use-case and budget, some of these options can reduce your configuration and maintenance overhead when it comes to monitoring. Some notable options include
- AWS CloudWatch with EKS - Amazon EKS control plane logging has native integration with CloudWatch to make it easy for you to secure and run your clusters. Moreover, CloudWatch automatically collects metrics for many resources, such as CPU, memory, disk, and network. Container Insights also provides diagnostic information, such as container restart failures, to help you isolate issues and resolve them quickly. You can also set CloudWatch alarms on metrics that Container Insights collects. These alarms can result in notifications to mediums like email, Slack, PagerDuty, SMS, etc.
- Google Cloud Operations with GKE - Google Kubernetes Engine (GKE) includes native integration with Cloud Monitoring and Cloud Logging. It manages monitoring and logging services together and features a dashboard that provides a customized interface for GKE clusters. It also allows you to set up alerting policies with different notification channels to notify respective teams.
- Microsoft Azure Monitor with AKS - Azure Monitor provides near real-time, granular monitoring data for the health and performance of your cluster. Just like its above-mentioned counterparts, it has native integration with AKS. You can also enable container monitoring from the Azure portal when you create an AKS cluster to aggregate container-specific monitoring and logs. Azure Monitor also allows you to define alerting using alert rule, action group, and monitoring condition constructs.
Wrapping up
To recap, we started by revisiting some of the core concepts of Kubernetes, unpacked the why, the what, and the how of Kubernetes monitoring. We explored some open-source tools by example and briefly touched upon managed monitoring services that aim at reducing the overhead of Kubernetes monitoring.
As discussed before, Kubernetes monitoring is one piece of the puzzle. Once we start to move beyond that and start to focus on the most important piece of the puzzle i.e. our applications, then application performance monitoring becomes increasingly important. This is where ScoutAPM really shines. It enables you to leverage always-on monitoring that keeps you ahead of performance outliers, tie anomalies directly to endpoints, quickly drill down into slow requests, and pin-point bottlenecks directly to your source code. Want to try Scout for yourself? Contact our team to schedule a demo now!


