OpenTracing is a fundamental API to help developers easily instrument tracing into their code base. A transaction trace is a GPS system for web performance: it paints a rich picture of the flow of a web request through your code.
So, why doesn't everybody trace? I believe there are two reasons:
- Complex instrumentation: Adding in-app tracing instrumentation is more involved than calling
logger.info()for logging orstatsD_client.incr()for metrics. - Vender lockin: You aren't committing to a vendor when you log and record metrics: you can easily swap out different services to aggregate your logs and store your metrics. Even though APM vendor tracing libraries are remarkably similar, there hasn't been a vendor-neutral standard for tracing. Adding complex, vendor-specific instrumentation can feel like a deeper commitment than one desires.
OpenTracing, a vender-neutral tracing API
Enter OpenTracing, a vendor-neutral open standard for distributed tracing. OpenTracing loosens the chains on tracing instrumentation: if we trace our method calls via OpenTracing APIs, we can swap out our tracing vendors just like logging and metrics!
To date, there are a number of services capable of ingesting transaction traces generated via OpenTracing. In this quick tutorial, we'll capture transaction traces from Python Flask app, and view this with Jaeger, an open-source distributed tracing system.
We developed an OpenTracing-compatible Python agent at Scout. You can learn more about it here.
A side: what's "distributed" mean?
You may have noticed that both OpenTracing and Jaeger's tagline mention "distributed". Besides providing a vendor-neutral instrumentation API, OpenTracing also provides a standard way to propagate trace context across microservices. This is crucial for debugging issues if your app is composed of microservices. I like to think of it as distributed backtraces.
I'll go over distributed Python tracing in a later post: we'll focus on instrumenting a single app in this tutorial.
The setup
This tutorial will use the following parts:
- The Jaeger All-in-one Docker image - this lets us view our traces locally.
- A Python 2.7 Flask app (
jaeger-client3.7.1 - the current version - does not yet support Python 3). I'm using Flask version 0.12.2. - The Jaeger Python Client. I'm using version 3.7.1.
- Flask-Opentracing, a Python Module that instruments Flask requests via OpenTracing. I'm using version 0.1.8.
Installing Jaeger All-in-one

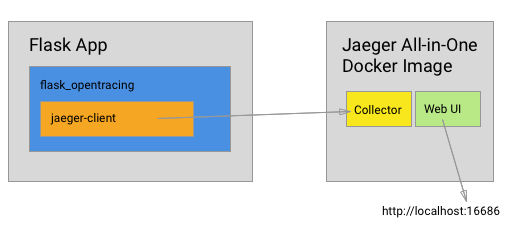
The Jaeger All-in-one Docker image is designed for quick local testing. It launches the Jaeger UI, collector, query, and agent, with an in memory storage component. The jaeger-client module installed in our Flask app sends traces to the collector on this running Docker container. Traces are then viewable in the web UI, accessible via http://localhost:16686.
You can install and run Jaeger All-in-one via the following command (assuming Docker is installed on your machine):
docker run -d -e COLLECTOR_ZIPKIN_HTTP_PORT=9411 -p5775:5775/udp -p6831:6831/udp -p6832:6832/udp \
-p5778:5778 -p16686:16686 -p14268:14268 -p9411:9411 jaegertracing/all-in-one:latest
Verify that the Web UI is accessible at http://localhost:16686. Now that Jaeger is running, let's setup our Flask app.
Flask App
We'll create a simple Flask app to see OpenTracing in action. The app displays pull requests for the opentracing-python project. The app:
Running the app:
FLASK_APP=opentracing_flask_step1.py flask run
The app's output:
$ curl http://localhost:5000
OpenTracing Pull Requests: Implement ScopeManager for in-process propagation, Implement global tracer support
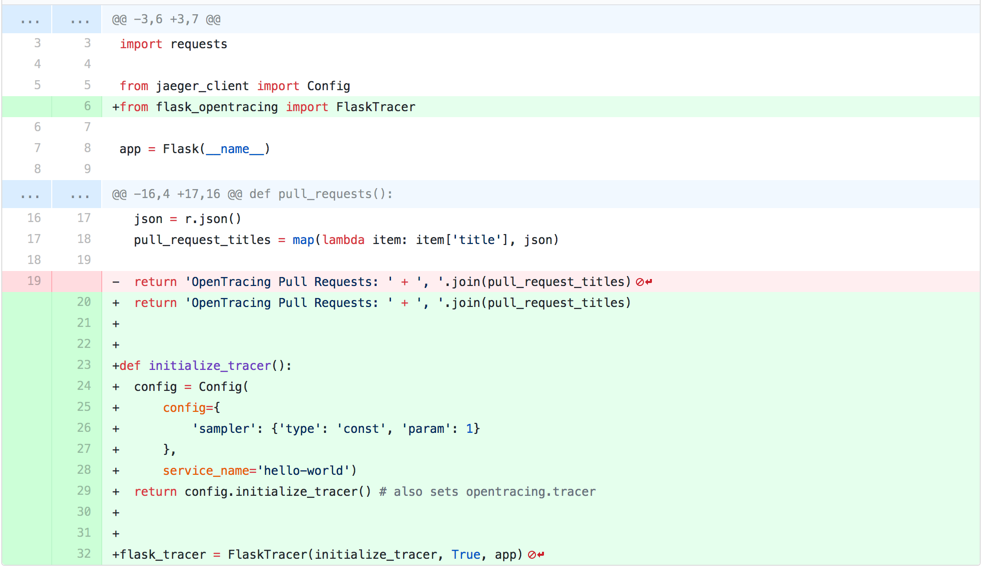
Adding the Jaeger Client and Flask-Opentracing
Let's import jaeger-client, Flask-Opentracing, and initialize the tracer:
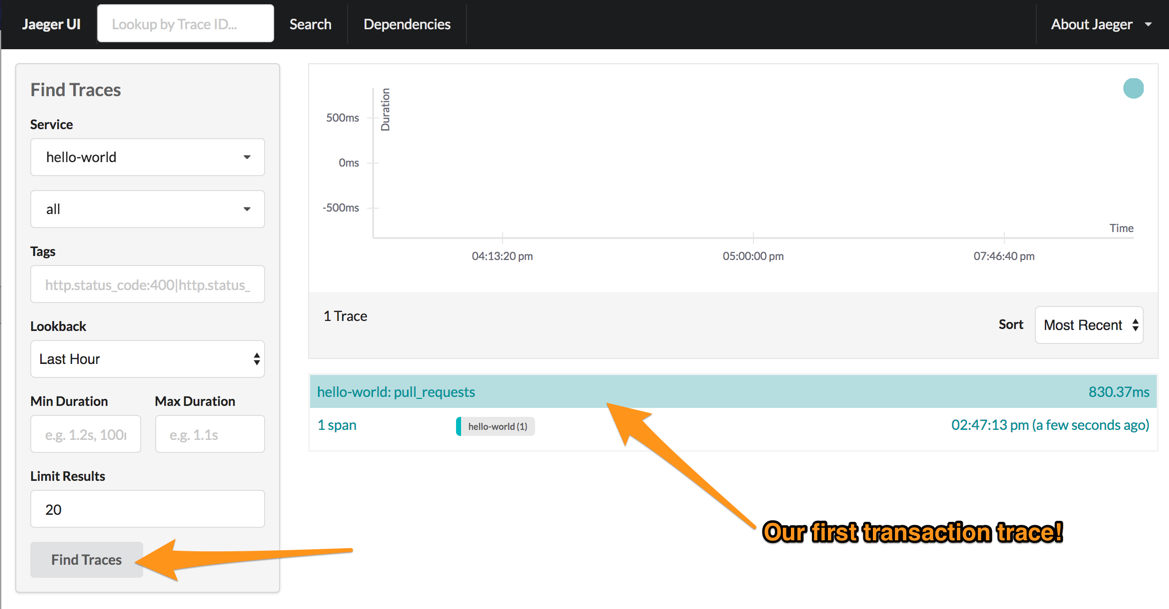
Collect our first trace
Send a web request to http://localhost:5000. Wait a moment, then navigate to http://localhost:16686 and click the "Find Traces" button. You should see your first transaction trace!
Adding spans
Flask-Opentracing automatically traces web requests to our Flask app. However, it doesn't instrument method calls that occur within a web request. In our app, it'd be nice to instrument the GitHub API call and JSON parsing as these are two distinct areas of logic. To do this, we can wrap a span around each piece of code we'd like to instrument:
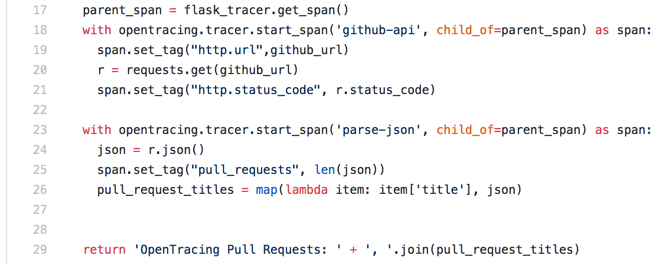
Note how I've added tags. This provides additional context for the span. Jaeger lets us search on these tags as well.
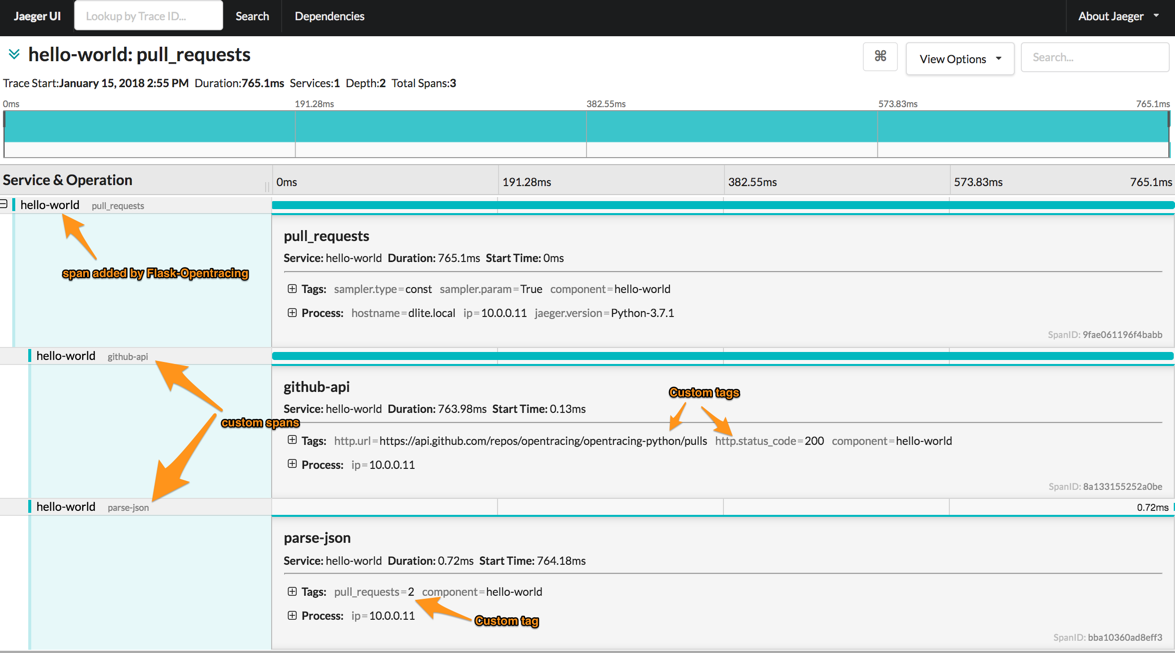
Send a web request to http://localhost:5000, wait a moment, then refresh http://localhost:16686. Inspect your most recent, richer trace:
Summary
With a couple of pieces, we've added vender-neutral tracing to a Python Flask app via OpenTracing. We can view these traces with Jaeger, an open-source distributed tracing system. If we'd like to use a tracing system other than Jeager at some point, we can swap out the tracer by changing a single line of code in our Python app.
Up Next: Distributed tracing in Python
OpenTracing not only defines a consistent API for tracing method calls. It also defines a consistent API for propagating transaction traces across requests handled by microservices. Soon I'll show how to trace a request across a Django and Flask app.