How to Steer Clear of Application Performance Bottlenecks
 Mukul Khanna
on
February 09, 2021
Mukul Khanna
on
February 09, 2021

We are living in a time where a difference of a mere couple of seconds can make you lose your business to another company with a faster, more easily accessible web application. In such a highly competitive space, it is important to squeeze out the maximum amount of performance from your application’s software stack and hardware infrastructure.
However, on this quest to improve performance, we are likely to create imbalances in the abilities of the large number of components that come together to ensure the smooth functioning of a web application. For example, when you upgrade your server CPUs, the system’s memory, network, and disk usage capabilities might become limiting factors, as far as performance is concerned. This is because your CPU would now be capable of getting a lot more done as opposed to the other components that are performing at the same old level, and therefore making you compromise on the maximum achievable performance. This is an example of what a performance bottleneck scenario commonly looks like. However, there are a lot more variables involved in this equation that can be sometimes overwhelming to manage.
In an extremely dynamic environment with fluctuating user traffic, changing user requirements, usage patterns, and application features, our best option is to identify these issues early – by utilizing the best performance monitoring tools out there and understanding how they can make a difference.
In this post, we’ll dive deeper into performance bottlenecks – what they are, their common causes, the different types, and how they can be identified, prevented, and solved, thanks to some amazing tools.
Here’s an outline of what we’ll be covering so you can easily navigate or skip ahead in the guide:
- What are Performance Bottlenecks?
- Common Causes of Bottlenecks
- How to Prevent Bottlenecks from Occurring
What are Performance Bottlenecks?
In software engineering, a bottleneck occurs when the capacity of an application or a computer system is limited by a single component, like the neck of a bottle slowing down the overall water flow. source
As you might know, the functioning of a full-stack web application comprises several components that come together to ensure a smooth overall experience for the end-user. These components include remote hardware (cloud-based) systems (for storing web pages, databases, and other static assets), software frameworks (responsible for hydrating, serving, and rendering web pages), and network systems for data transfer. It is the joint, synchronous working of these individual components that dictate the performance of your web application.
A bottleneck in software engineering refers to the negative effect on performance caused by the limited ability or capacity of one component of the system. This is analogous to the impeding of water-flow caused near a bottle’s constricted neck. The bottleneck in a system is the component that has the lowest throughput i.e. the lowest rate of production or processing speed. In its absence, your application’s performance (like the water’s flow or the traffic in the below diagram) is unobstructed and should proceed with maximum performance.
Bottlenecks are essentially points of congestion in the operating system that create delays and inhibits performance. They not only lead to a terrible user experience, but may also cause the software to fail.
You can also think about a bottleneck as the weakest link of a chain, and just like the proverb “a chain is no stronger than its weakest link”, your application is no more performant than its bottleneck.
An understanding of the bottlenecks in your application’s performance can provide useful insights about components of your application that need to be debugged, fixed, replaced, or upgraded. Let’s dive deeper!
Common Causes of Bottlenecking and How to Identify Them
In this section, we will look at some common causes of bottlenecks in web applications and try to get a sense of how these can be dealt with, for optimizing performance.
CPU Utilization
CPUs are the brains of your server systems. They are responsible for running database queries, processing data, handling information requests, and executing programs. When there are multiple client requests made to the server, these are assigned to different CPU processes and handled parallelly or queued based on its compute capabilities. The more the number of cores in your CPU, and the more the number of threads it can concurrently handle, the more is the number of instructions that can be concurrently executed. This can be critically important for web applications that are dynamic and provide a lot of intensive functionality.
Things can go on smoothly as long as the number of client requests is under-control and the combined processor load is within the limits of your server’s CPU power. However, when experiencing unexpected heavy traffic, these increased number of requests can often be too many for your CPUs to effectively handle, and can therefore affect the performance of all the applications being served off these systems. This can also be caused by excessive, inefficient server-side scripting or insufficient caching.
For example, you might have the fastest M.2 NVMe SSDs, lots of RAM resources, and even the fastest backend scripting framework for serving your web content, but if your CPU lacks in power (cores, supported threads, clocking speeds, etc.), it can be a potential bottleneck for your application’s performance – and therefore make you compromise on what the rest of the components could have enabled you to achieve in terms of performance.
CPU bottlenecks can be avoided by upgrading to more powerful processors – in terms of the number of supported threads, larger cache (on-board memory), clock speeds, or all of the above, based on your requirements.
Memory Bottleneck
Memory in web applications refers to the RAM resources of your server systems. As we all know, RAM is a temporary memory-storage for holding data and making it accessible for the processor to operate upon. It is the amount of RAM that determines the number of processes that can be handled by your CPU.
Insufficient or slow RAM would lead to the processor not receiving data fast enough, and therefore slowing down your application. Things would still continue working because there is the option of offloading data to your disk storage (SSDs and HDDs), but the data would then reach the CPU a whole lot slower.
Here’s an example – you might have the most powerful CPUs for your servers, but if you don’t have enough RAM to make the most of your server setup, it results in a memory bottleneck.
In most cases, dealing with memory bottlenecks is quite straightforward – by upgrading your RAM’s memory and speed. However, when it comes to memory, you might also want to consider inspecting your code and its performance – for efficiency, and issues like memory leaks and memory bloat. A memory leak is a gradual, continuous increase in memory consumption when a part of your program repeatedly fails to let go of memory occupied for temporary use. Memory bloat, on the other hand, is a sharp increase in memory usage due to a sudden allocation of many large objects, often leading to immediate failure.
Even with sufficient RAM resources, memory leaks and bloat can cripple your application and surface potential bottlenecks. You can learn more about these issues and how to tackle them through the following posts on our blog:
- How to Identify and Debug Memory Bloat
- How To Detect and Prevent Memory Leaks
- Debugging Memory Bloat
Network Bottleneck
Network conditions play a major role in your application’s performance on the end user’s device. The speed and amount of data transfer between the server and the client vary based on the bandwidth of the intermediate network components.
A network bottleneck refers to when the volume of data transfer is restricted because of the insufficient bandwidth of a network. In networking vocabulary, this is also known as a hot spot. This can be experienced when there is a surge in user traffic on your website if you have only a small number of servers up and running. This can result in slow data transfer, leading to sluggish, frozen, and unresponsive web pages. It can be frustrating for end-users to deal with, and therefore affect your business.
Network bottlenecks can usually be avoided by upgrading and augmenting the networking infrastructure – routers, switches, hubs, and access points, and examining your users’ geographical distribution, and setting up servers and CDNs accordingly.
Disk Usage Bottleneck
The disk I/O operations involving long-term storage (like HDDs and SSDs) on your server usually account for a significant portion of total data transfer time in web applications.
If your application’s server-side code involves a lot of disk operations, one obvious way to improve speed and performance is by upgrading from HDD (Hard Disk Drive) disk storage to SSD (Solid State Drives) disk storage. Other ways of mitigating disk usage bottlenecks include increasing caching rates in RAMs and reducing data fragmentation.
This might not make much of a difference for static websites but is definitely bound to reflect in websites that involve a significant back and forth between the client, the server, and a database.
Software Bottleneck
So far, we have talked about all the hardware components of an application that are responsible for processing data and exchanging it over the internet. Now let’s discuss software and code – the part of an application that perhaps takes the most amount of time and energy in setting up, building, and maintaining.
There’s a lot that depends on the code you write – the framework you use, the libraries you import, and the development practices you follow. A software bottleneck refers to the situation when your code/software/program is the limiting factor in your setup – when it stymies an application from reaching its maximum performance potential. Let’s take an example to understand this better.
Let’s say you have invested in the most powerful multi-core processors and the fastest and highest RAM for your servers. All of this can be a complete waste when you realize that the web framework you built your application on top of, can not work with multiple CPU streams – it utilizes only one of the cores and therefore can not take advantage of the underlying high RAM, multi-core processor setup. In this case, your software is the performance bottleneck and severely limits your application’s performance. Such a scenario can even occur with relatively economic compute resources.
It’s important to remember that there’s a lot that you can get done with just good code. It’s generally a good practice to inspect the code first – its efficiency and its utilization of system resources before making any major decisions about upgrading server resources. It’s the cheapest, cleanest, and easiest way of squeezing out more performance from your existing setup. Therefore, software bottlenecks can be easily solved by doing group code reviews, maintaining and following a list of best practices, and gaining an in-depth understanding of the underlying mechanics of your code, the framework, and the programming language.
How to Prevent Bottlenecks from Occurring
As you can see, there are a whole lot of components and aspects of a web application that you need to keep in mind when building or maintaining one of your own. All these components of your setup should ideally be working together in synchrony and be complementing each other, instead of being bottlenecks and impeding the performance of the overall application. If this is not achieved, and your components can not perform on the same level, it can lead to wastage of valuable resources.
The first step in preventing bottlenecks is identifying the culpable components in your system. Starting to think about these bottlenecks should ideally begin during the planning stage of your application, and continue throughout development and production, with constant tracking and monitoring of your resources.
In the previous section, we looked at the different levels at which performance can be bottlenecked. As we discussed, it might be a good idea to start at the code-level – ensure efficiency and adherence to the best programming and development practices, get an understanding of its memory and processor requirements, and then gain an understanding of its utilization of underlying resources (for eg. through multi-processing, multi-threading, caching, etc.). However, there are also other aspects that need to be considered, like user-traffic, server load, health, performance and availability, memory bloat and leaks, CPU load, slow database queries, and so much more. This is not a one-time task – it needs to be monitored on a continuous, preferably daily basis.
You can imagine how difficult this can be to manually keep track of – constantly monitoring different components and their performance across separate platforms. If gone unnoticed, these bottlenecks are most likely to surface when there are unexpected surges in user traffic, for which one can’t always be prepared for.
Identifying Bottlenecks is Easiest with the Right Tool
Thankfully, there are Application Performance Monitoring (APM) tools, like Scout, that can automate the monitoring of all the components that we just talked about. With regards to performance bottlenecks, these tools can give you a bird’s eye view of all the important aspects of your application, along with real-time alerts and insights about issues so that they can be fixed before the end-user catches wind of anything.
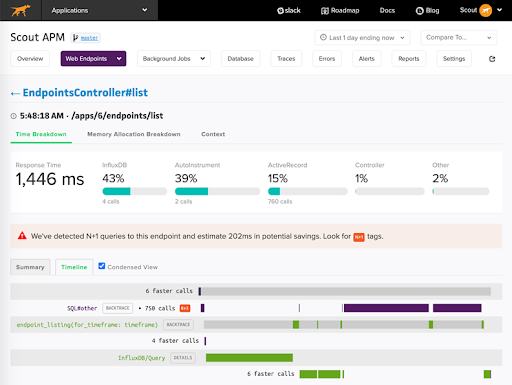
APM tools like Scout allow developer teams to identify, trace and debug bottlenecks to the specific line of code causing them. This level of specificity and context about potential roadblocks for your application help in pinpointing, prioritizing, and resolving issues fast. For example, shown below is a preview from Scout’s dashboard that provides a full analysis of the memory allocation, response times, throughput, and errors corresponding to a specific end-point of your application.
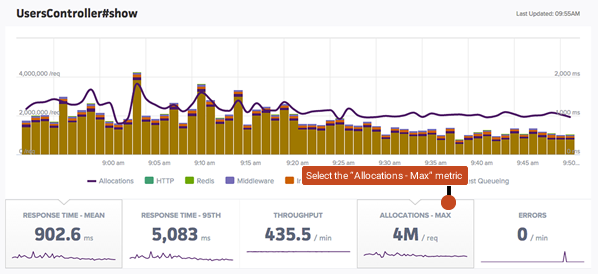
Shown below is another dashboard that provides an overview of memory allocation metrics across multiple end-points in your application. Just a brief look at this can provide you all the information you need to get an overview of how your application is faring, memory-wise.
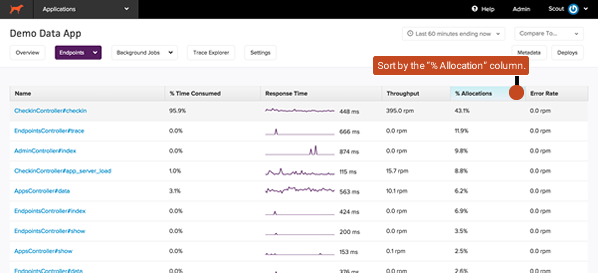 |
| Scout's Endpoint Dashboard |
Intuitive dashboards, coupled with real-time alert notifications and integrations with tools like Slack, Github, Sentry, and Rollbar, Scout allows developers to focus on writing code and building applications while being assured that all issues and anomalies (when they occur, if they occur) will be immediately picked up and brought to attention.
Conclusion
“Any optimization that is not about the bottleneck is an illusion of improvement” – Federico Toledo
In this post, we learned about performance bottlenecks and how they can affect your application. We looked at common causes of bottlenecks in web applications and looked at ways of identifying and solving them. Towards the end, we also discussed the pain of manually tracking your application’s performance across its multiple components, and how this can easily be overcome by using effective Application Performance Monitoring (APM) tools like Scout. Scout APM allows you to easily detect, debug and resolve performance bottlenecks and other issues in your application before they affect the end user’s experience, so that developers can spend more time building applications and less time debugging them.
Cheers! Happy coding!


