FAQ
How we collect metrics
Scout is engineered to monitor the performance of mission-critical production applications. Here’s a short overview of how this happens:
- Our agent is added as an application dependency (ex: for Ruby apps, add our gem to your Gemfile).
- The agent instruments key libraries (database access, controllers, views, etc) automatically using low-overhead instrumentation.
- Every minute, the agent connects over HTTPS through a 256-bit secure, encrypted connection and sends metrics to our servers.
Data Retention
Scout stores 30 days of metrics and seven days of transaction traces.
Performance Overhead
Our agent is designed to run in production environments and is extensively benchmarked to ensure it performs on high-traffic applications.
Our most recent benchmarks (lower is better):
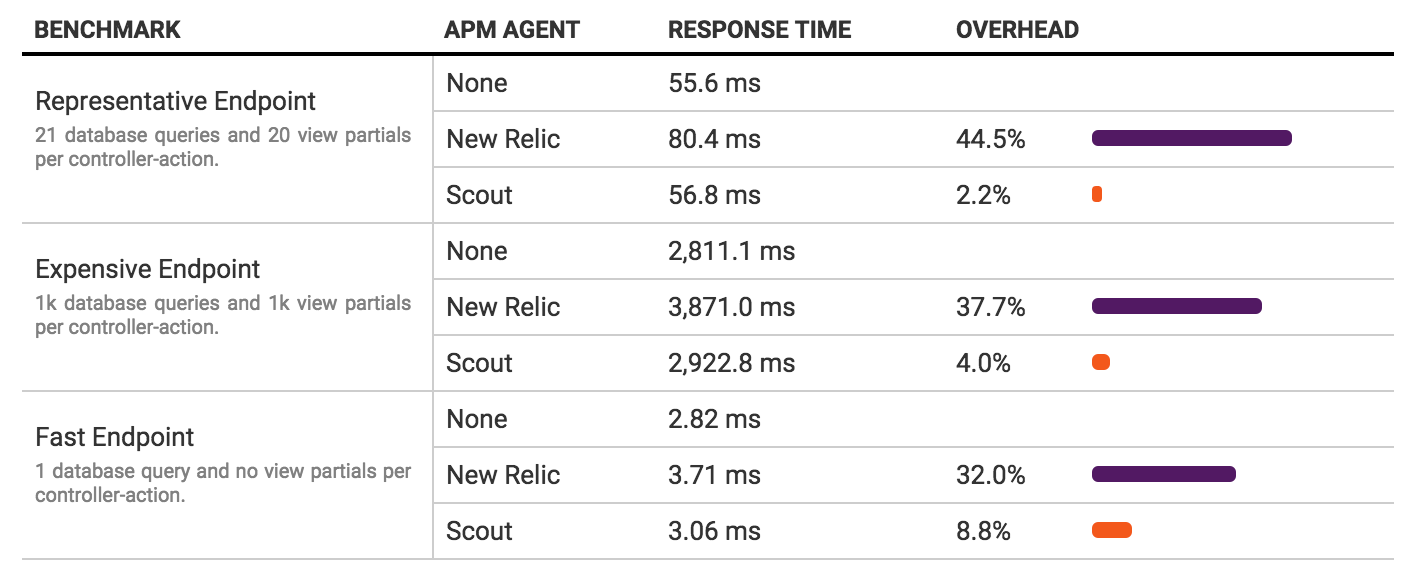
If your results differ, reach out to us at support@scoutapm.com.
Call Aggregation
During a transaction, the Scout agent records each database call, each external HTTP request, each rendering of a view, and several other instrumented libraries. While each individual piece of this overall trace has a tiny memory footprint, large transactions can sometimes build up thousands and thousands of them.
To limit our agent’s memory usage, we stop recording the details of every instrument after a relatively high limit. Detailed metrics and backtraces are collected for all calls up to the limit and aggregated metrics are collected for calls over the limit.
Security
We take the security of your code metrics extremely seriously. Keeping your data secure is fundamental to our business. Scout is nearing a decade storing critical metrics and those same fundamentals are applied here:
- All data transmitted by our agent to our servers is sent as serialized JSON over SSL.
- Our UI is only served under SSL.
- When additional data is collected for slow calls (ex: SQL queries), query parameters are sanitized before sending these to our servers.
- Our infrastructure resides in an SOC2 compliant datacenter.
Information sent to our servers
The following data is sent to our servers from the agent:
- Timing information collected from our instrumentation
- Gems used by your application
- Transaction traces, which include:
- The URL, including query parameters, of the slow request. This can be modified to exclude query params via the uri_reporting configuration option.
- IP Address of the client initiating the request
- Sanitized SQL query statements
- Process memory and CPU usage
- Error counts
Git Integration
Scout only needs read-only access to your repository, but Github doesn’t currently allow this - they only offer read-write permissions through their OAuth API.
Our current Git security practices:
- We don’t clone your repository’s code; we only pull the commit history.
- The commit history is secured on our servers according to industry best practices.
- Authentication subsystems within our application ensure your commit history is never exposed to anyone outside your account.
All that said, we suggest the following:
- You are able to view backtrace information w/o the integration. It’s likely possible to even write a UserScript to open the code locally in your editor or on Github.
Workaround for read-only Github Access
With a few extra steps, you can grant Scout read-only access. Here’s how:
- Create a team in your Github organization with read-only access to the respective application repositories.
- Create a new Github user and make them a member of that team.
- Authenticate with this user.
AutoInstruments
What files within a Rails app does AutoInstruments attempt to instrument?
AutoInstruments applies instrumentation to file names that match RAILS_ROOT/app/controllers/*_controller.rb.
Why is AutoInstruments limited to controllers?
Adding instrumentation induces a small amount of overhead to each instrumented code expression. If we added instrumentation to every line of code within a Rails app, the overhead would be too significant on a production deployment. By limiting AutoInstruments to controllers, we’re striking a balance between visibility and overhead.
What are some examples of code expressions that are instrumented?
Below are some examples of how AutoInstrumented spans appear in traces.
# RAILS_ROOT/app/controllers/users_controller.rb
# This file will be instrumented as its name matches `app/controllers/*_controller.rb`.
class UsersController < ApplicationController

  def index
    fetch_users # <- Appears as `fetch_users` in traces.
    if rss? || xml? # <- This is broken into 2 spans within traces: (`rss?` and `xml?`)
      formatter = proc do |row| # <- The entire block will appear under "proc do |row|..."
        row.to_json
      end
      return render_xml # <- Appears as `return render_xml`
    end
  end

  private

  def fetch_users
    return unless authorized? # <- Appears as `return unless authorized?` in traces.
    source ||= params[:source].present? # <- Appears as `params[:source].present?`
    @users = User.all(limit: 10) # <- ActiveRecord queries are instrumented w/our AR instrumentation
  end
Is every method call to an AutoInstrumented code expression recorded?
Prior to storing a span, our agent checks if the span’s total execution time is at least 5 ms. If the time spent is under this threshold, the span is thrown away and the time is allocated to the parent span. This decreases the amount of noise that appears in traces (spans consuming < 5ms are unlikely optimization candidates) and decreases the memory usage of the agent. Only autoinstrumented spans are thrown away - spans that are explicitly instrumented are retained.
What do charts look like when AutoInstruments is enabled?
When AutoInstruments is enabled, a large portion of controller time will shift to AutoInstruments:
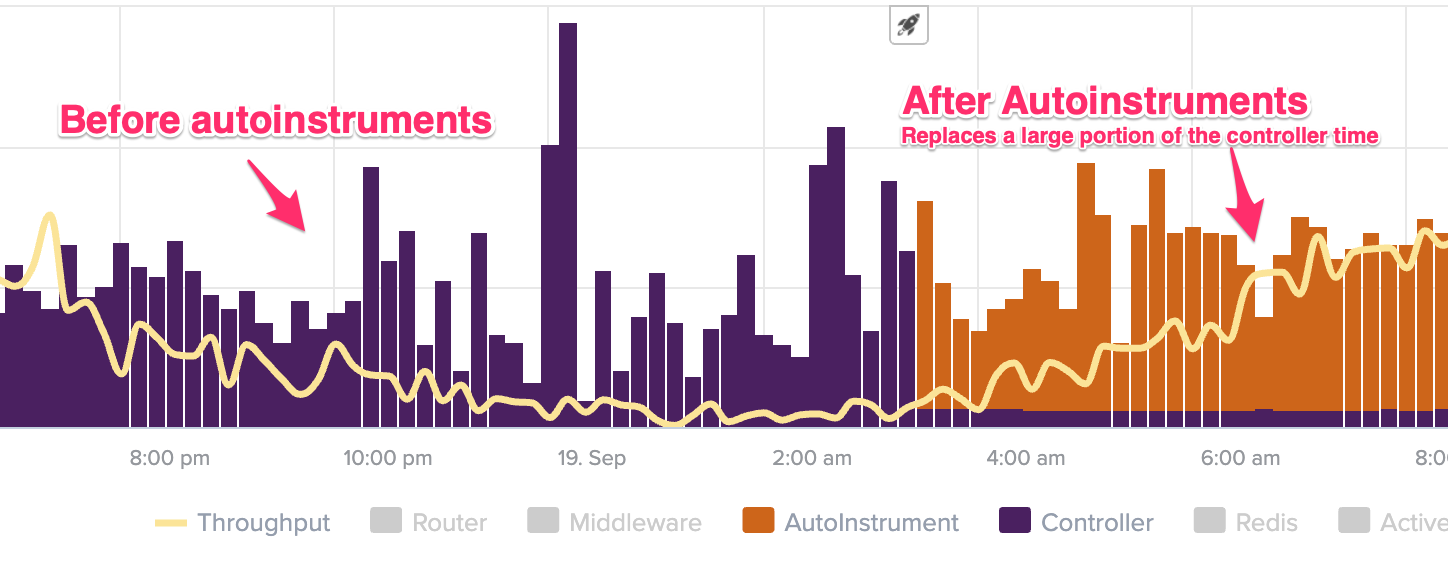
This is expected.
How much overhead does AutoInstruments add?
When AutoInstruments is enabled, you can estimate the additional overhead by inspecting your overview chart. Measure the mean controller time before the deploy then controller + autoinstruments after. The difference between these numbers is the additional overhead.
How can the overhead of AutoInstruments be reduced?
By default, the Scout agent adds AutoInstruments to every controller in your Rails app. You can exclude controllers from instrumentation, which will reduce overhead via the autoinstruments_ignore option. To determine which controllers should be ignored:
- Ensure you are running version 2.6.1 of
scout_apmor later. - Adjust the Scout agent log level to
DEBUG. - Restart your app.
- After about 10 minutes run the following command inside your
RAILS_ROOT:
grep -A20 "AutoInstrument Significant Layer Histograms" log/scout_apm.log
For each controller file, this will display the total number of spans recorded and the ratio of significant to total spans. Look for controllers that have a large total and a small percentage of significant spans. In the output below, it makes sense to ignore application_controller as only 10% of those spans are significant:
[09/23/19 07:27:52 -0600 Dereks-MacBook-Pro.local (87116)] DEBUG : AutoInstrument Significant Layer Histograms: {"/Users/dlite/projects/scout/apm/app/controllers/application_controller.rb"=>
  {:total=>545, :significant=>0.1},
 "/Users/dlite/projects/scout/apm/app/controllers/apps_controller.rb"=>
  {:total=>25, :significant=>0.56},
 "/Users/dlite/projects/scout/apm/app/controllers/checkin_controller.rb"=>
  {:total=>31, :significant=>0.39},
 "/Users/dlite/projects/scout/apm/app/controllers/status_pages_controller.rb"=>
  {:total=>2, :significant=>0.5},
 "/Users/dlite/projects/scout/apm/app/controllers/errors_controller.rb"=>
  {:total=>2, :significant=>1.0},
 "/Users/dlite/projects/scout/apm/app/controllers/insights_controller.rb"=>
  {:total=>2, :significant=>1.0}}
Add the following to the common: &defaults section of the config/scout_apm.yml file to avoid instrumenting application_controller.rb:
common: &defaults
  auto_instruments_ignore: ['application_controller']
ScoutProf
ScoutProf has been deprecated and succeeded by AutoInstruments. ScoutProf is no longer supported.
Billing
Free Trial
We offer a no risk, fully featured, free trial. Enter a credit or debit card anytime to continue using Scout APM after the end of your trial.
Billing Date
Your first bill is 30 days after your signup date.
Subscription Style
We offer both monthly and annual subscriptions with varying transaction levels and capabilities. Contact support@scoutapm.com for pricing options.
Replacing New Relic
Scout is an attractive alternative to New Relic for modern dev teams. We provide a laser-focus on getting to slow custom application code fast vs. wide breadth as debugging slow custom application code is typically the most time-intensive performance optimization work.
In many cases, Scout is able to replace New Relic as-is. However, there are cases where your app has specific needs we currently don’t provide. Don’t fret - here’s some of the more common scenarios and our suggestions for building a monitoring stack you’ll love:
- Browser Monitoring (Real User Monitoring) - there are a number of dedicated tools for both Real User Monitoring (RUM) and synthetic monitoring. We’ve reviewed Raygun Pulse, an attractive RUM product. You can also continue to use New Relic for browser monitoring and use Scout for application monitoring.
Talk to us about your monitoring stack
Don’t hesitate to email us if you need to talk through your monitoring stack. Monitoring is something we know and love.