Features
Scout APM
Scout is Application Monitoring built for modern development teams. It’s built to provide the fastest path to a slow line-of-code. Signup for a trial.
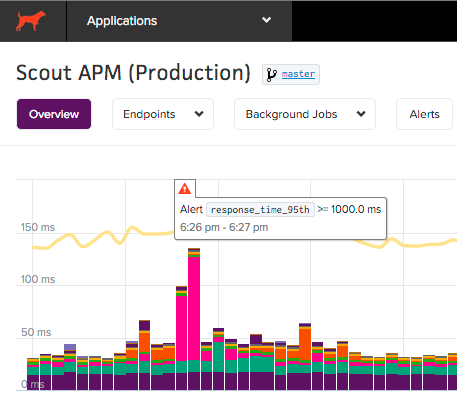
App Performance Overview
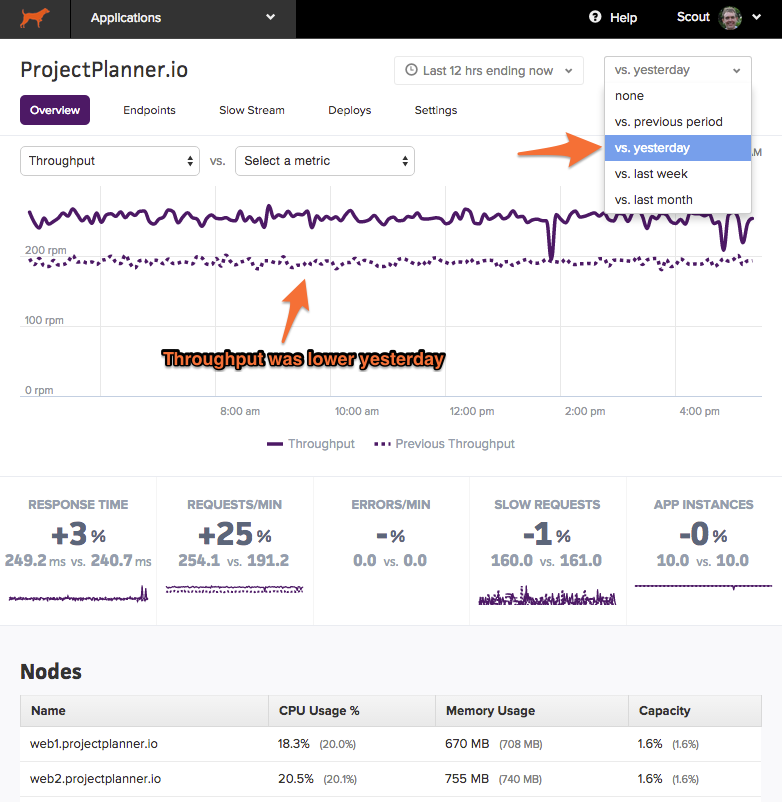
The overview page provides an at-a-glance, auto-refreshing view of your app’s performance and resource usage (mean response time by category, 95th percentile response time, throughput, error rate, and more). You can quickly dive into endpoint activity via click-and-drag (or pinch-and-expand with a mobile device) on the overview chart.
Additionally, you can compare metrics in the overview chart and see how your app’s performance compares to different time periods.
Endpoint Details
You can view metrics for specific controller-action and background job workers. There is a similar chart interaction to the App Performance Overview page, with one difference: your selection will render an updated list of transaction traces that correspond to the selected time period:
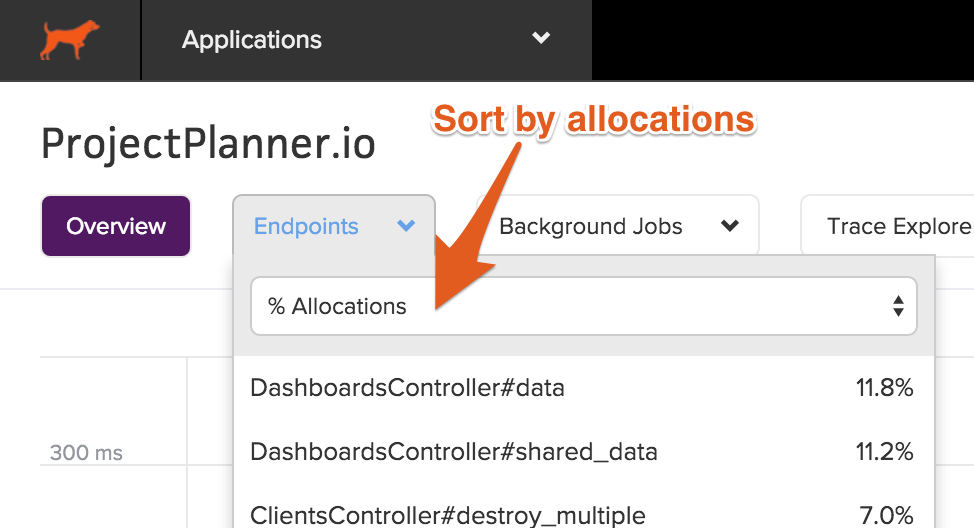
You can sort traces by response time, object allocations, date, and more.
Transaction Traces
Scout collects detailed transactions across your web endpoints and background jobs automatically. The transaction traces provide a number of visual queues to direct you to hotspots. Dig into bottlenecks - down to the line-of-code, author, commit date, and deploy time - from this view.
SQL Queries
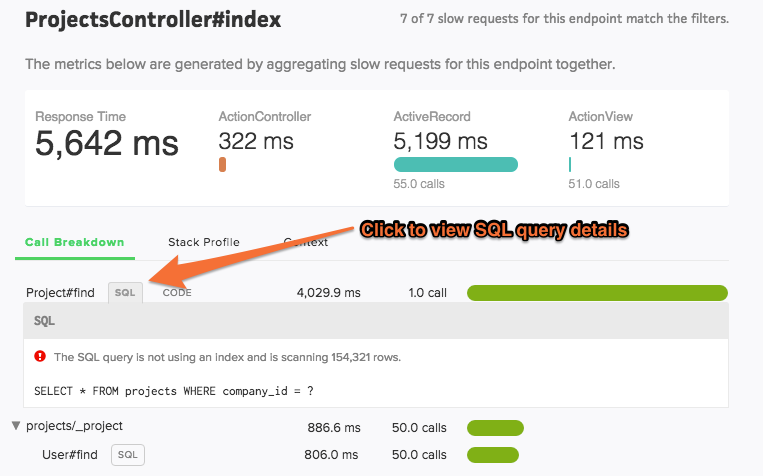
Scout captures a sanitized version of SQL queries. Click the “SQL” button next to a call to view details.
Don’t see an SQL button next to a database query?
Scout collects a sanitized version of SQL queries and displays these in transaction traces. To limit agent overhead sanitizing queries, we do not collect query statements with more than 16k characters.
Code Backtraces
You’ll see “CODE” buttons next to method calls that are >= 500 ms. If you’ve enabled the GitHub integration, you can see the line-of-code, associated SQL or HTTP endpoint (if applicable), author, commit date, and deploy time for the relevant slow code.
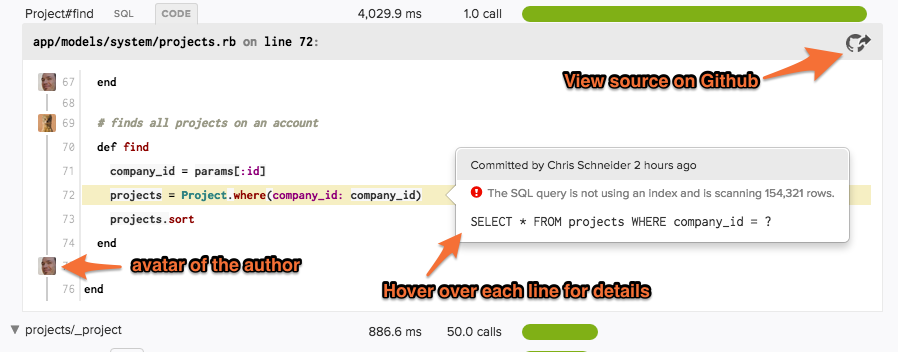
If you don’t enable the GitHub integration, you’ll see a backtrace.
Trace Views
There are two displays for showing the details of a transaction trace:
- Summary View - Method calls are aggregated together and ordered from most to least expensive.
- Timeline View - Shows the execution order of calls as they occur during the transaction.
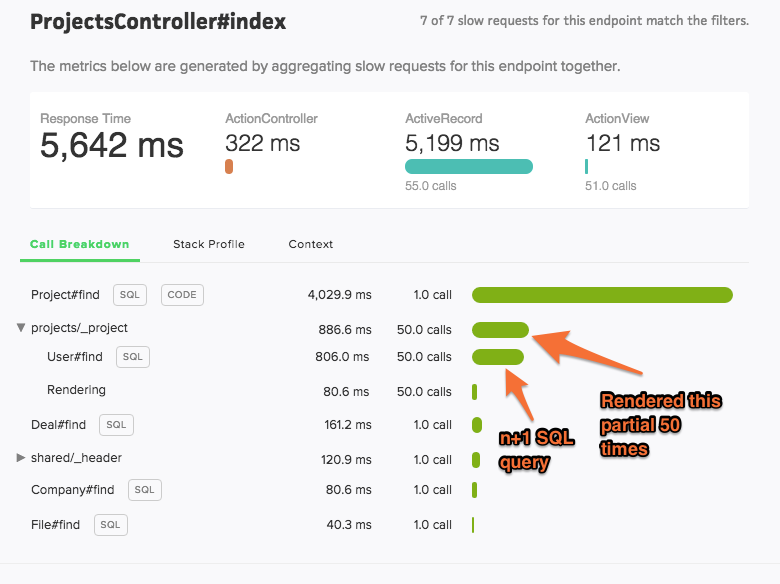
Summary View
Method calls are aggregated together and listed from most expensive to least expensive. The time displayed is the total time across all calls (not the time per-call).
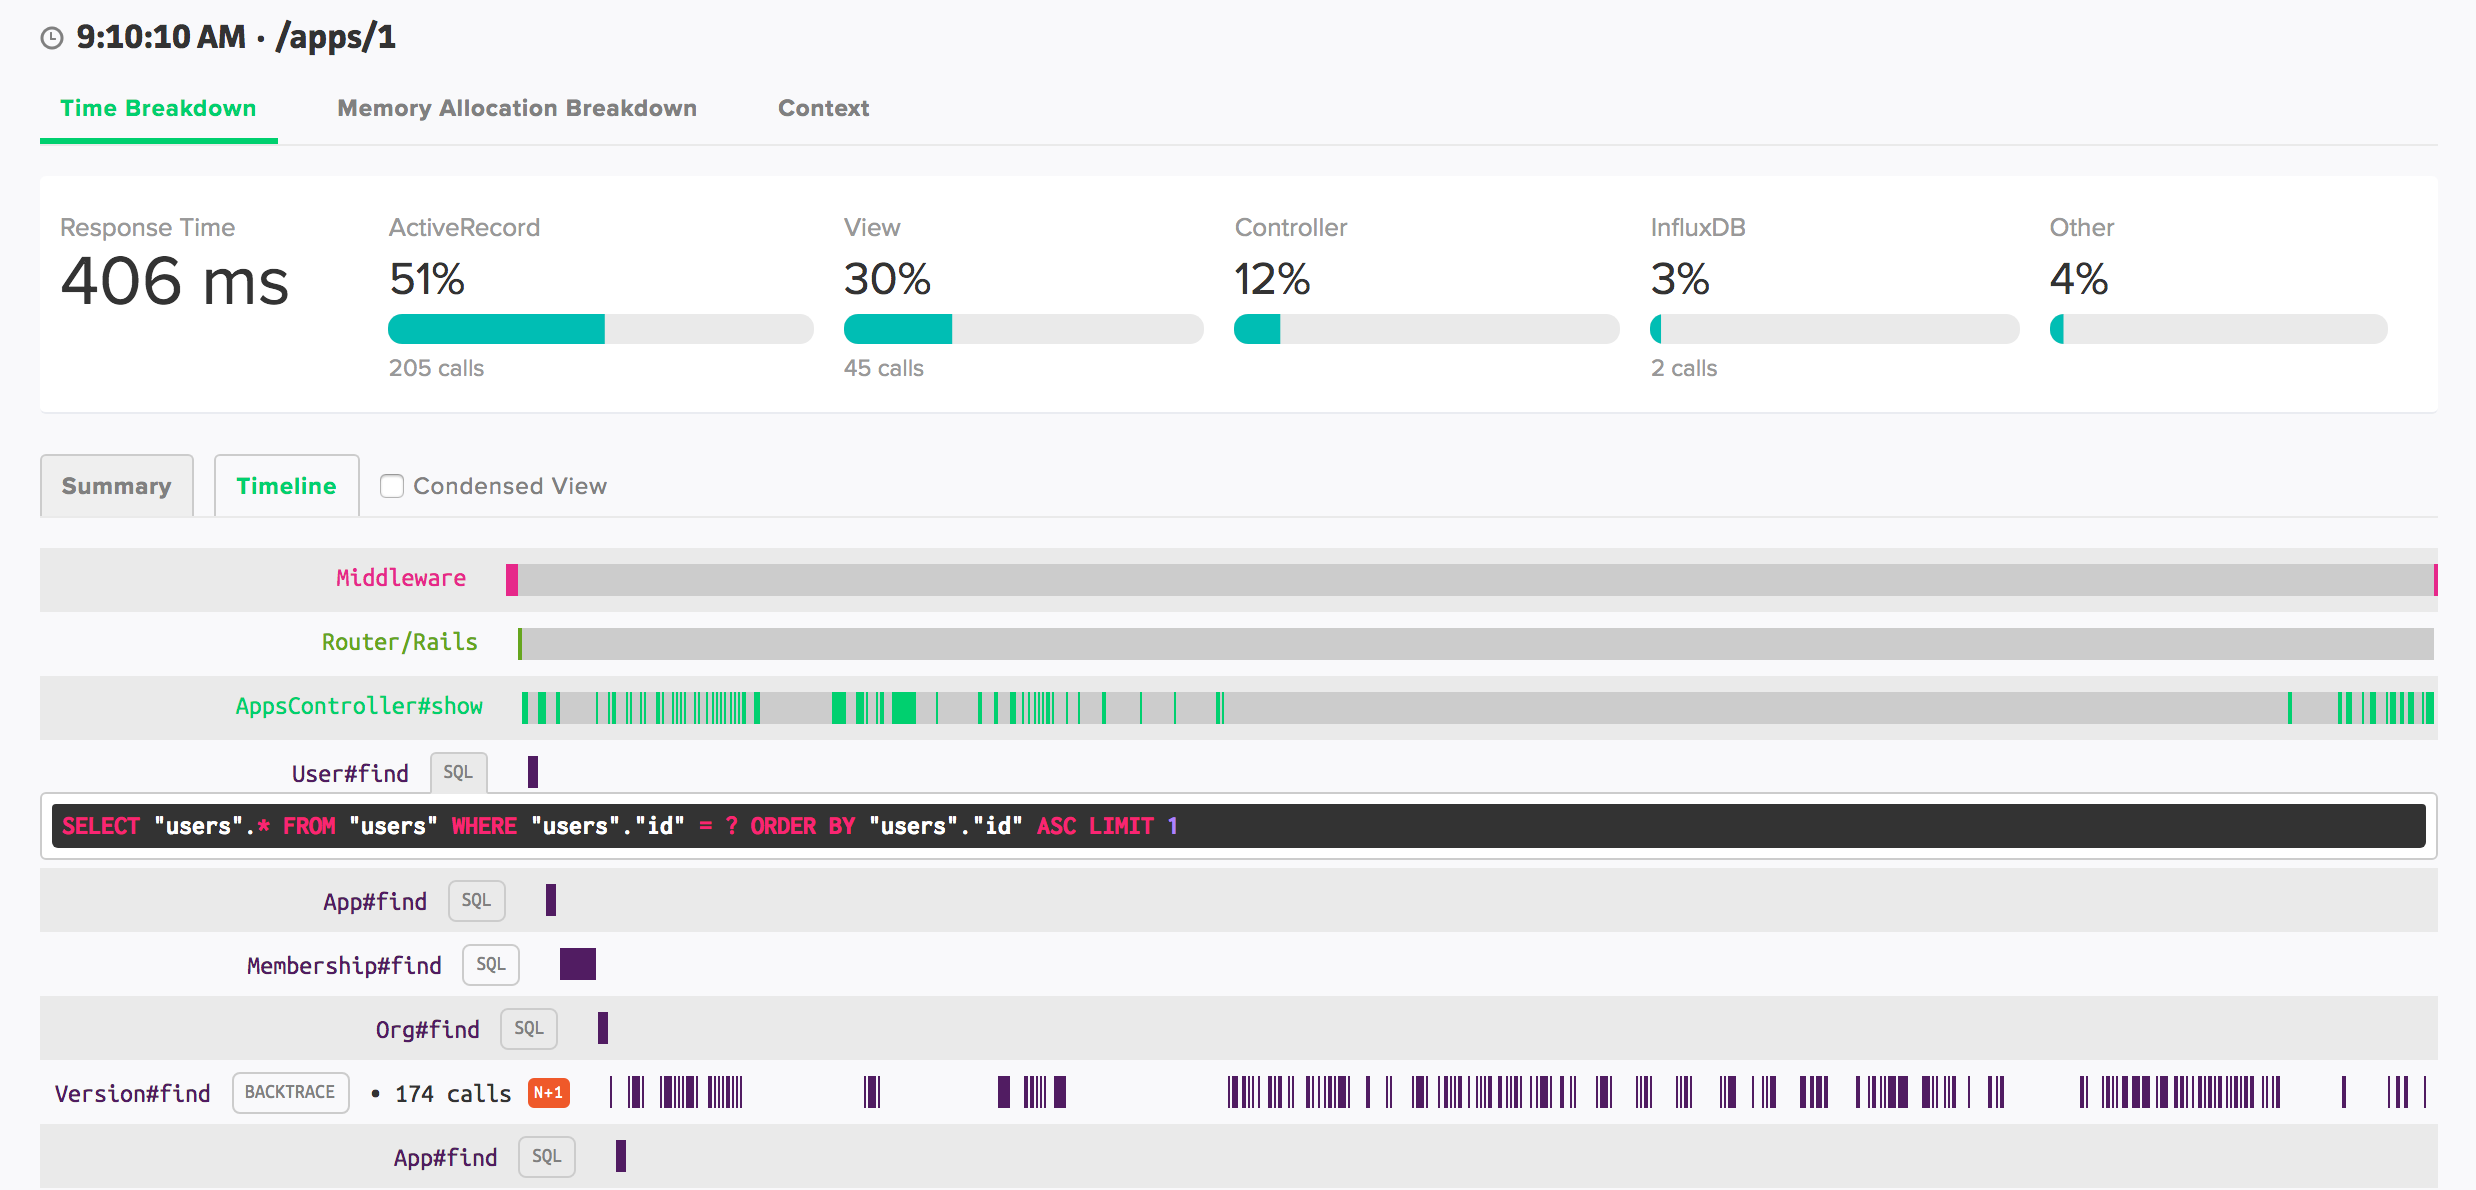
Timeline View
See the execution order of your code.
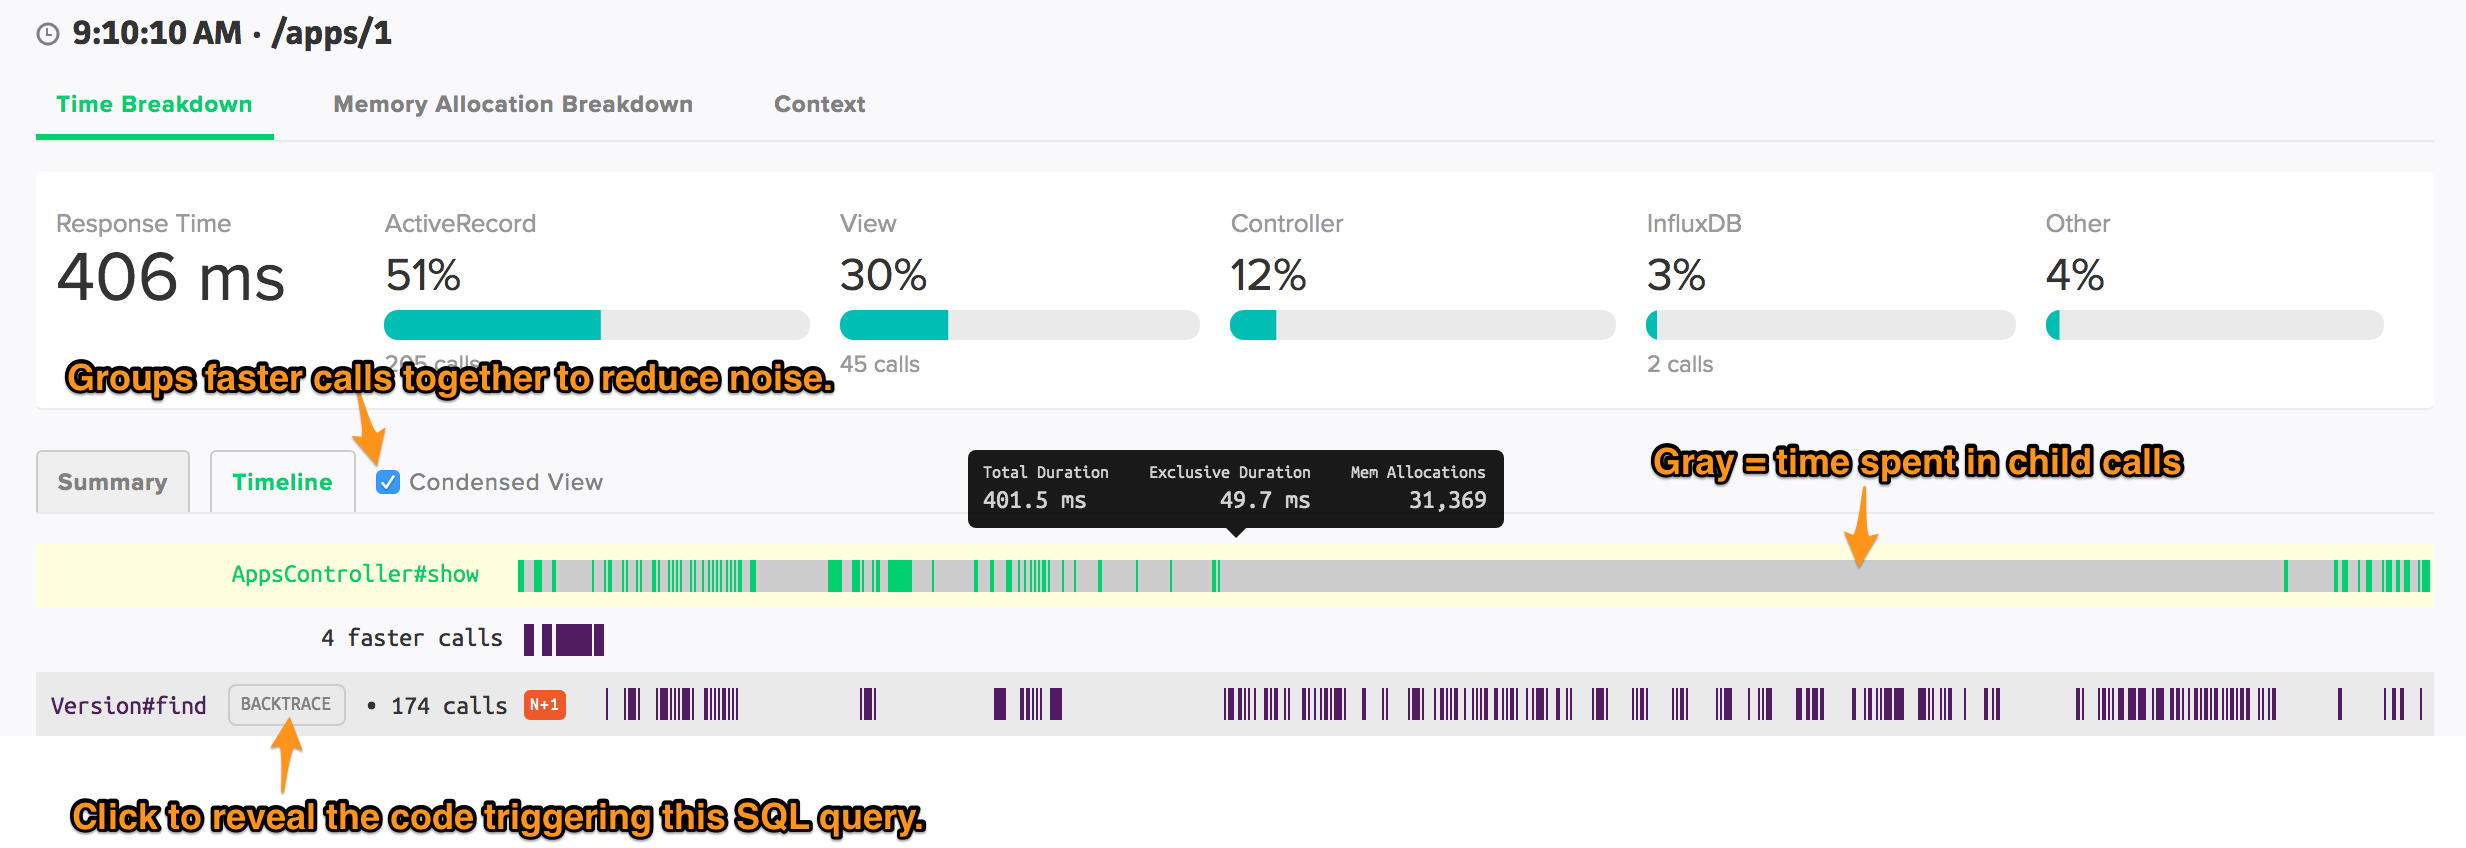
The timeline view is especially helpful for:
- understanding the distribution of
Controllertime across a request. Is there a lot of time spent in your custom code at the beginning of a request? Is it spread out? Is it at the end of a request? - understanding the timing of distinct SQL queries. Is one instance of many nearly identical queries slow or all of them?
- getting the complete picture of parent and children method calls. How many SQL calls are being triggered by the same view partial?
Upgrading to the timeline view
For older Ruby agents, if you see a message in the UI prompting you to upgrade, follow our Ruby agent upgrade instructions to update to the latest agent, which supports sending the timeline trace format.
Timeline view limitations
- No ScoutProf support
- No Background job support
Trace Explorer
What was the slowest request yesterday? How has the app performed for user@domain.com? Which endpoints are generating the bulk of slow requests? Trace Explorer lets you quickly filter the transaction traces collected by Scout, giving you answers to your unique questions.
Trace Explorer is accessed via the “Traces” navigation link when viewing an app.
How to use Trace Explorer
There are two main areas of Trace Explorer:
- Dimension Histograms - the top portion of the page generates a histogram representation for a number of trace dimensions (the response time distribution, count of traces by endpoints, and a display for each piece of custom context). Selecting a specific area of a chart filters the transactions to just the selected data.
- List of transaction traces - the bottom portion of the page lists the individual traces. The traces are updated to reflect those that match any filtered dimensions. You can increase the height of this pane by clicking and dragging the top portion of the pane. Clicking on a trace URI opens the transaction trace in a new browser tab.
Memory Bloat Detection
If a user triggers a request to your Rails application that results in a large number of object allocations (example: loading a large number of ActiveRecord objects), your app may require additional memory. The additional memory required to load the objects in memory is released back very slowly. Therefore, a single memory-hungry request will have a long-term impact on your Rails app’s memory usage.
There are 3 specific features of Scout to aid in fixing memory bloat.
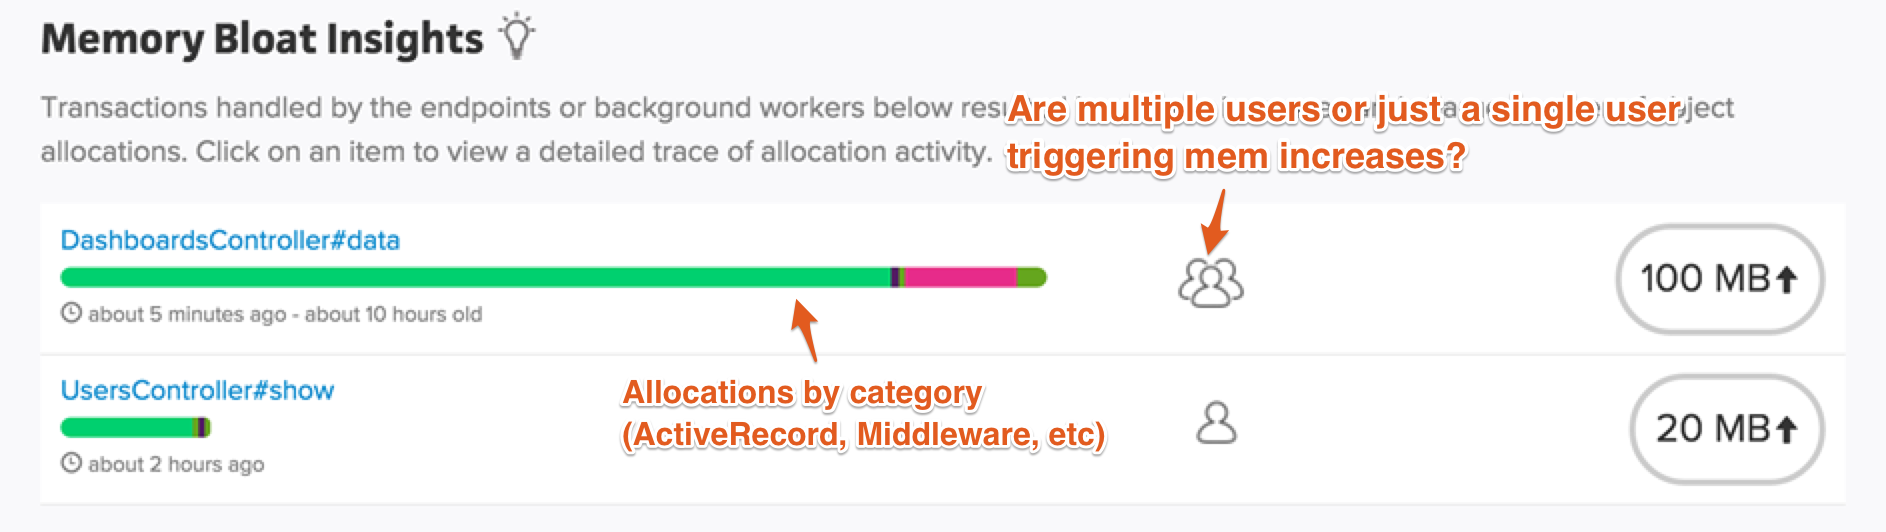
Memory Bloat Insights
The Insights area of the dashboard identifies controller-actions and background jobs that have triggered significant memory increases. An overview of the object allocation breakdown by tier (ActiveRecord, ActionView, etc) is displayed on the dashboard.
Memory Traces
When inspecting a transaction trace, you’ll see a “Memory Allocation Breakdown” section:
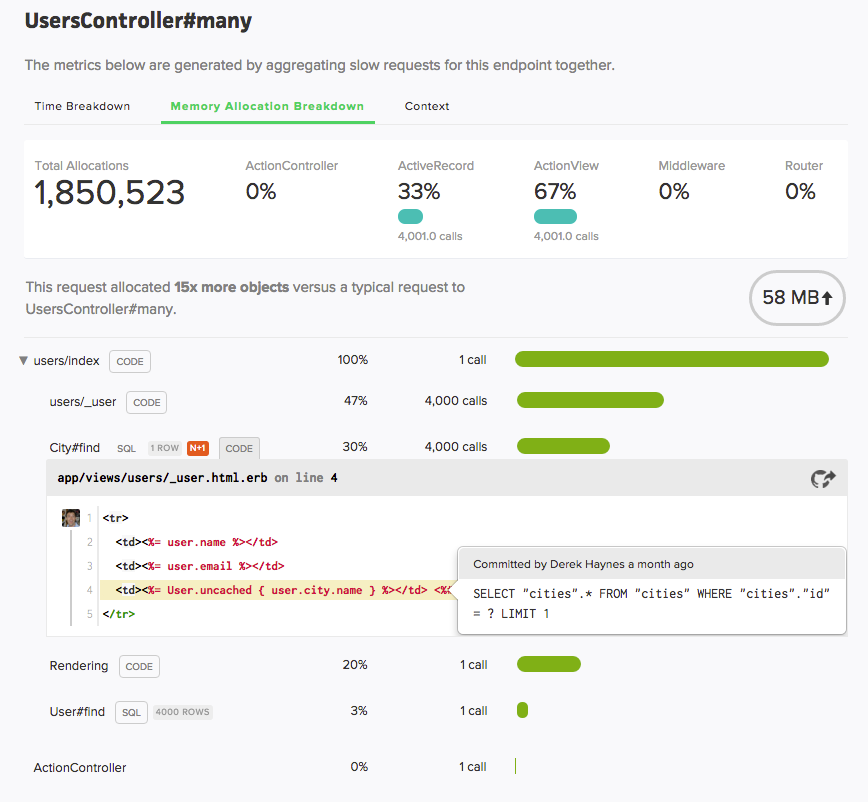
For perspective, we display how this trace’s allocations compare to the norm.
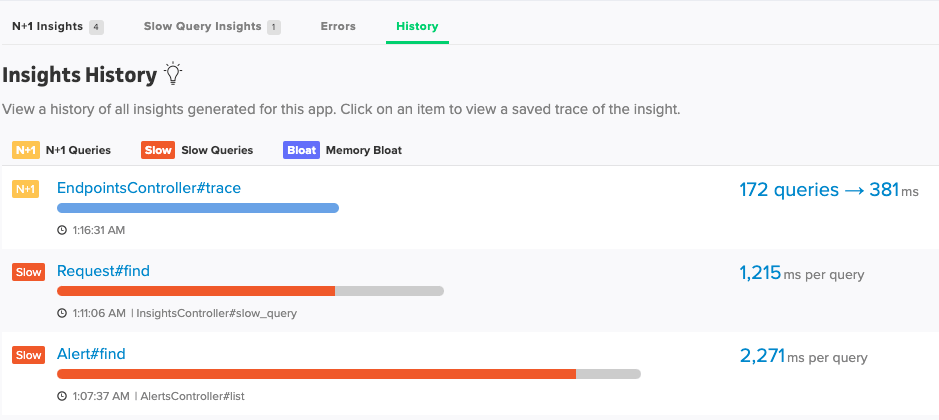
Insights History
In addition to the memory bloat insights, you will be able to view past memory bloat, slow query (if enabled), and N+1 insights. These insights will have a saved trace with them, and these trace have a longer retention period than our normal traces do.
Alerting
Alerting keeps your team updated if your app’s performance degrades. Alerts can be configured on the app as a whole as well as on individual endpoints and background jobs. Metrics include:
Web Requests:
- Mean Response Time
- 95th Percentile Response Time
- Apdex
- Error Rate
- Throughput
- Queue Time
Background Jobs:
- Mean Response Time
- Error Rate
- Throughput
- Queue Time
Setting Up Alerts
There are four parts to alerting, the alert event, the alert conditon, the notification group, and notification channels.
While we will discuss them in this order, it makes more sense to actually create these in reverse order. Starting with first creating a notification channel, then adding this notification channel to a notification group, then assigning this notification group to be notified when alerts are created from the alert condition.
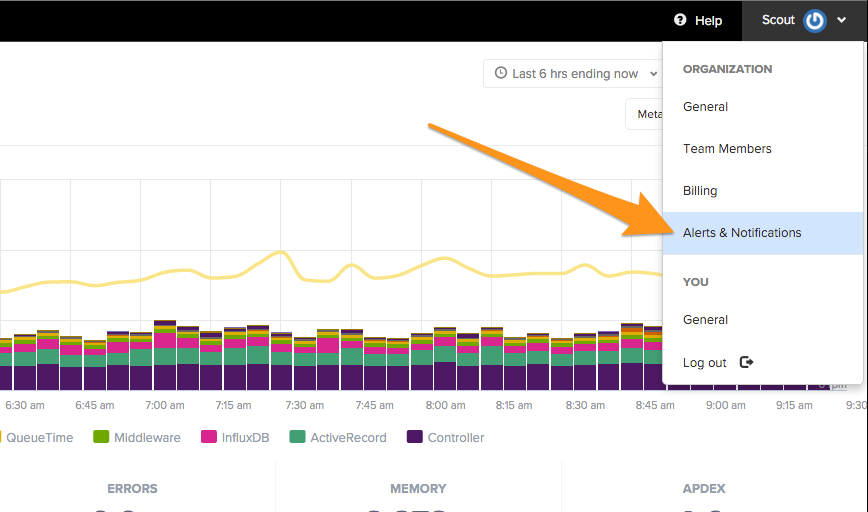
To get started, head to your org’s settings menu:
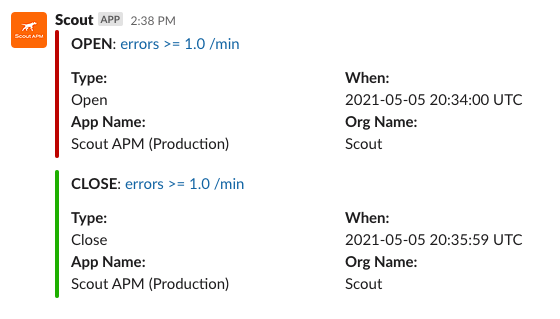
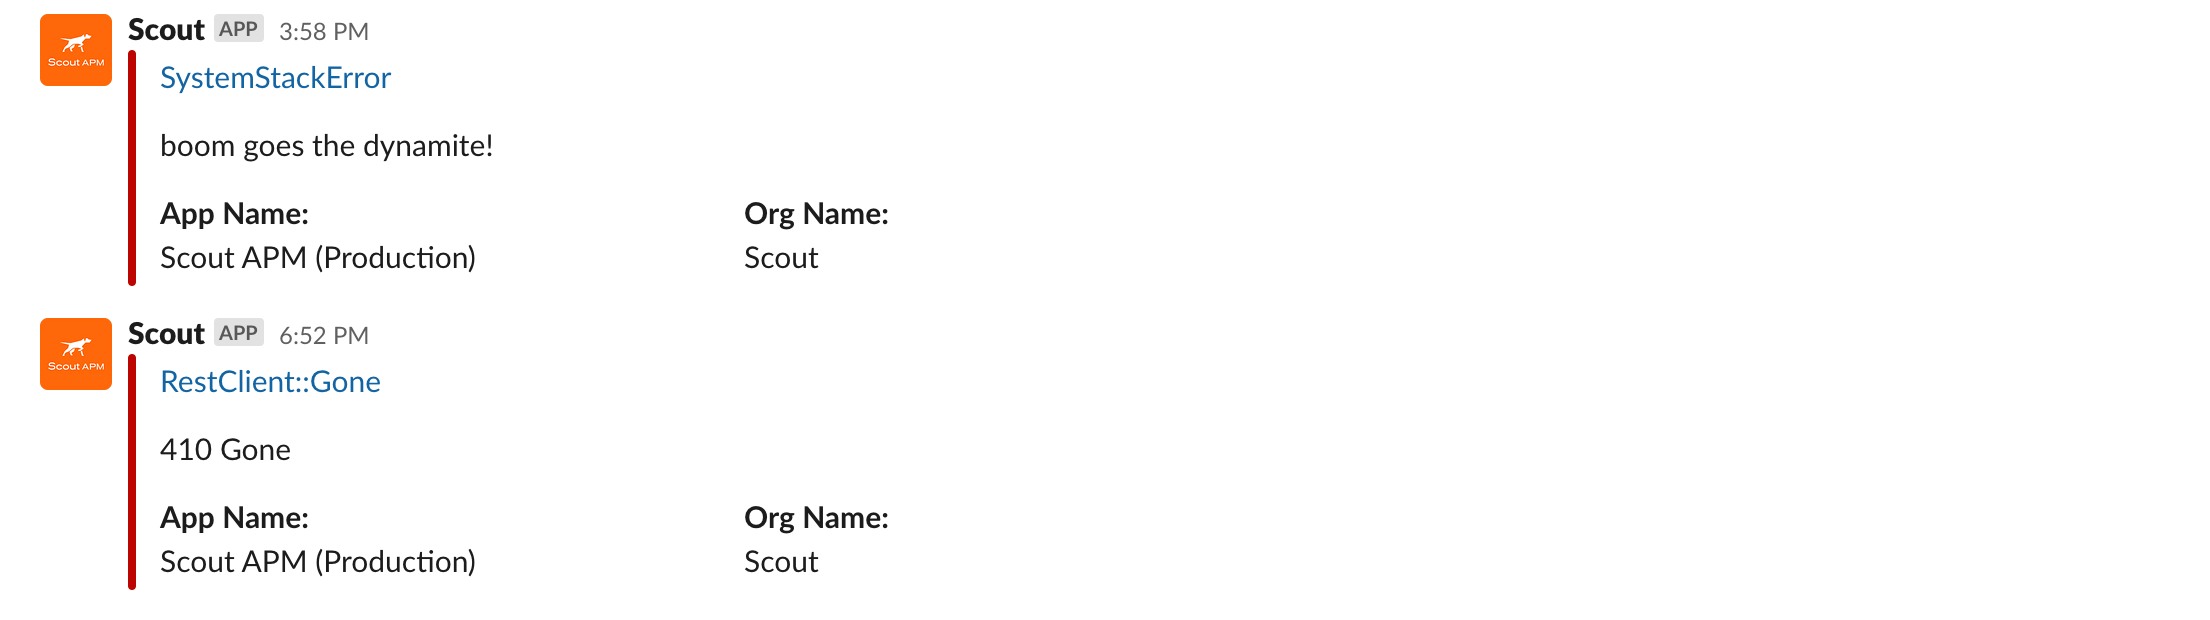
Alert event:
An alert event is created anytime the threshold is passed for an alert condition. This alert event will either be an open event, or a closed event. For example, see the Slack notification alerts below:
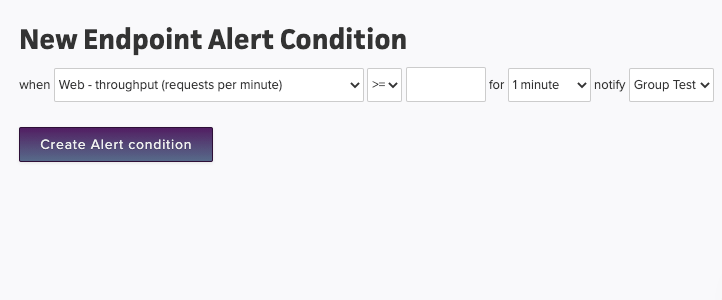
Alert Conditions:
An alert condition is what creates the alert events. Alert conditions are set to check for if the payloads we have received are either great than or lower than one of the metrics listed above.
For example, you can set an alert condition to trigger an alert whenever throughput for all your endpoints exceeds 1000 RPM:
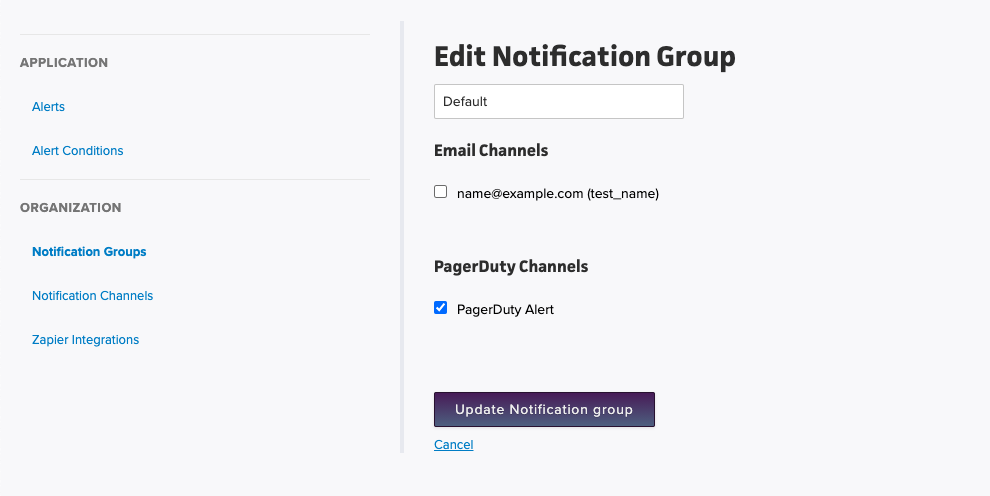
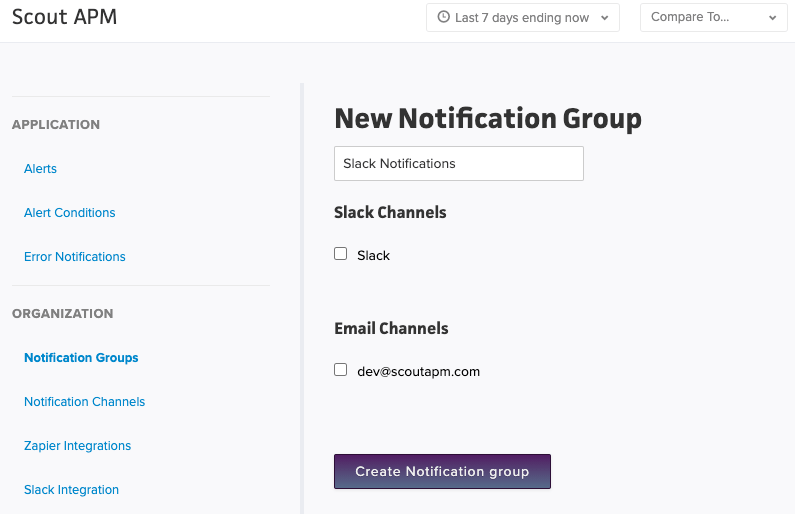
Notification group:
When an alert condition’s threshold has been passed, and an alert has been created, the alert condition will notify the notification group. The notification group will then pass this message to all of its notification channels. For example, if a Slack notification channel, an email notification channel, and a Splunk notification channel are all part of the same group, they will all be notified of the alert event (they will receive both open and close events).
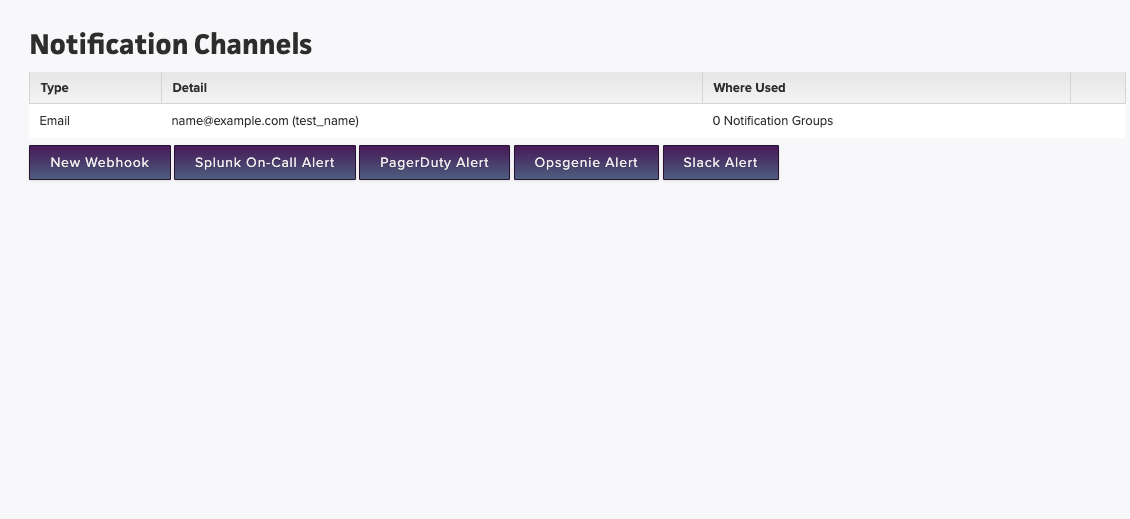
Notification Channel:
A notification channel belongs to a notification group, and is a specific channel that you want to notify. Alerting integrations aren’t just limited to a single notification. For example, you can have multiple Slack notification channels, with each notifying a different slack… channel. A better example is PagerDuty, you can have multiple PagerDuty notification channels, with each channel having a different alert level.
Which Alerts Should I Set?
Setting up alerts can be pretty application dependent. Here are just a few examples below on when to use a specific alert condition:
Throughput:
If you have very consistent traffic, it could be useful setting up throughput alerts for your application. For example, if your application receives 1000 rpm per a minute during peak times, setting up an alert for when your application is 1500 rpm would allow you to see how your application is actually performing under higher stress.
Response Time:
Perhaps for your application there is a critical endpoint that you need responding within in specific amount of time, or a critical background job you need to execute within a set amount of time. Setting up response time alerts against these endpoints and jobs would be useful.
Setting up general application response time can be useful as well. If you have an API application, and your average response time is roughly 80ms, setting up alerts for when your response time goes above 200ms could be quite essential.
Queue Time:
Depending on one’s architure, such as those using a PaaS, getting notifications for when your application is seeing a rise in queuetime can indiciate that your application is starting to reach capacity.
Error Rate:
Depending on one’s application, getting more than 10 errors per a minute can be a sign that things aren’t going smoothly (such as after an errant deploy).
Where can I have alerts sent?
Checkout our alerting integrations page. We can integrate with popular on call tools such as PagerDuty, Splunk On-Call, and Opsgenie. Additionally, you can send your alerts directly to Slack channels where your dev team is located, to your dev’s emails, as well as being able to send alerts to various webhooks and Zapier.
The best part is, you aren’t limited to sending an alert to a single place. When you create a notification channel, such as notifiying a slack channel, sending a critical alert to Splunk, etc. You can assign multiple notification channels to a notification group. When you set up an alert condition, you will assign a notification group to it. This notification group will then notify all notification channels that belong to it.
Setting Up Notifications
There are three parts to receiving error notifications: notification channels, the channel’s notification group, and the apps’s error notificaiton groups.
It makes sense to create the notifications in this order, starting with first creating a notification channel, then adding this notification channel to a notification group, then assigning this notification group to the app’s error notification groups.
To get started, head to your org’s settings menu:
Notification Channel:
A notification channel belongs to a notification group, and is a specific channel that you want to notify. Alerting integrations aren’t just limited to a single notification. For example, you can have multiple Slack notification channels, with each notifying a different slack… channel. A better example is PagerDuty, you can have multiple PagerDuty notification channels, with each channel having a different alert level.
Notification group:
When an exception occurs, and the notificaiton group has been added the app’s error notifications group, we will notify the notification group of the exception. The notification group will then pass this message to all of its notification channels. For example, if a Slack notification channel, an email notification channel, and a Splunk notification channel are all part of the same group, they will all be notified of the exception.
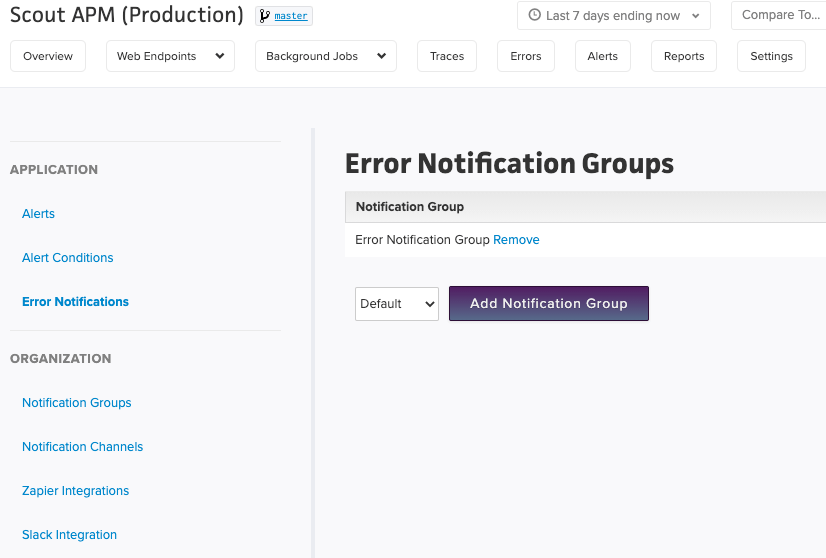
App Error Notification Groups:
Once either a new notification group has been created, or the Default group has had a channel added to it, notification groups will need to be assigned to the app’s error notificaiton groups to be notified of when an exception occurs.
App’s can have as many notification groups assigned to them as needed.
Where can I have error notifications sent?
Checkout our alerting integrations page. We can integrate with popular on call tools such as PagerDuty, Splunk On-Call, and Opsgenie. Additionally, you can send your notifications directly to Slack channels where your dev team is located, to your devs emails, as well as being able to send notifications to various webhooks and Zapier.
The best part is, you aren’t limited to sending an error notificaiton to a single place. When you create a notification channel, such as notifiying a slack channel, sending a critical alert to Splunk, etc. You can assign multiple notification channels to a notification group. When an exception occurs, we will notify all of the channels in the notification group.
Deploy Tracking
Correlate deploys with your app’s performance: Scout’s GitHub-enhanced deploy tracking makes it easy to identify the Git branch or tag running now and which team members contributed to every deploy.
Sorting
You can sort by memory allocations throughout the UI: from the list of endpoints, to our pulldowns, to transaction traces.
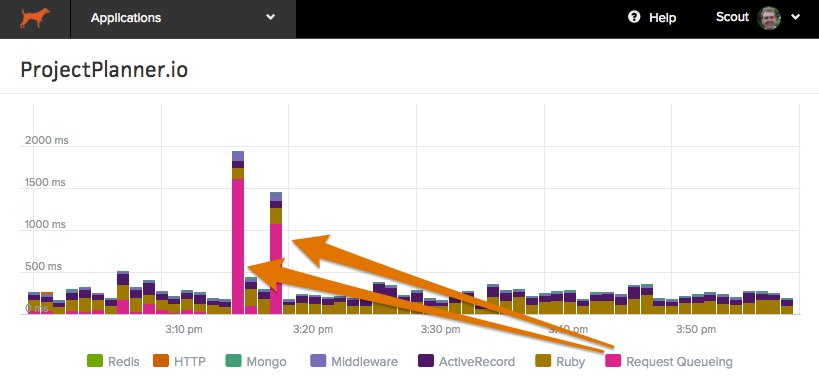
Request Queuing
Our agents can measure the time it takes a request to reach your application from farther upstream (a load balancer or web server). This appears in Scout as “Request Queuing” and provides an indication of your application’s capacity. Large request queuing time is an indication that your app needs more capacity.
To see this metric within Scout, you need to configure your upstream software, adding an HTTP header that our agent reads. This is typically a one-line change.
Setup
HTTP Header
The Scout agent depends on an HTTP request header set by an upstream load balancer (ex: HAProxy) or web server (ex: Apache, Ngnix).
Protip: We suggest adding the header as early as possible in your infrastructure. This ensures you won’t miss performance issues that appear before the header is set.
The agent will read any of the following headers as the start time of the request:
X-Queue-Start, X-Request-Start, X-QUEUE-START, X-REQUEST-START, x-queue-start, x-request-start
Include a value in the format t=MICROSECONDS_SINCE_EPOCH where MICROSECONDS_SINCE_EPOCH is an integer value of the number of microseconds that have elapsed since the beginning of Unix epoch.
Nearly any front-end HTTP server or load balancer can be configured to add this header. Some examples are below.
Heroku
Time in queue is automatically collected for apps deployed on Heroku. This measures the time from when a request hits the Heroku router and when your app begins processing the request.
Apache
Apache’s mod_headers module includes a %t variable that is formatted for Scout usage. To enable request queue reporting, add this code to your Apache config:
RequestHeader set X-Request-Start "%t"
Apache Request Queuing and File Uploads
If you are using Apache, you may observe a spike in queue time within Scout for actions that process large file uploads. Apache adds the X-Request-Start header as soon as the request hits Apache. So, all of the time spent uploading a file will be reported as queue time.
This is different from Nginx, which will first buffer the file to a tmp file on disk, then once the upload is complete, add headers to the request.
HAProxy
HAProxy 1.5+ supports timestamped headers and can be set in the frontend or backend section. We suggest putting this in the frontend to get a more accurate number:
HAProxy < 1.9:
http-request set-header X-Request-Start t=%Ts
HAProxy >= 1.9:
http-request set-header X-Request-Start t=%[date()]%[date_us()]
Nginx
Nginx 1.2.6+ supports the use of the #{msec} variable. This makes adding the request queuing header straightforward.
General Nginx usage:
proxy_set_header X-Request-Start "t=${msec}";
Passenger 5+:
passenger_set_header X-Request-Start "t=${msec}";
Older Passsenger versions:
passenger_set_cgi_param X-REQUEST-START "t=${msec}";
Note: The Nginx option is local to the location block, and isn’t inherited.
AWS
Unfortunately with both ELB and ALB, Amazon adds a X-Amzn-Trace-Id header which only gives time in seconds from epoch. This is not a very accurate measurement, as a result we do not parse this header: https://github.com/scoutapp/scout_apm_ruby/issues/196
Context
Context lets you see the forest from the trees. For example, you can add custom context to answer critical questions like:
- How many users are impacted by slow requests?
- How many trial customers are impacted by slow requests?
- How much of an impact are slow requests having on our highest paying customers?
Adding custom context is easy - learn how via Ruby, Elixir, Python, PHP, and Node
Context information is displayed in two areas:
- When viewing a transaction trace - click the “Context” section to see the context Scout has collected.
- When using Trace Explorer - filter traces by context.
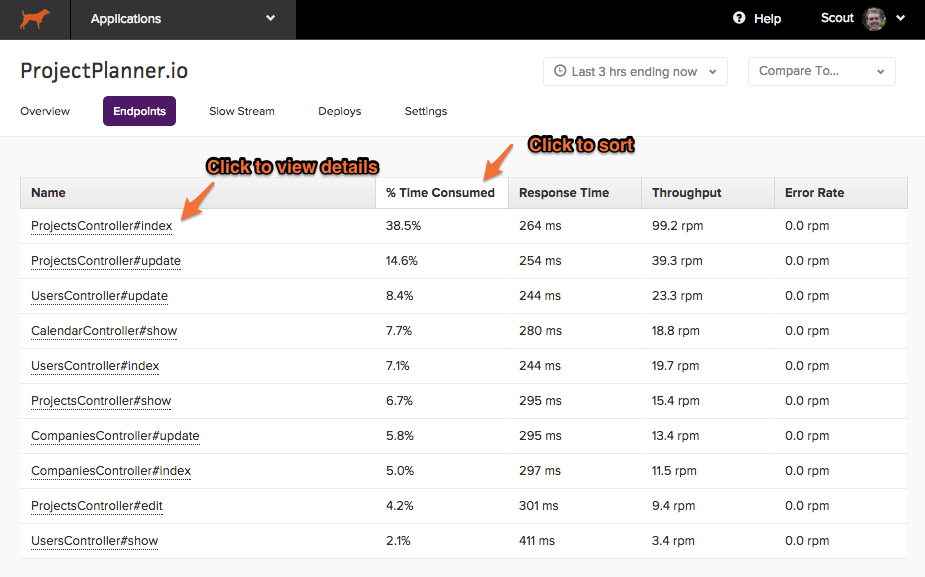
Endpoints Performance
Endpoints Overview
The endpoints area within Scout provides a sortable view of your app’s overall performance aggregated by endpoint name. Click on an endpoint to view details.
Time Comparisons
You can easily compare the performance of your application between different time periods via the time selection on the top right corner of the UI.
Database Monitoring
Supported:


When the database monitoring feature is enabled, you’ll gain access to both a high-level overview of your database query performance and detailed information on specific queries. Together, these pieces make it easier to get to the source of slow query performance.
Database Queries Overview
The high-level view helps you identify where to start:
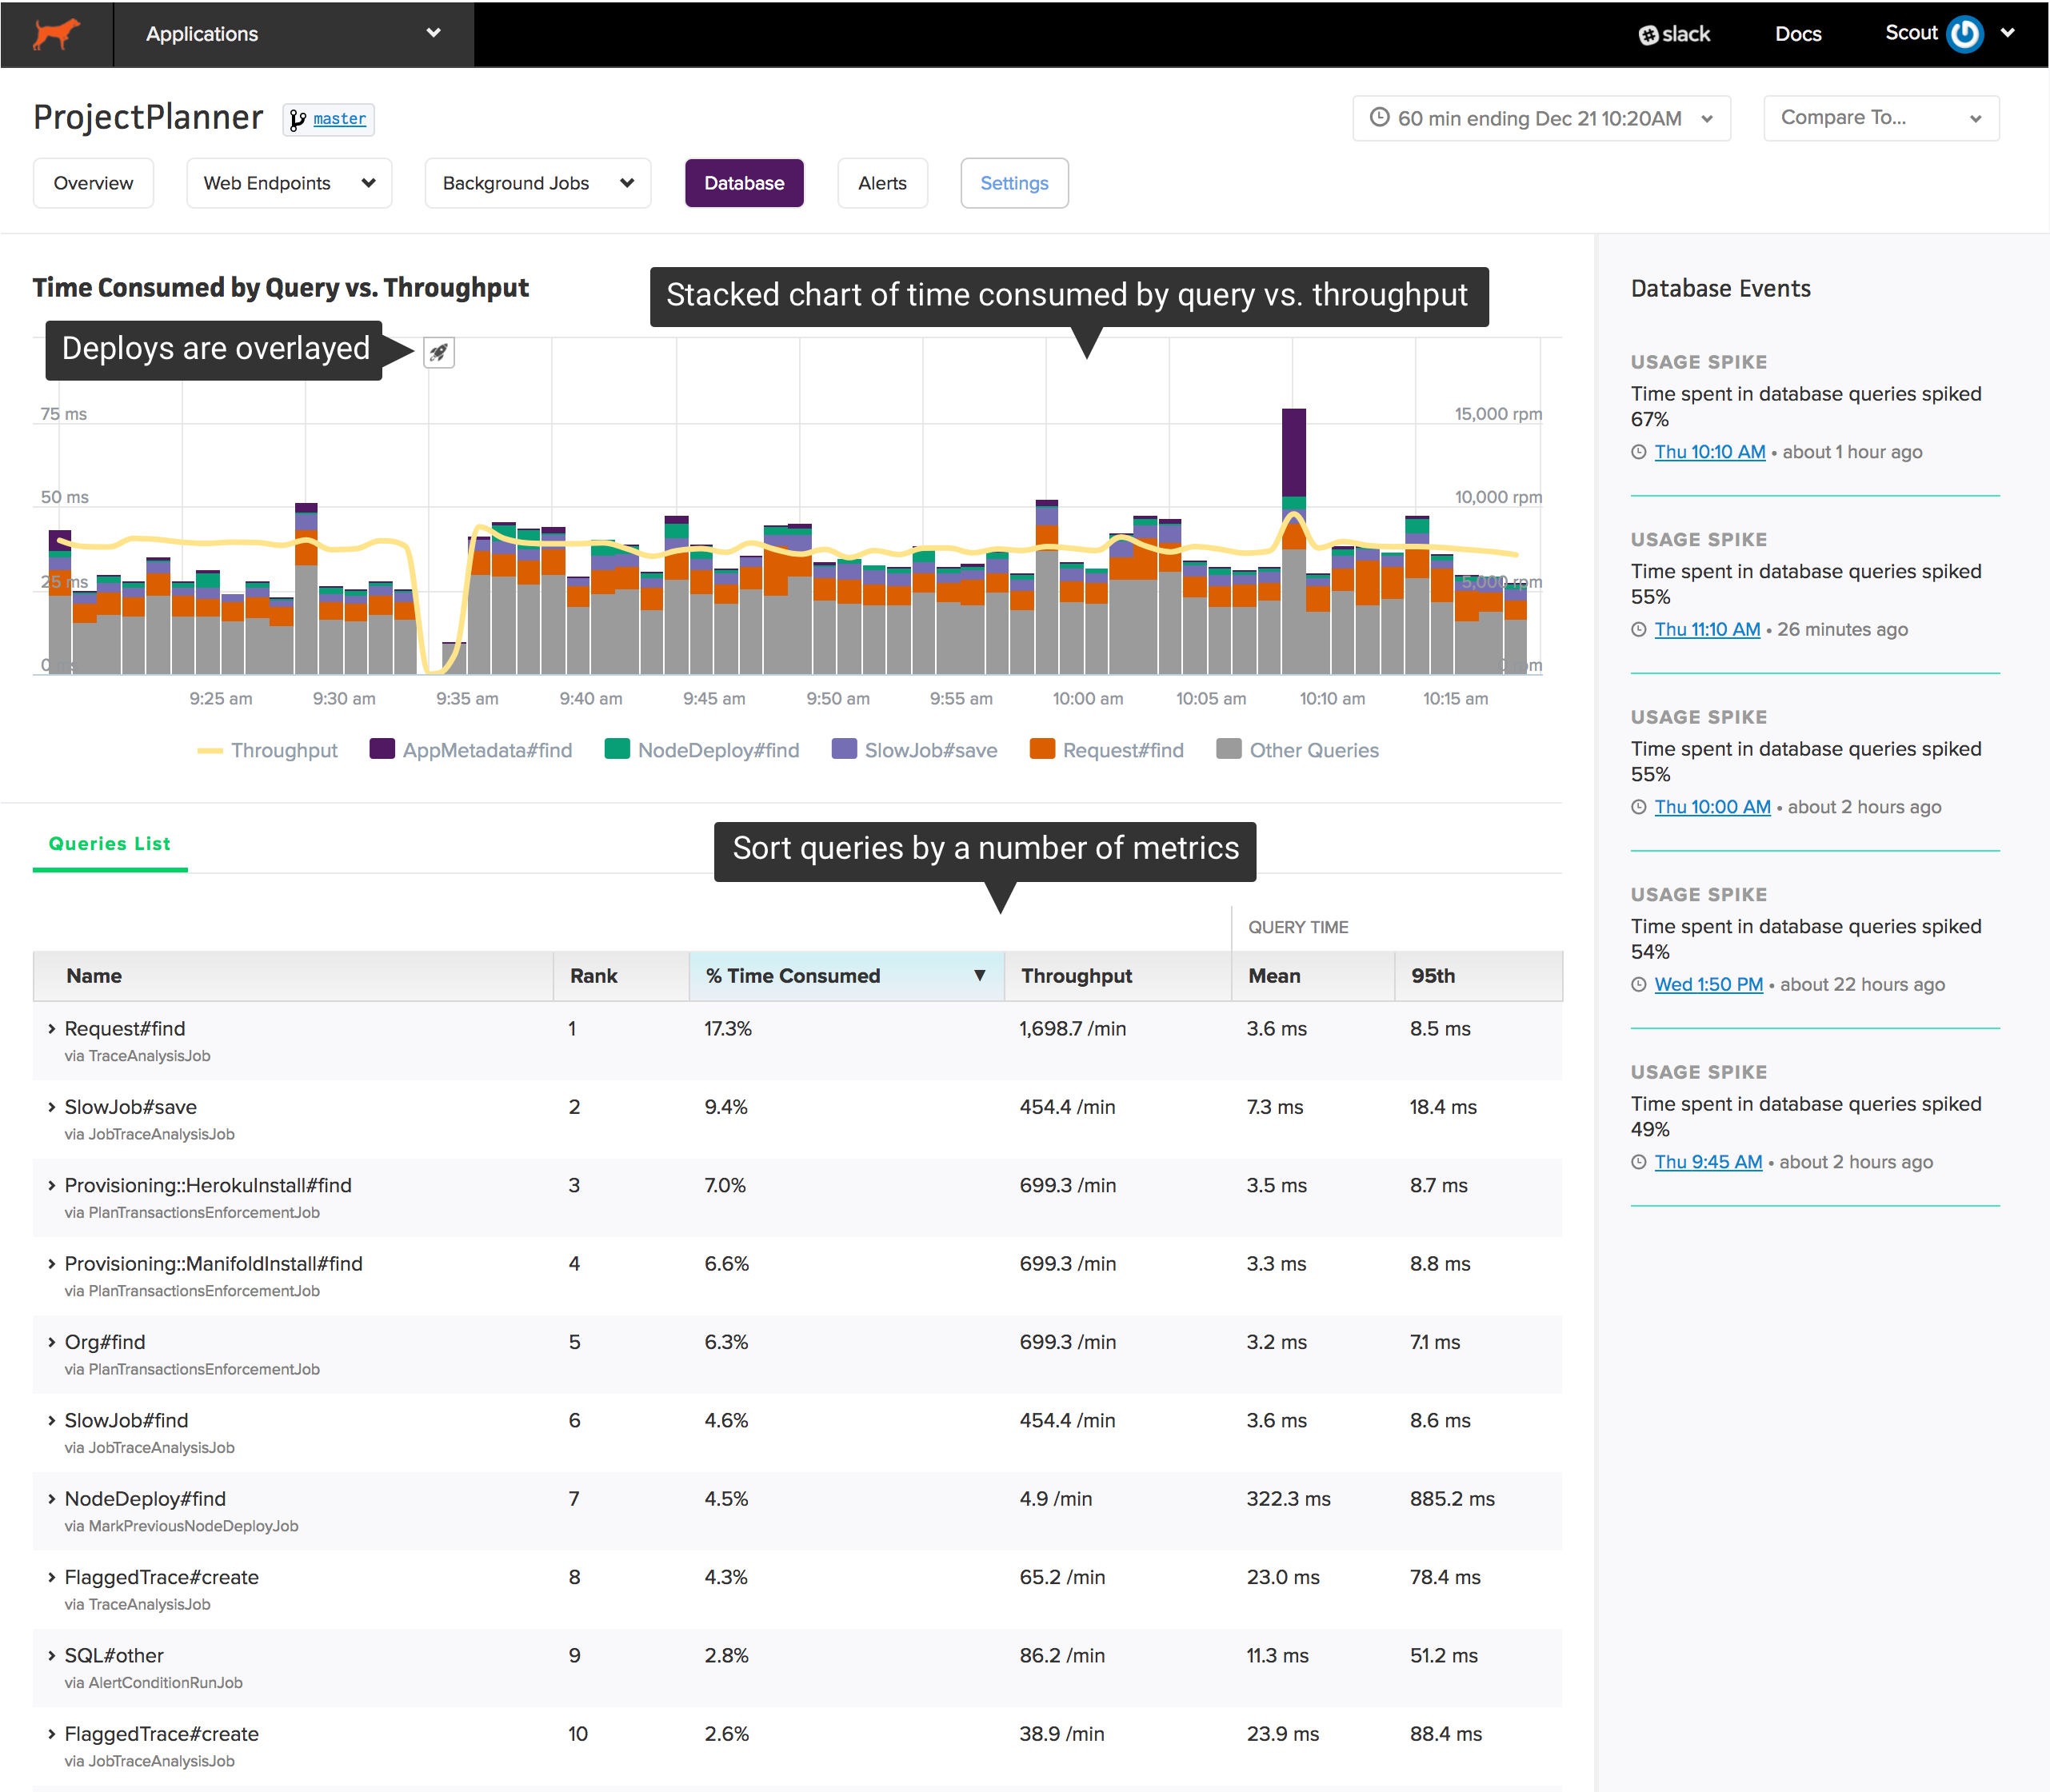
The chart at the top shows your app’s most time-consuming queries over time. Beneath the chart, you’ll find a sortable list of queries grouped by a label (for Rails apps, this is the ActiveRecord model and operation) and the caller (a web endpoint or a background job):
This high-level view is engineered to reduce the investigation time required to:
- identify slow queries: it’s easy for queries to become more inefficient over time as the size of your data grows. Sorting queries by “95th percentile response time” and “mean response time” makes it easy to identify your slowest queries.
- solve capacity issues: an overloaded database can have a dramatic impact on your app’s performance. Sorting the list of queries by “% time consumed” shows you which queries are consuming the most time in your database.
Zooming
If there is a spike in time consumed or throughput, you can easily see what changed during that period. Click and drag over the area of interest on the chart:
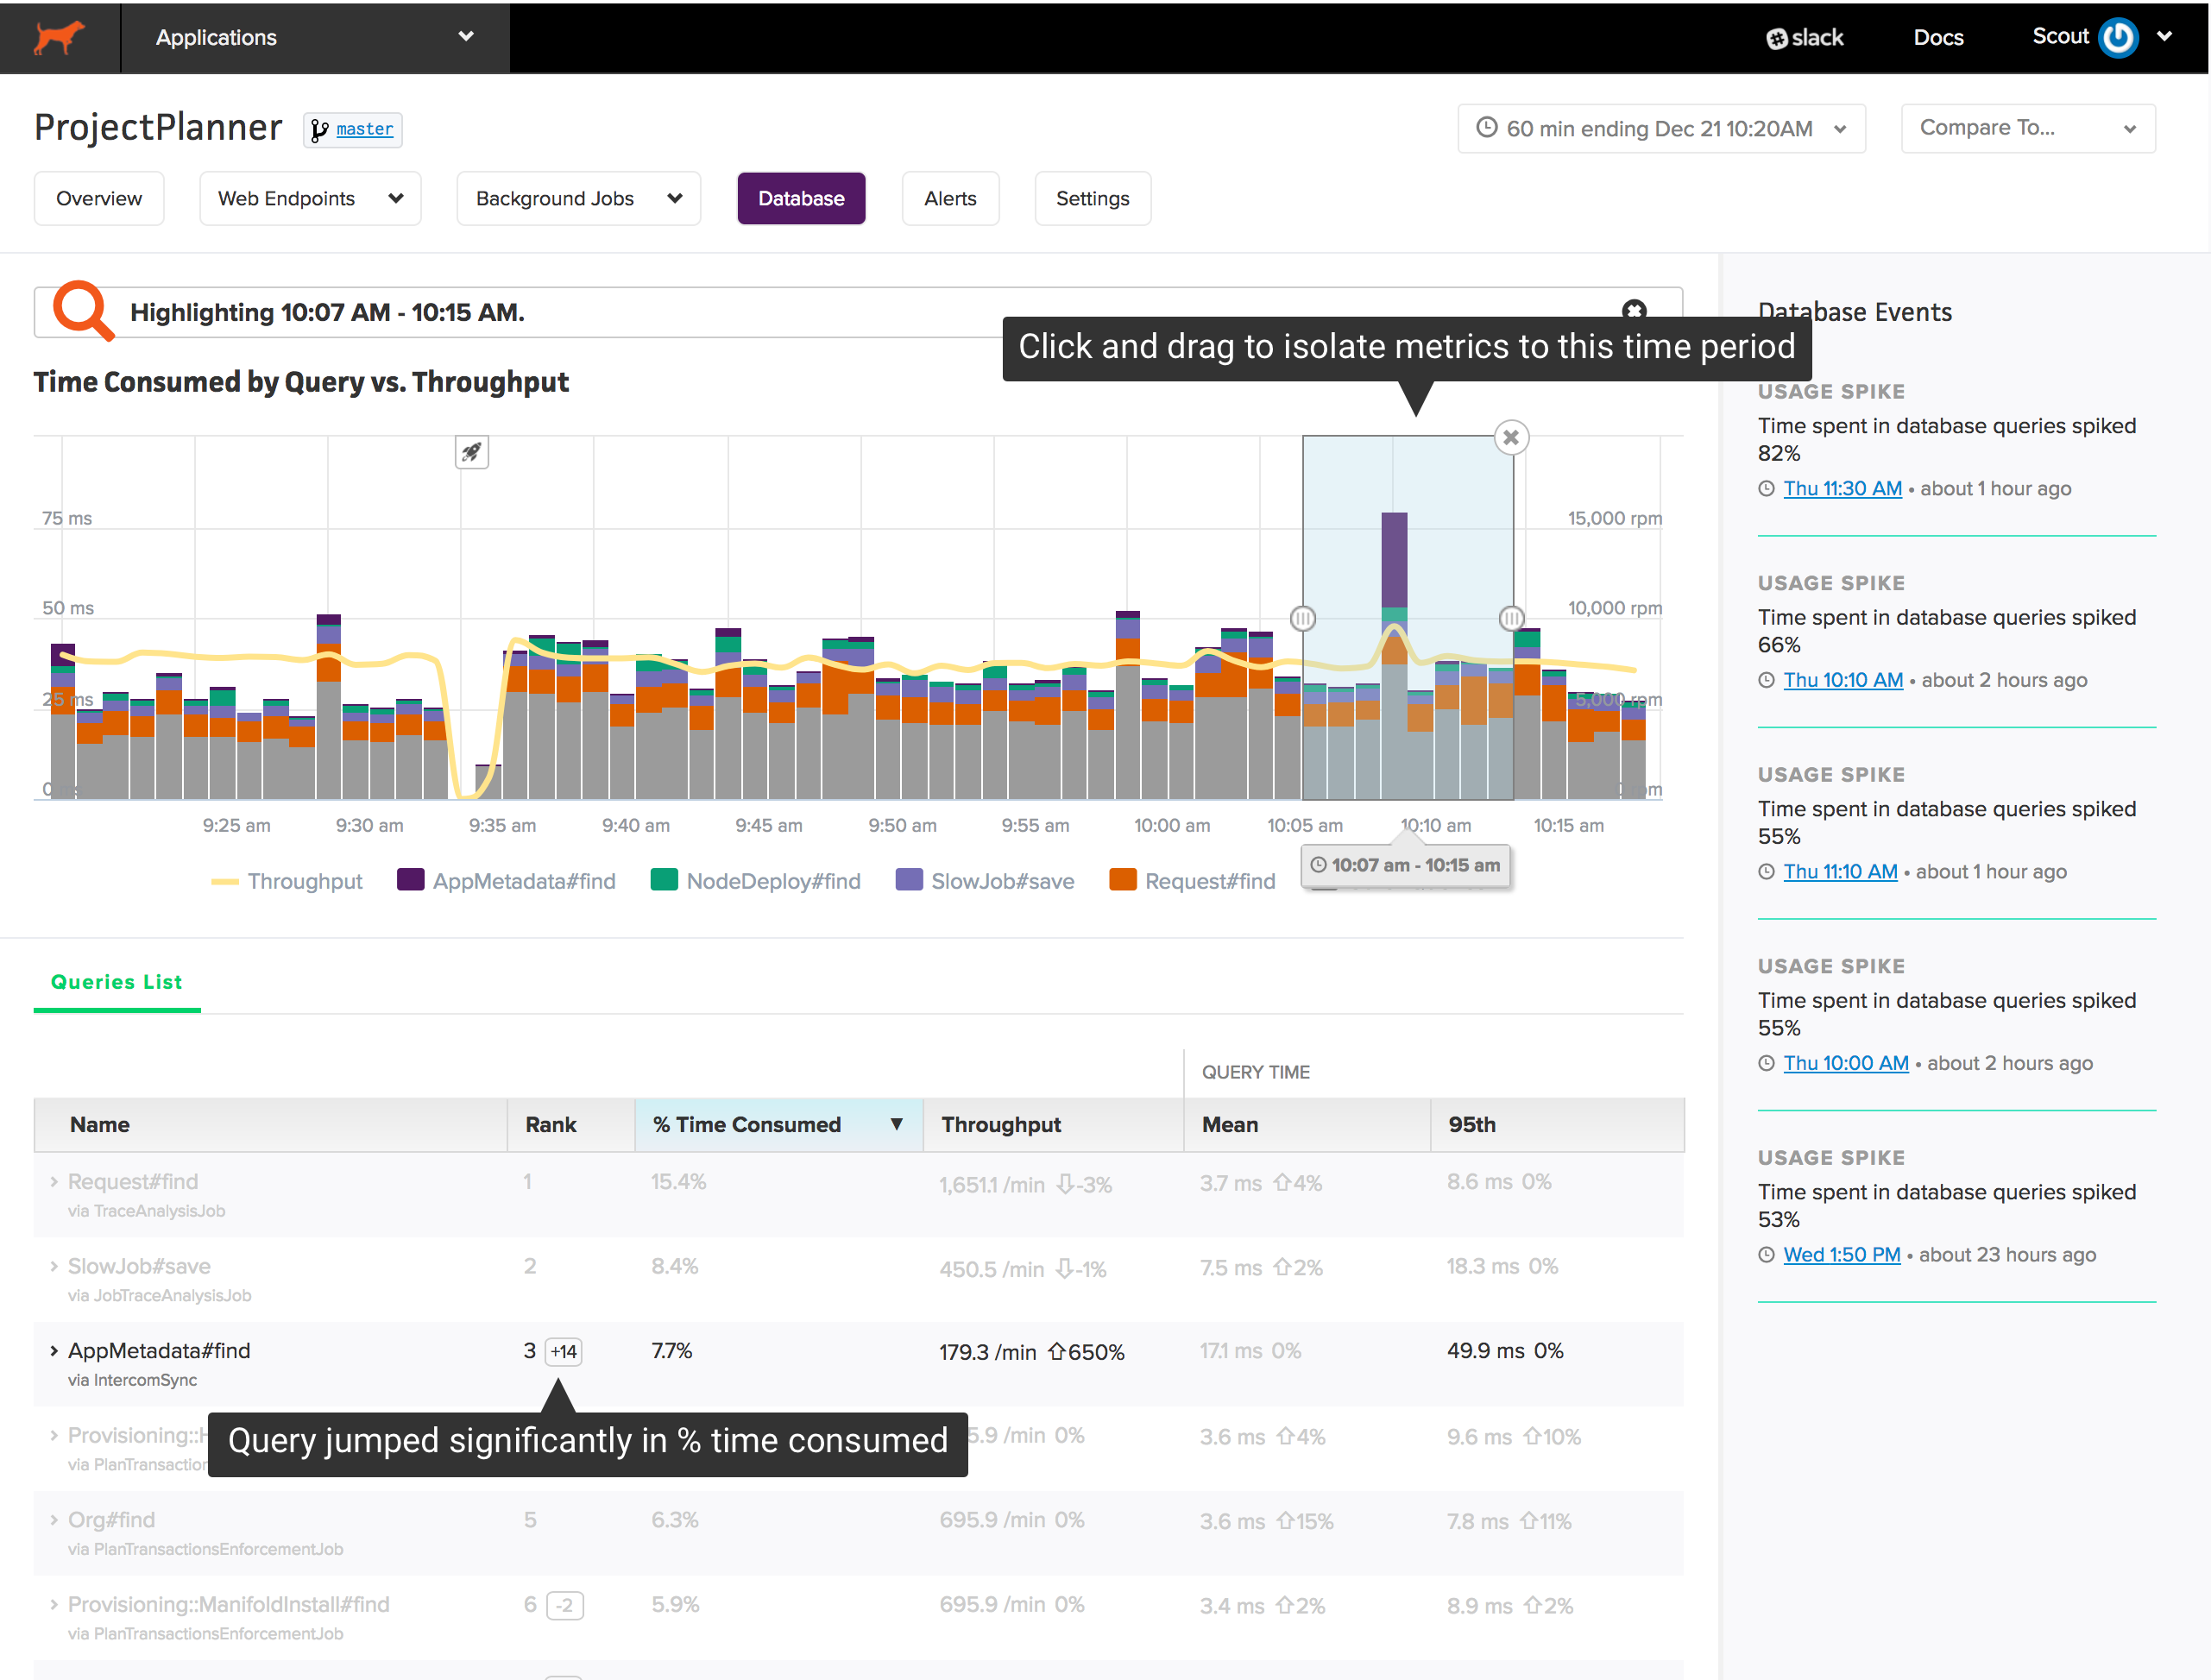
Annotations are added to the queries list when zooming:
- The change in rank, based on % time consumed, of each query. Queries that jump significantly in rank may trigger a dramatic change in database performance.
- The % change across metrics in the zoom window vs. the larger timeframe. If the % change is not significant, the metric is faded.
Database Events
Scout highlights significant events in database performance in the sidebar. For example, if time spent in database queries increases dramatically, you’ll find an insight here. Clicking on an insight jumps to the time window referenced by the insight.
Database Query Details
After identifying an expensive query, you need to see where the query is called and the underlying SQL. Click on a query to reveal details:
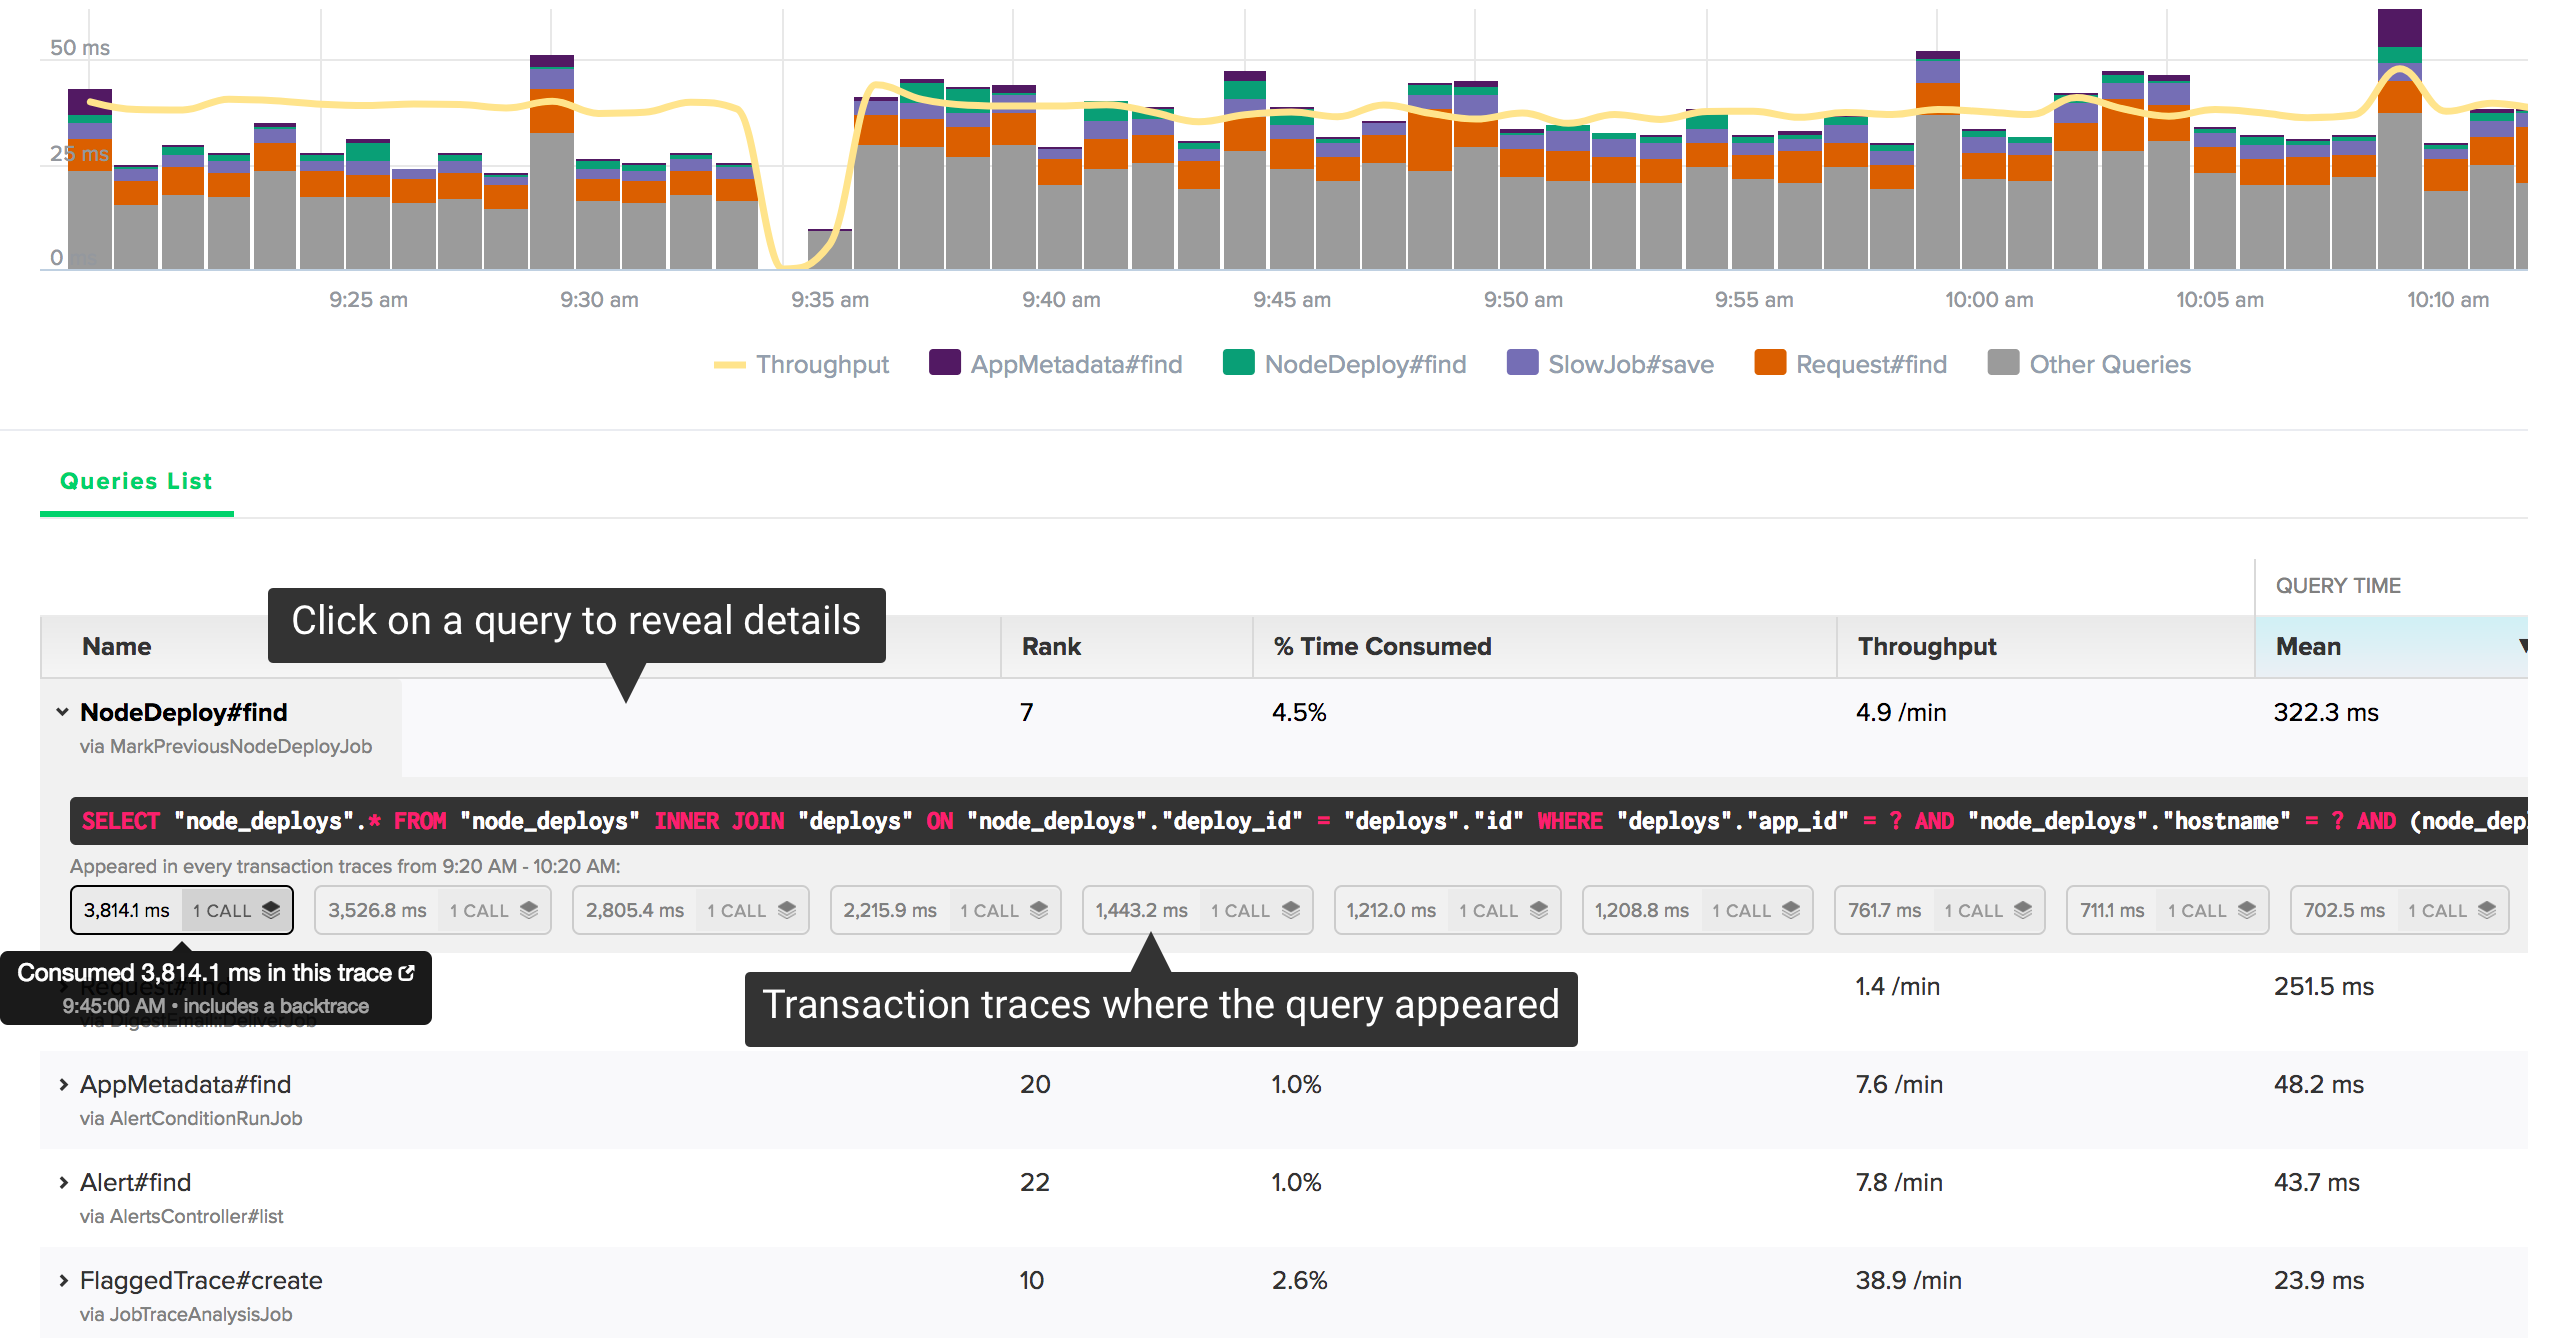
You’ll see the raw SQL and a list of individual query execution times that appeared in transaction traces. Scout collects backtraces on queries consuming more than 500 ms. If we’ve collected a backtrace for the query, you’ll see an icon next to the timing information. Click on one of the traces to reveal that trace in a new window:
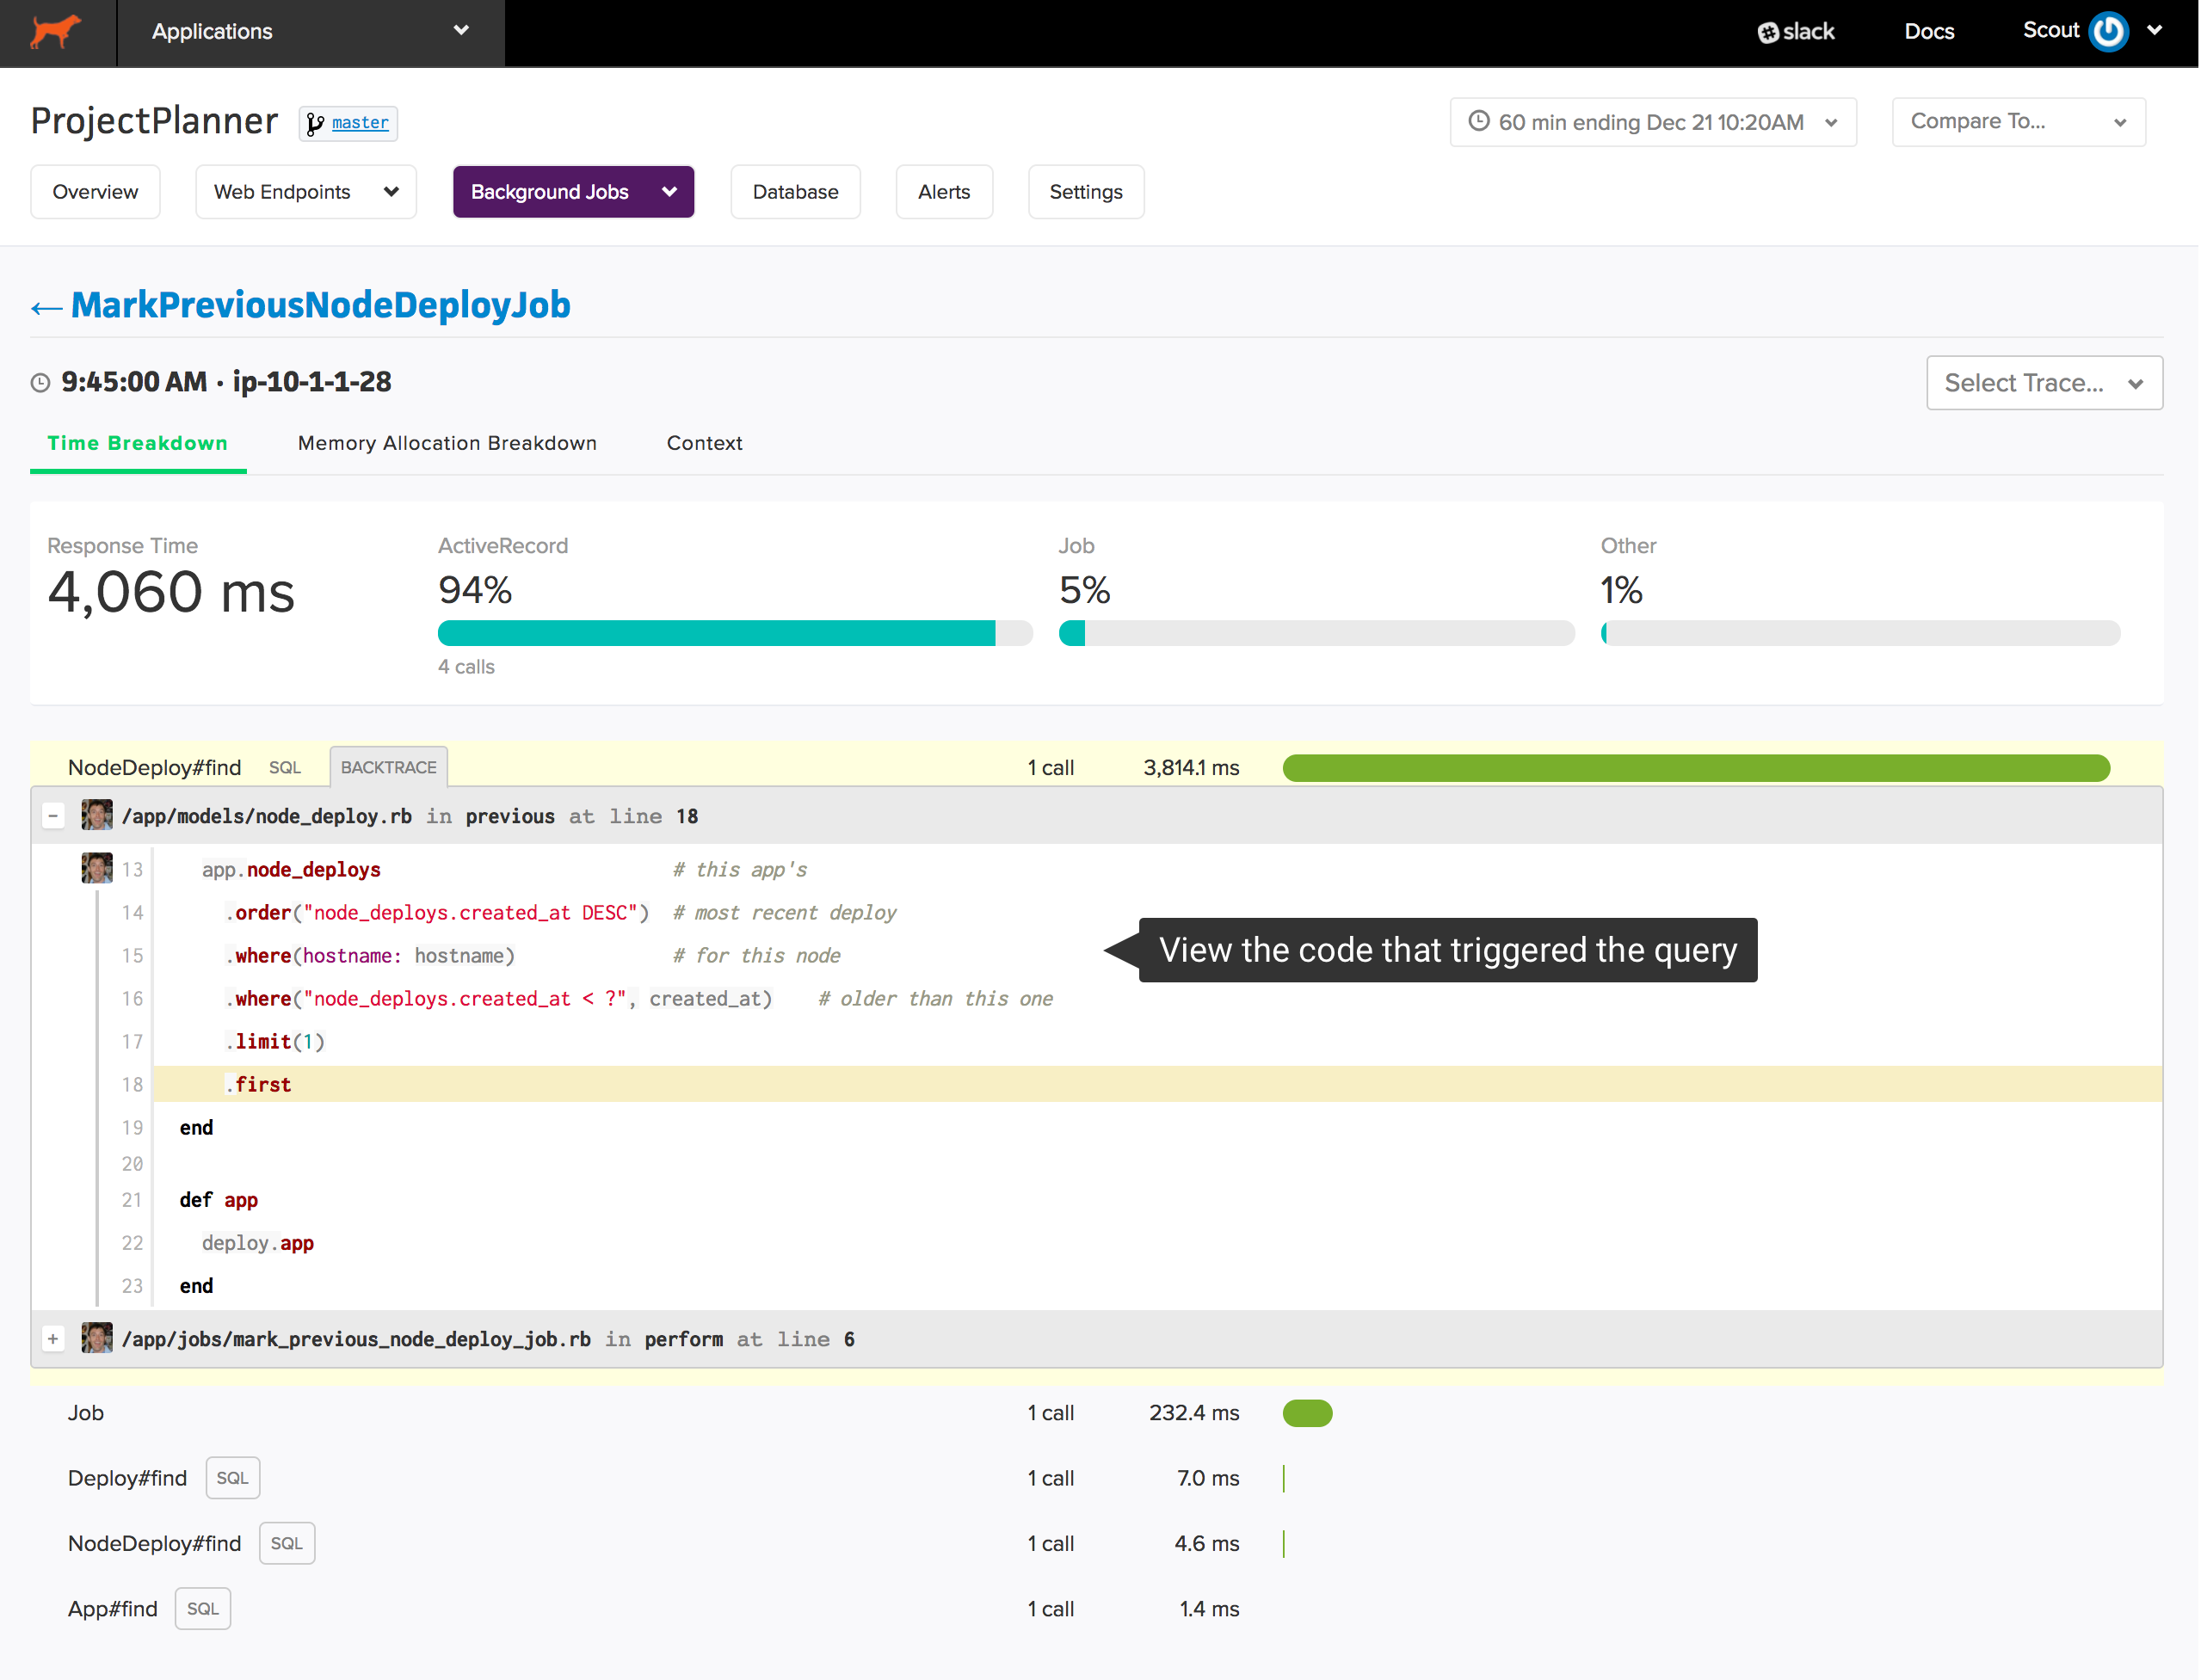
The source of that trace is immediately displayed.
Slow Query Insights
When the database monitoring feature is enabled (with the pro plan), a new “Slow Query” insight is activated on your app dashboard:
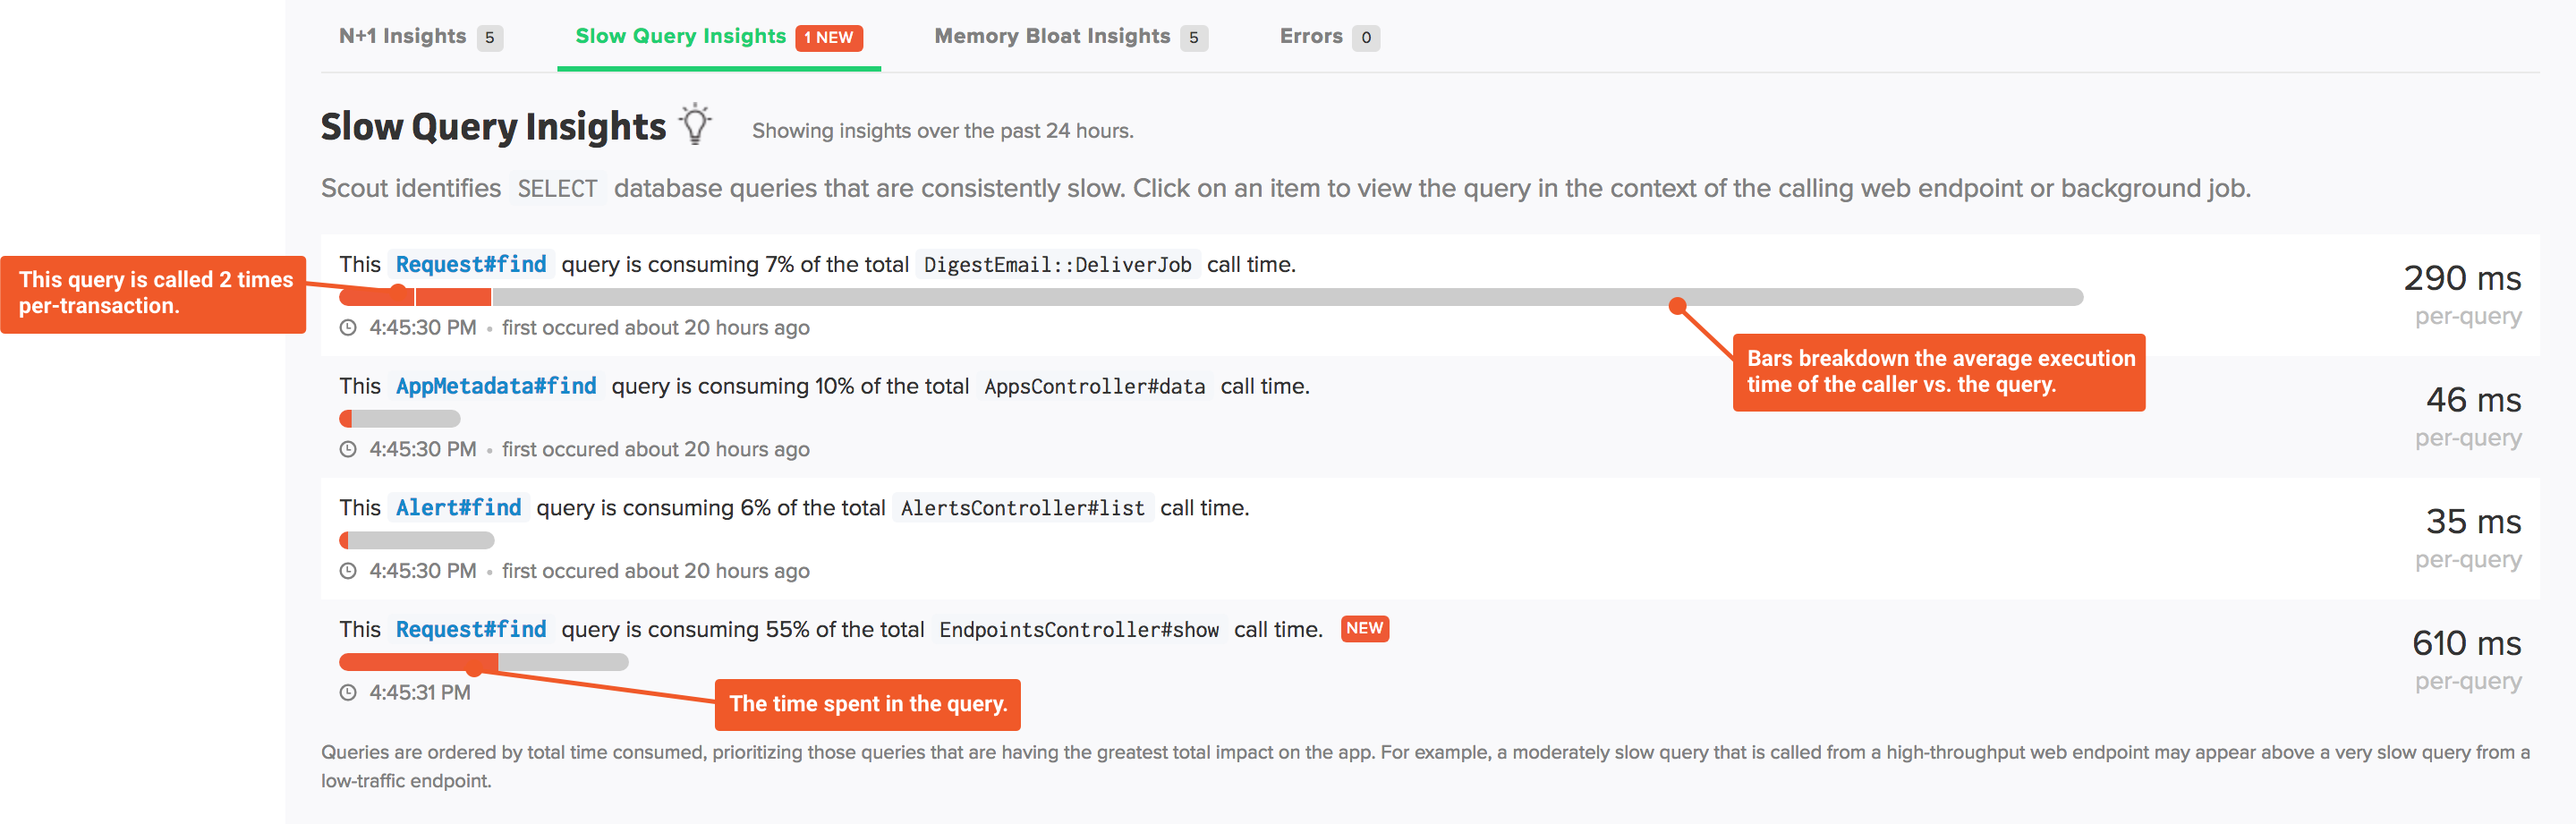
This insight analyzes your queries in three dimensions, helping you focus on database optimizations that will most improve your app:
- Which queries are most impacting app performance? This is based on the total time consumed of each query, where time consumed is the average query latency multiplied by the query throughput.
- Which queries are significant bottlenecks inside web endpoints and background jobs? A single query that is responsible for a large percentage of the time spent in a transaction is a great place to investigate for a performance win.
- Which queries are consistently slow? These are queries that have a high average latency.
Pricing
For direct users, Database Monitoring is available as pro plan feature. For Heroku users, it’s available as an addon. See your billing page for pricing information.
Database Monitoring Installation
Update - or install - the scout_apm gem in your application. There’s no special libraries to install on your database servers.
Database Monitoring Library Support
Scout currently monitors queries executed via ActiveRecord, which includes most relational databases (PostgreSQL, MySQL, etc).
What does SQL#other mean?
Some queries may be identified by a generic SQL#other label. This indicates our agent was unable to generate a friendly label from the raw SQL query. Ensure you are running version 2.3.3 of the scout_apm gem or higher as this release includes more advanced query labeling logic.
External Services
Gain deeper visibility to further drill down metrics and the time spent in your API calls with our External Services Dashboard.
Digest Email
At a frequency of your choice (daily or weekly), Scout crunches the numbers on your app’s performance (both web endpoints and background jobs). Performance is compared to the previous week, and highlights are mentioned in the email.
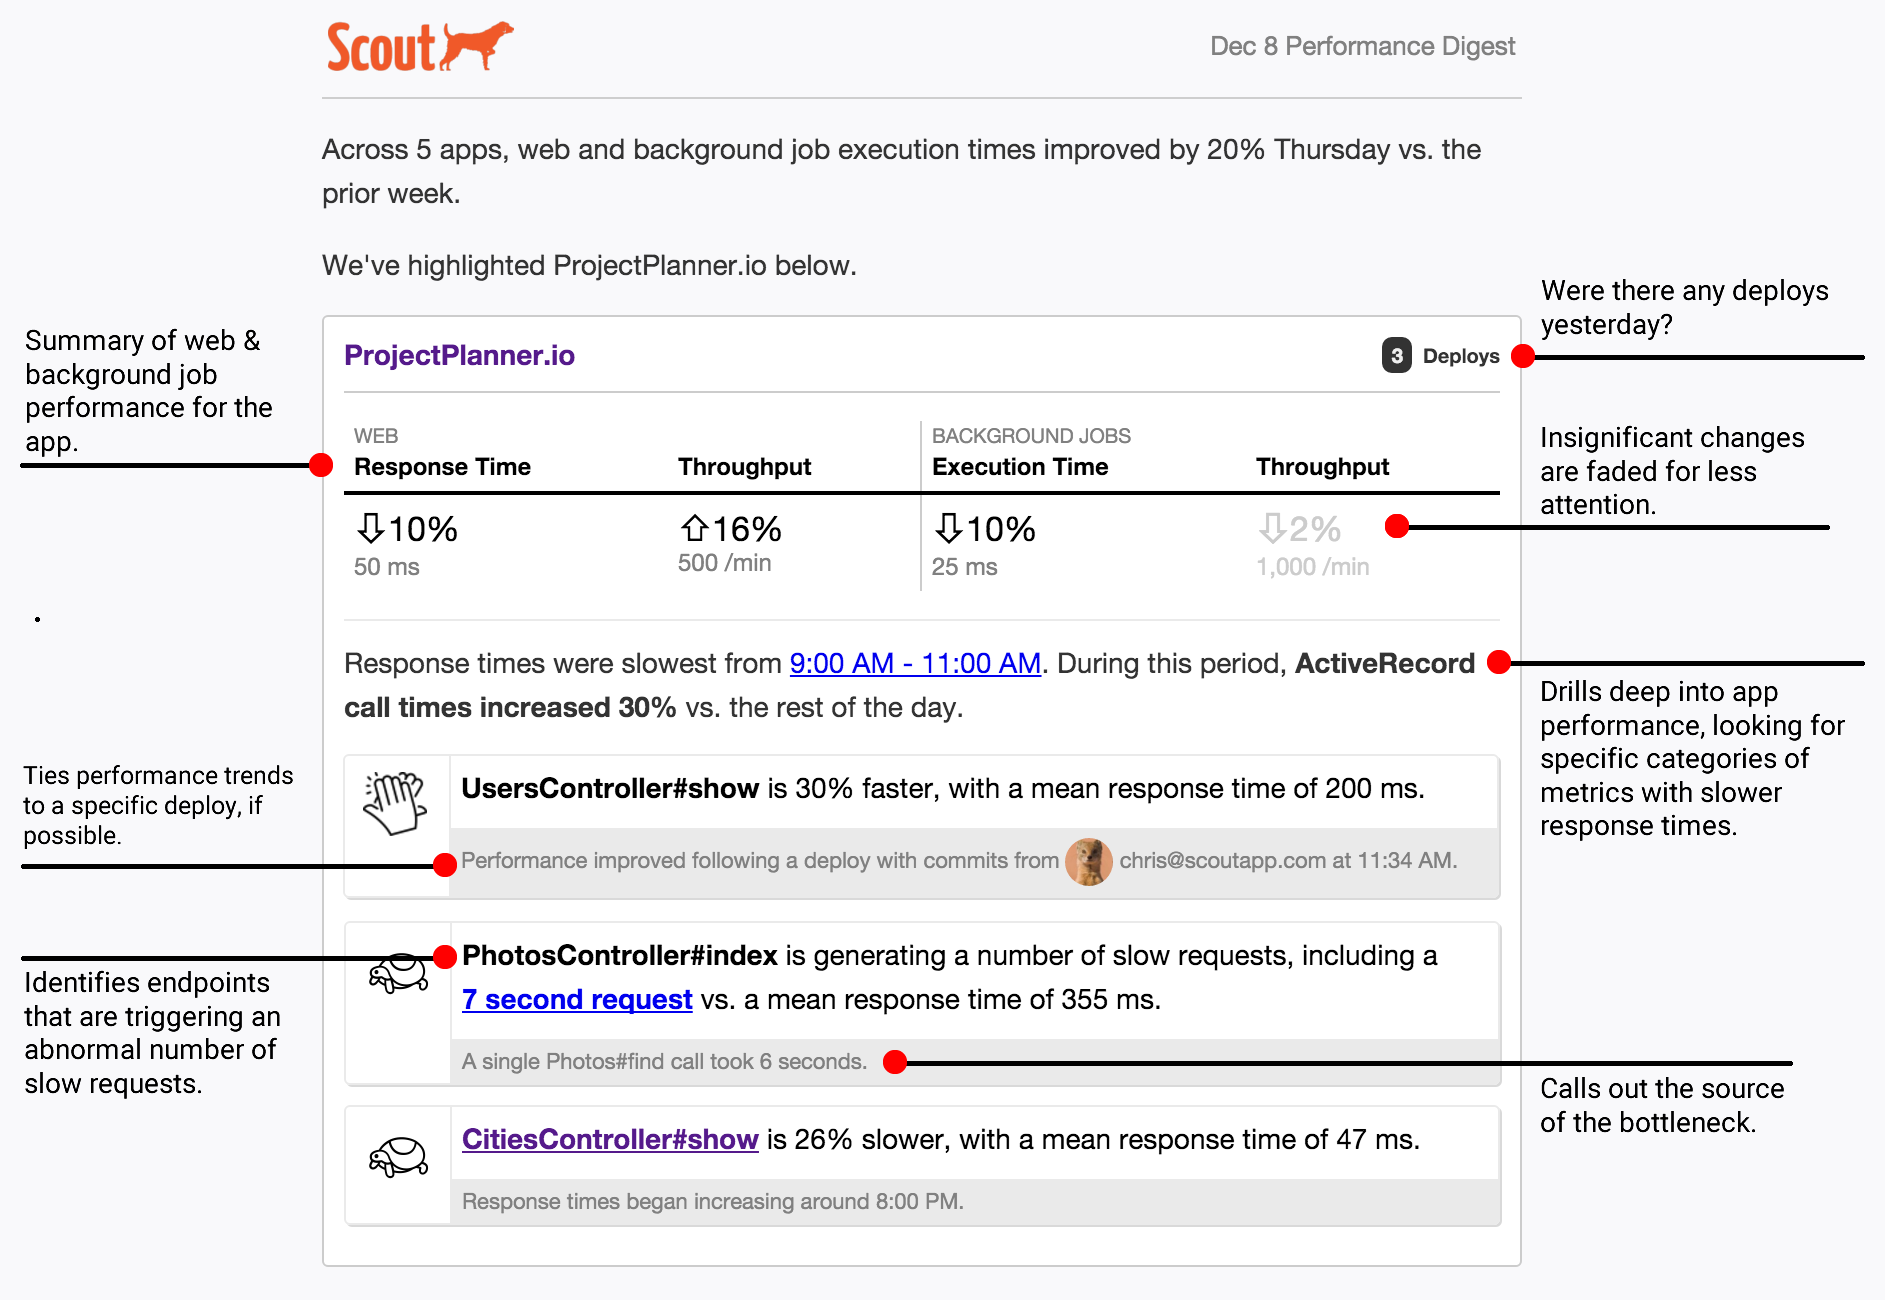
The email identifies performance trends, slow outliers, and attempts to narrow down issues to a specific cause (like slow HTTP requests to another service).
Insights Email
Similar to the digest email, choose a frequency of your choice (daily or weekly), and Scout aggregates the newest insights (N+1, Slow Query, and Memory Bloat) across all your applications.
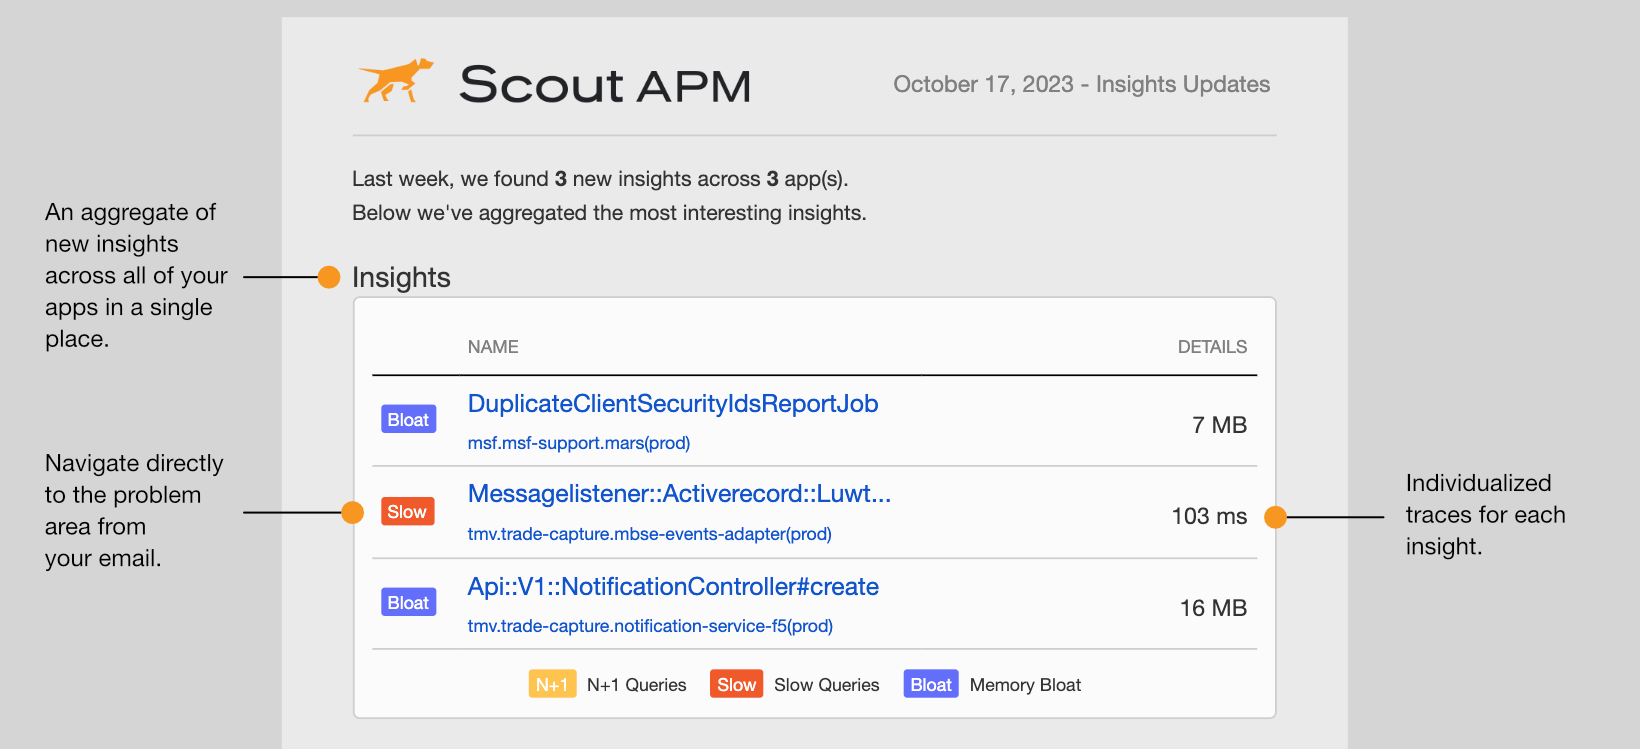
Additionally, we also will aggregate up to 5 of the slowest web request and background job traces across all of your applications.
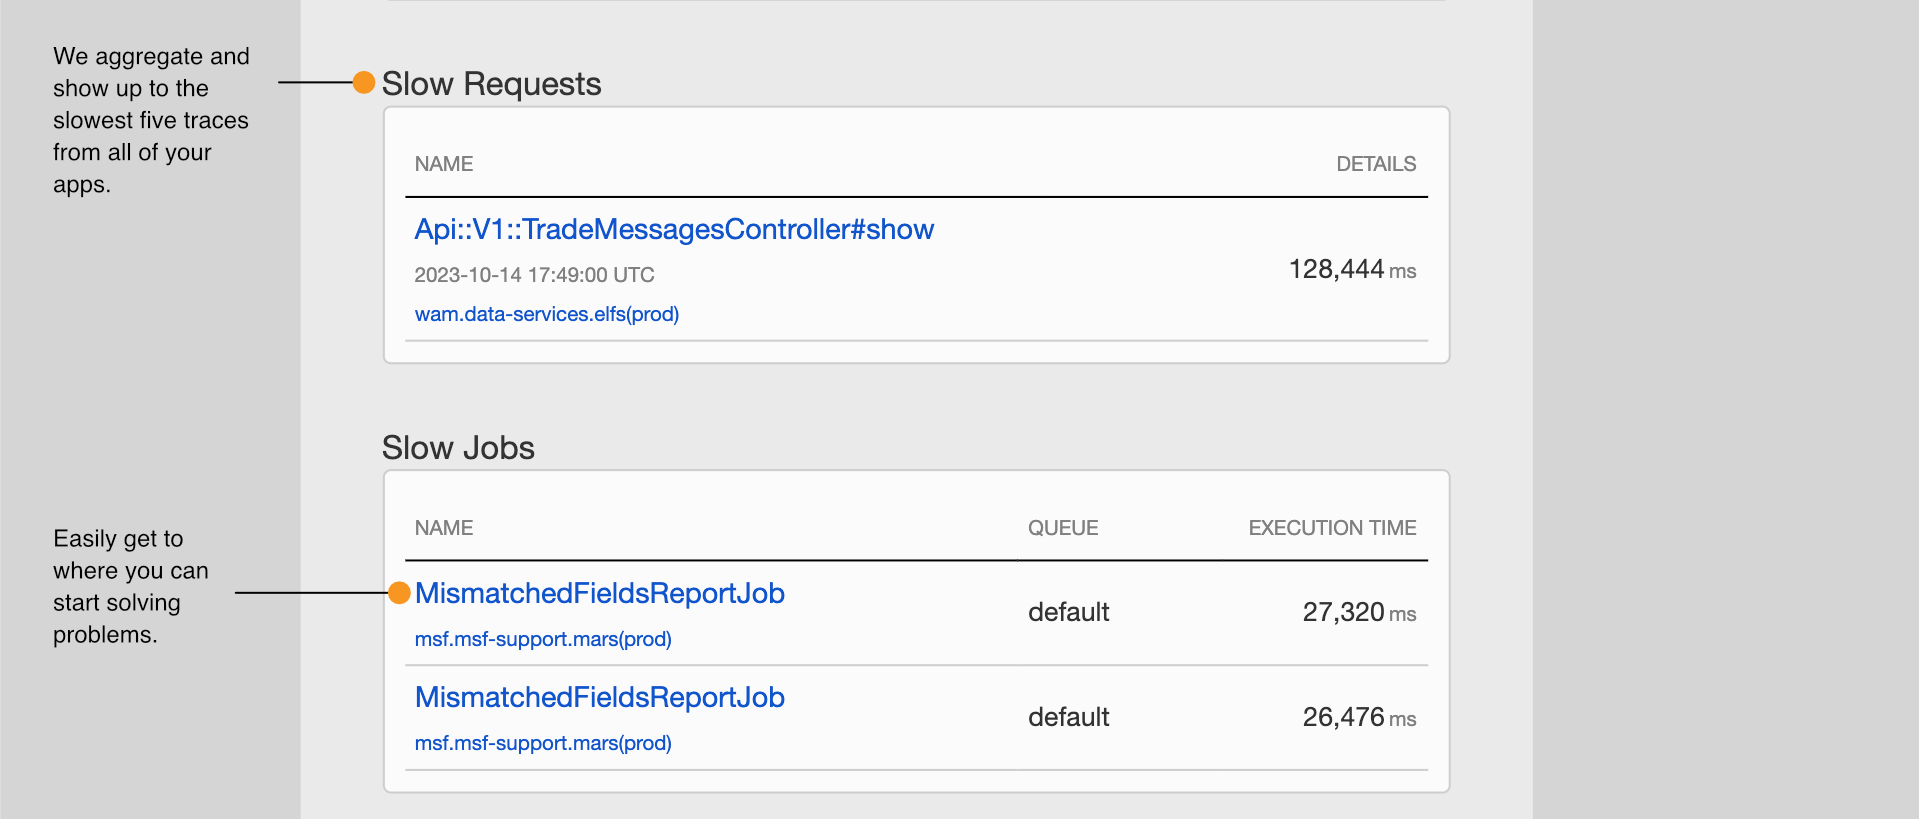
Chart Embeds
You can embed an app’s overview chart inside another web page (ex: an internal key metrics dashboard):
- Access the application dashboard within the Scout UI.
- Adjust the timeframe and metrics to those you’d like to include in the embedded chart.
- Click the embed icon and copy the relevant code.
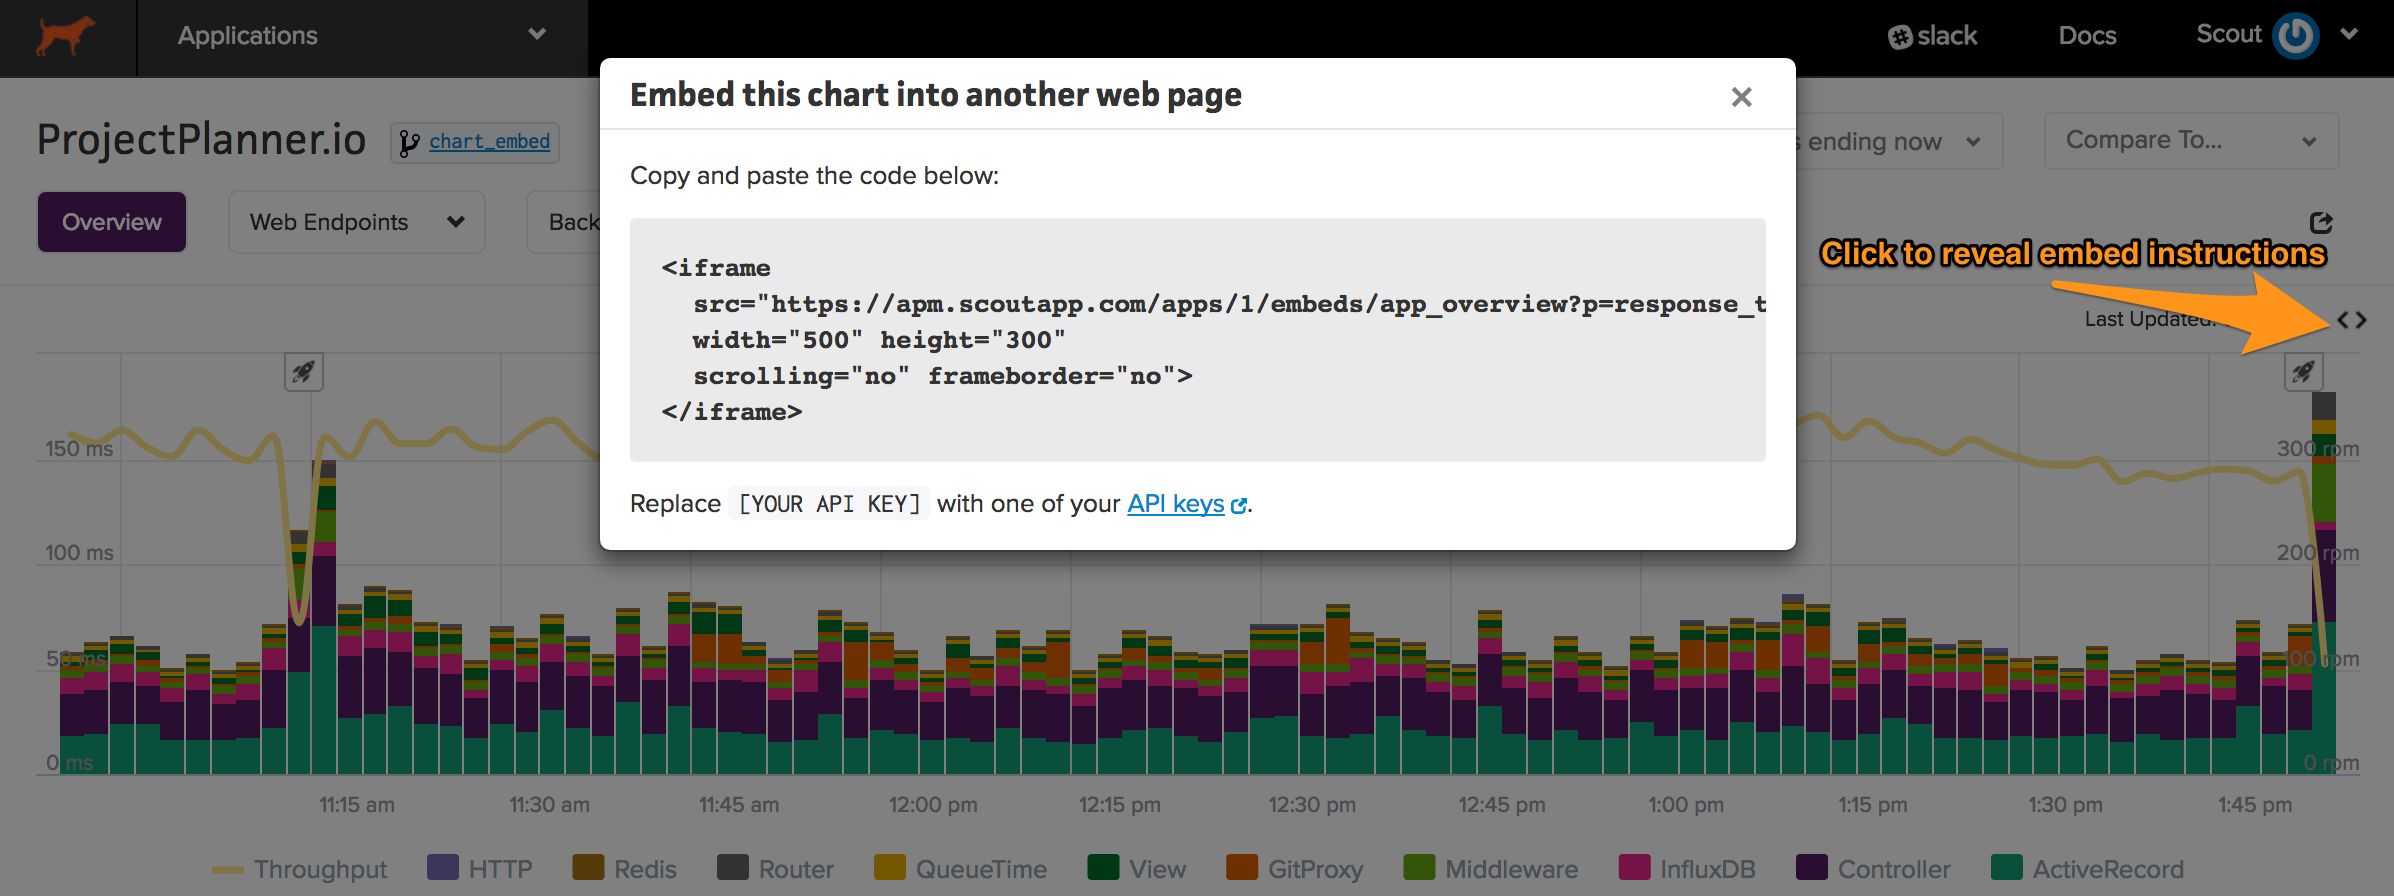
Note that you’ll need to update the provided iframe url with a Scout API key.
When clicking on an embedded chart, you’ll be redirected to the relevant application.
ARM and graviton support
We now have support for ARM and graviton.
- Our Python agent automatically detects ARM support
- To explicitly connect, the core_agent_triple configuration setting must be specified.
- For Elixir, PHP, and Node, the
code_agent_tripleconfiguration setting must be explicitly specified.