Anomaly Detection
Anomaly Detection watches your selected endpoints and background jobs and tells you when they start behaving unusually — even if you never set a threshold. Instead of asking “is response time above 500ms?" it asks “is response time meaningfully different from the last 24 hours, accounting for this same time last week?"
Use it alongside traditional alerting for endpoints where you don’t know what “normal” looks like, or where what’s normal changes over time.
How it works
Anomaly Detection is opt-in per endpoint and per background job, with a per-organization cap so you can apply it where it matters most.
For each monitored endpoint or job, Scout looks at the average and 95th percentile response times.
Every minute, Scout compares the latest value against recent behavior for the same endpoint. Because what counts as “unusual” depends on the endpoint — a steady 100ms API route and a jittery search endpoint have very different normal swings — Scout measures each deviation relative to the endpoint’s own typical variability, not against a fixed threshold.
A single sensitivity setting controls how big a deviation has to be before Scout flags it. Higher sensitivity catches smaller deviations but produces more events; lower sensitivity catches only large, obvious spikes. A live preview on the endpoint chart shows exactly which past events each sensitivity level would have caught, so tuning isn’t guesswork. Two optional advanced settings — a minimum duration and a direction filter — let you narrow detection further for specific endpoints.
Seasonality
Most apps have natural performance rhythms — a checkout endpoint that’s busier every weekday at 9am, a reporting job that runs heavy every night at midnight. Scout tries to account for these recurring patterns so you don’t get paged every time a known busy period kicks in.
When Scout sees a spike in the current minute, it cross-checks against two seasonal windows for the same endpoint:
- Same time, 24 hours ago — catches daily patterns (nightly cron jobs, end-of-day batch processing, daily traffic peaks).
- Same time, one week ago — catches weekly patterns (Monday morning traffic, weekend lulls, weekly billing runs).
If either window shows that the current value would have looked normal at that point in the past, the spike is treated as part of the endpoint’s usual rhythm and suppressed. Only deviations that are unusual for this time of day and this day of the week are flagged as anomalies.
This is automatic — there’s nothing to configure. New endpoints with less than a week of history will get a bit more noise during their first week as the seasonal model warms up; after that, recurring patterns are handled silently.
Enabling anomaly detection
You enable monitoring per endpoint or per background job from the Monitoring dropdown on its detail page.
- Navigate to an endpoint or background worker
- Click the Monitoring dropdown at the top of the page
- Toggle Anomaly Detection on
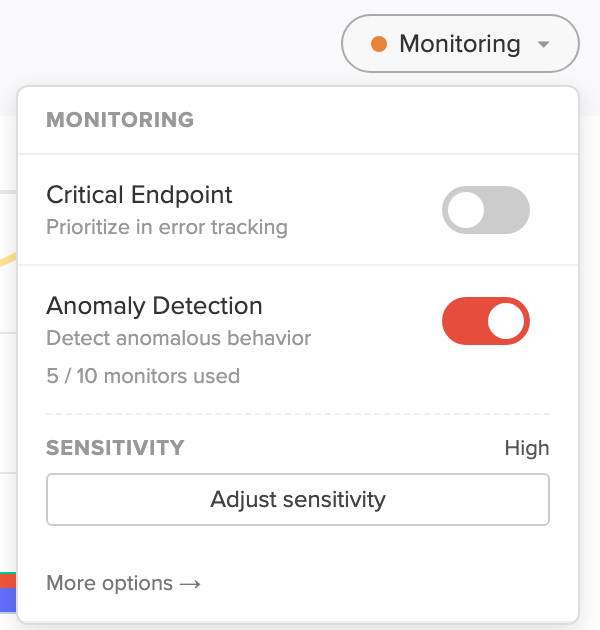
Paid organizations can monitor up to 10 endpoints and jobs by default; free-tier organizations default to 1. The dropdown shows how many monitors you’ve used; if you need more, contact us and we’ll raise it for you.
When you enable monitoring, Scout immediately analyzes the past week of the endpoint’s history (you’ll see an “Analyzing recent history…" indicator while this runs). Any anomalies found in that week appear on the chart right away as retrospective events, so you can see what the monitor would have caught — and tune its sensitivity — without waiting for the next incident. These events do not appear in insights history; they’re intended mainly for tuning sensitivity.
Going forward, Scout scans the endpoint every minute. Live detection needs roughly 30 minutes of traffic to establish a stable baseline before it flags new anomalies.
Disabling
Toggle Anomaly Detection off from the same dropdown, or remove it from the organization-wide settings page (see Configuring sensitivity). Disabling stops new detection and hides the monitor’s chart markers; past anomaly events remain in your insights history.
Where to see anomalies
Once enabled, anomalies show up in several places:
Insights tab — An Anomalies pill appears in the insights area of your app overview. Each item shows the metric, the endpoint or job, how far the value drifted from baseline (e.g. “3.5× above normal”), and how long it lasted. Click through to the relevant endpoint with the time picker preset to the anomaly’s window.
Overview chart — On your app’s Overview page, a toggle above the main chart (alongside the alert and deploy marker toggles) overlays anomaly markers from all of your monitored endpoints and jobs on one chart.
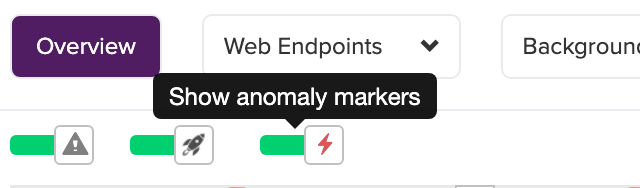
Chart markers — On the endpoint or worker detail page, the same toggle shows anomalies as shaded bands on the performance chart. Red bands indicate values above baseline; blue bands indicate values below baseline. Hover any band for the underlying values. Anomalies found by the initial history analysis appear in a hatched, muted style and are labeled “Detected retrospectively” to distinguish them from events caught live.
Insights History — Past anomalies appear in the insights history view (alongside N+1, memory bloat, and slow query insights), so you can scan recent performance issues at a glance.
Notifications — Sent through your existing notification channels when a new anomaly opens (see Receiving notifications).
Configuring sensitivity
Sensitivity controls how aggressive detection is. You can configure it at two levels:
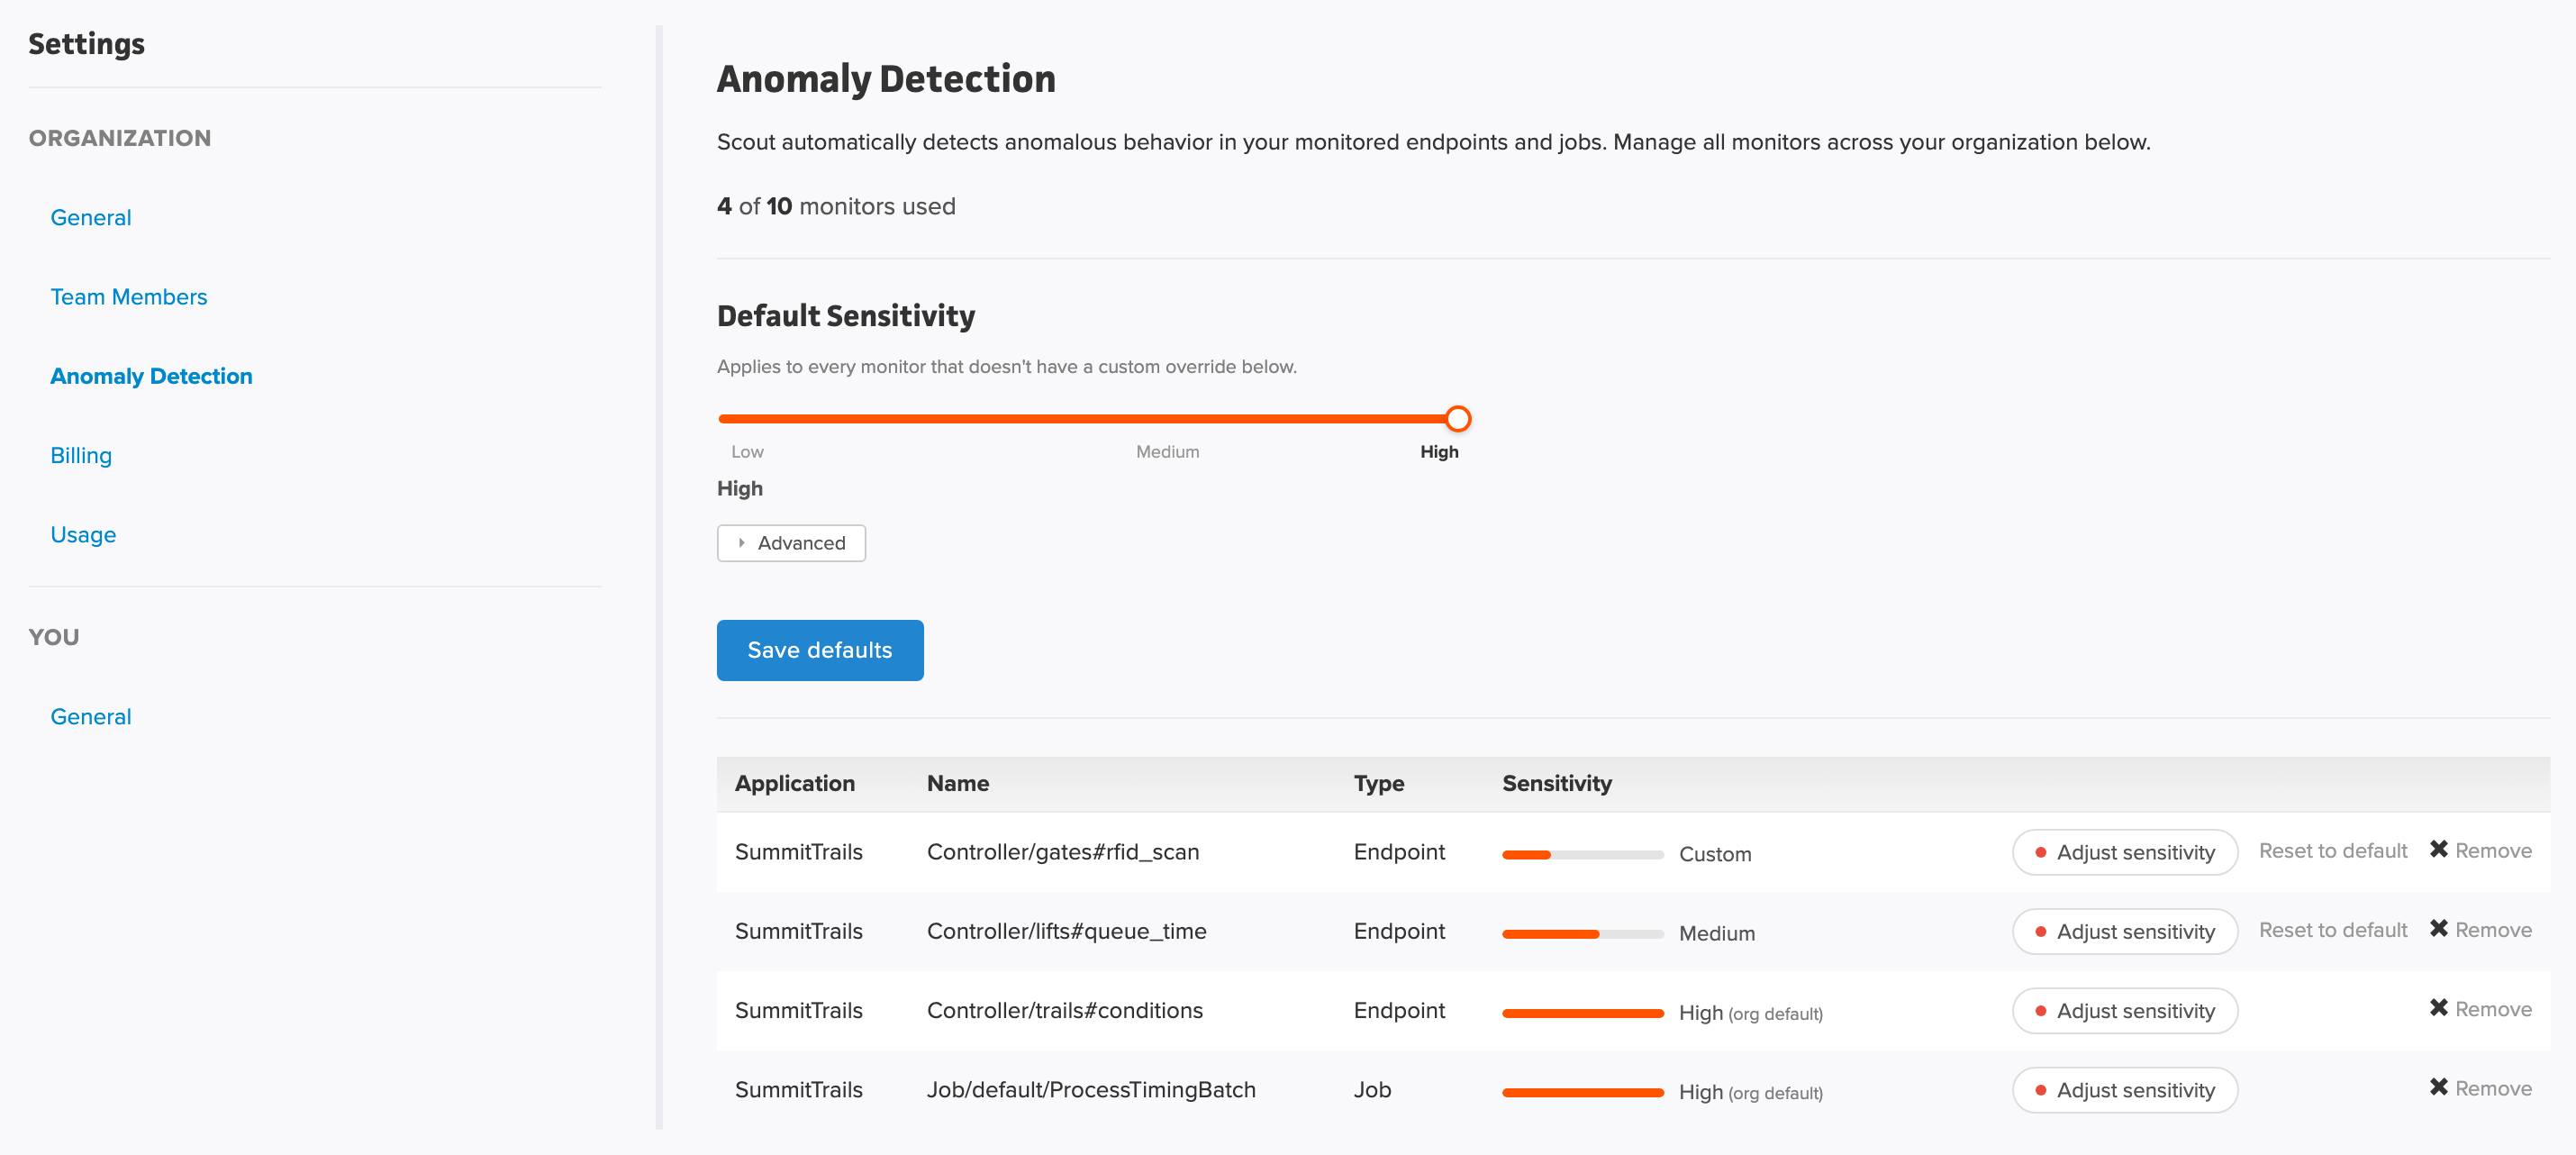
Organization default — Sets the sensitivity for all monitors that don’t have a per-monitor override. Configure under Settings → Anomaly Detection. This page also lists every monitor across your organization with its current sensitivity, and lets you jump to a monitor’s live preview, reset it to the organization default, or remove it.
Per-monitor override — On any monitored endpoint or background job, the Monitoring dropdown shows the monitor’s current sensitivity and an Adjust sensitivity button. Adjustments made here override the org default for that monitor only — useful when one endpoint is noisier or quieter than your typical traffic.
Adjusting sensitivity with the live preview
Clicking Adjust sensitivity opens a slider above the performance chart. Before you start, set the chart’s time range to at least a day. At that scale individual spikes stay visible, so it’s easy to match the jumps in the chart to the anomaly markers. You can widen to 3 or 7 days to cover the whole backfilled week, but spikes flatten out as the window grows.
The slider runs continuously from Low to High sensitivity, with three labeled presets along the way:
| Preset | Behavior |
|---|---|
| High | Most sensitive. Catches smaller deviations, but expect more events on variable endpoints. |
| Medium | Balanced. Catches clear spikes without flagging routine variation. |
| Low | Least sensitive. Only flags large, dramatic deviations. Best for noisy endpoints where smaller bumps aren’t actionable. |

As you drag the slider, the anomaly markers on the chart filter live: only events big enough to fire at the candidate level stay visible, and a readout shows how many anomalies that level would have produced over the visible window. Because enabling a monitor backfills a week of history, the preview is meaningful even on a brand-new monitor.
Nothing is saved until you click Apply; Cancel (or closing the dropdown) reverts the slider and the chart. You can stop on a preset or anywhere in between — in-between values are saved as Custom.
Two things to know about the preview:
- The preview shows what would have been detected in the past. Going forward, Scout only records events at your applied sensitivity — so apply the level you actually want before walking away.
- Lowering sensitivity hides smaller historical events rather than deleting them; raising it again reveals them.
Advanced settings: minimum duration and direction
Below the slider, Advanced expands two optional controls. Both override the organization default for this monitor only and are saved with the sensitivity when you click Apply. When collapsed, the button summarizes any non-default values (e.g. “Advanced · 5 min · spikes only”).
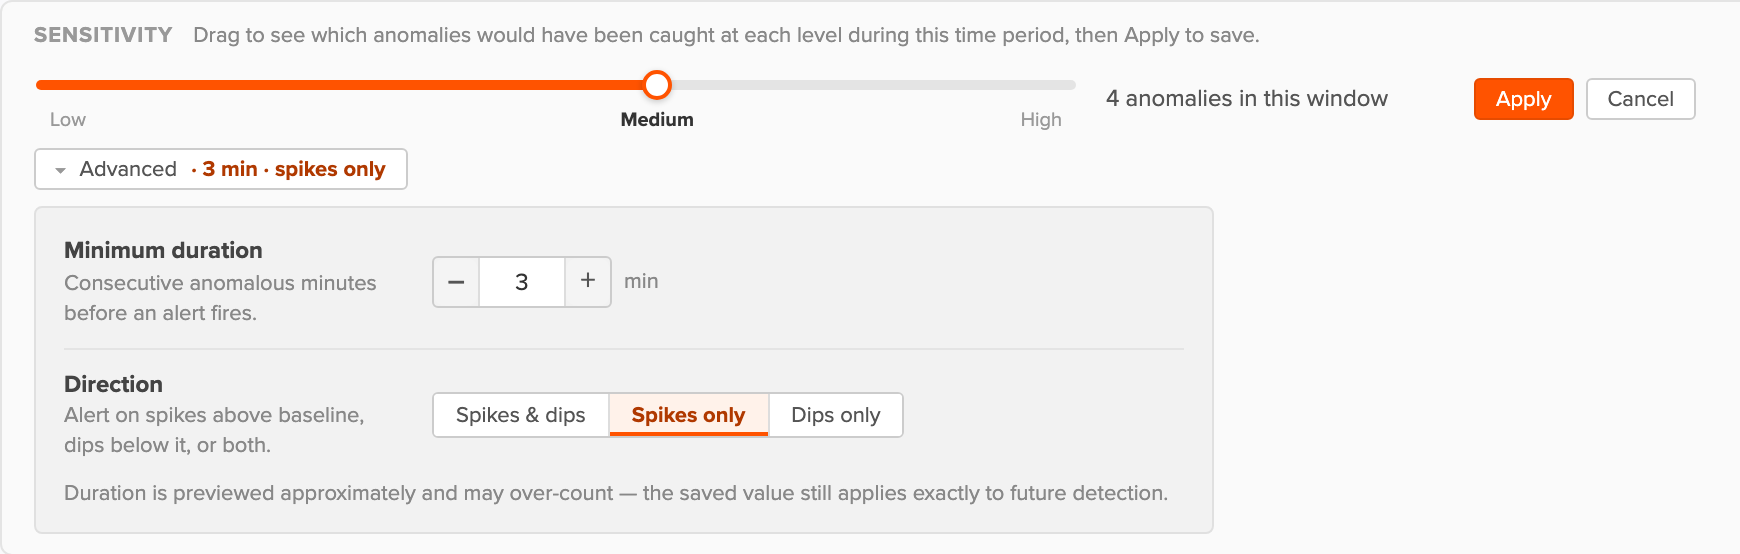
Minimum duration — How many consecutive anomalous minutes (1–60) Scout waits before opening an event and notifying you. The default of 1 fires on the first anomalous minute; raising it filters out brief, self-correcting blips at the cost of a slightly later event. The preview filters the markers and count by duration too, but only approximately — it tends to over-count, and a note in the panel says so whenever the duration is above 1. The saved value applies exactly to future detection.
Direction — Which side of the baseline counts as an anomaly: Spikes & dips (default), Spikes only (above baseline — the usual choice for response time, where a sudden speedup isn’t worth investigating), or Dips only (below baseline — useful when an endpoint getting suspiciously fast is the signal, for example because it started failing early). The preview filters by direction as well.
Both have organization-wide defaults under Settings → Anomaly Detection → Advanced.
Receiving notifications
Anomaly notifications use the same notification groups and channels that power Scout’s alerting — Slack, PagerDuty, Opsgenie, email, webhooks, and the rest. If you already have a notification group set up for alerts, you can reuse it for anomalies.
Pick the group under Settings → Anomaly Detection → Notifications. All monitors in the organization send through this group. If it’s left as None, anomalies are detected silently — visible in the dashboard, but no notifications. If no group is set, the Monitoring dropdown on each monitored endpoint shows a Set up notifications link that takes you to this page.
Notifications fire once, when a new anomaly opens live. Scout doesn’t re-notify while an anomaly stays active, doesn’t currently send a “resolved” notification when it closes, and never notifies for retrospective events found by the initial history analysis or shown in the sensitivity preview.
What monitors best
Any endpoint or job you care about is worth monitoring. A few traffic shapes play to the detector’s strengths:
Throughput — Endpoints with at least 1 request per minute sustained will get a clean baseline. Below ~10 requests per hour, the trailing window is too sparse for the detector to flag anything meaningful, and you’ll get silence rather than useful signal. Very low-traffic endpoints are better handled by traditional alerting on absolute thresholds.
Consistency — Endpoints whose normal performance is reasonably stable produce the best signal. Endpoints with wild minute-to-minute swings (e.g. a search endpoint where some queries take 50ms and others 5s) will mostly look “always anomalous” to a statistical detector. Use response time alerting instead.
Latency matters — Anomaly detection currently covers response time and 95th percentile response time for endpoints, and response time for background jobs. It does not currently cover throughput or error rate. For throughput dips or error spikes, use traditional alerting.
Speed floor — Scout suppresses spikes that stay below user-perceptible latency, so very fast endpoints won’t generate events for tiny absolute changes (a 50ms → 90ms blip isn’t flagged even though it nearly doubled). If an endpoint averages well under ~200ms and you care about small absolute regressions, a threshold alert is the better tool.
You can add or remove monitors at any time.
Anomaly lifecycle
Open — When Scout detects the first anomalous data point that survives the seasonal check (and, if you’ve set one, the minimum duration), it opens an anomaly event and, if a notification group is configured, sends a notification.
Active — While the anomaly persists, the event stays “active” in your dashboard. The event records its peak — the worst minute seen so far — so tooltips and insights describe the spike at its most severe, not just its latest value. No further notifications are sent during this period.
Closed — When the metric returns to its normal range for 3 consecutive minutes, the event closes. If the endpoint goes silent for 10+ minutes (no incoming traffic), Scout closes any open events for it automatically.
You can review closed anomalies in the insights history view.
Tips
- You can tune right away. Right after enabling a monitor, open Adjust sensitivity and drag the slider across the backfilled history — pick the level that would have caught the events you care about without flagging noise. You can come back and retune anytime as real events accumulate.
- Pair with alerting. Anomaly detection catches unusual behavior; threshold alerts catch unacceptable behavior. They complement each other.
- Use per-monitor overrides for noisy endpoints. You don’t need to lower your org default to accommodate a single chatty endpoint — override that monitor specifically, or give it a longer minimum duration.