Deploying to AWS Part III: Log aggregation
Looking for a fresh, 2018 approach to deploying a Rails app to AWS? We've partnered with DailyDrip on a series of videos to guide you through the process. We'll be covering how to Dockerize a Rails app, AWS Fargate, logging, monitoring, and CDN support.
In our last video, we deployed our Rails app to AWS ECS with Fargate. In this video, we'll walk through logging. We'll switch to a more useful log output format and learn how to ship Cloudwatch logs to an external log aggregation service (LogDNA in our case).
Recap
In our last video, we didn't spend much time going over how we configured our logging. So, let's take a moment to talk about our current situation.
One of the first steps we took was configuring our task-definition. Part of that process required configuring several container settings and adding a few environment variables. One of those environment variables that we set is RAILS_LOG_TO_STDOUT.
If you haven't seen this environment variable before, it's because it was introduced in Rails 5 and switches a bit of code in config/environments/production.rb to allow the rails logger to send logs to STDOUT instead of the usual log/production.log file.
Here's the actual implementation:
This is useful for us, simply because by default, the AWS Container sends it's STDOUT to CloudWatch, which means we got some basic log aggregation for free.
Getting Started
For our logging, we are going to be specifically addressing two things:
- Formatting the logs from Rails
- Shipping the logs from CloudWatch to LogDNA
Configuring our log format
When it comes to formatting our logs, plain text logs are not the best solution for parsing meaningful information. However, plain text is often easier for the eye to parse, especially when it is in a format that developers have become accustomed to over many years. For that reason, we will leave our development logs in a text format, but we will change our production log formatting to JSON.
In order to change our formatting, we are going to be using the Lograge library. Implementation of the LogRage library is straightforward. Let's start by adding the gems we'll need:
After adding the gems, run bundle and we'll update our config/environments/production.rb to use the new logger format, since we only want our production logs to be formatted differently. We're going to add this block of code at the bottom of our file:
Now, if we run our app, in production mode, we should see the difference in the formatted output. Since, we already have the ability to connect to our RDS instance locally, we can test running it locally before committing our code and pushing up a new image.
It looks like rails is formatting our logs correctly now, so we can commit these changes and push up a new image.
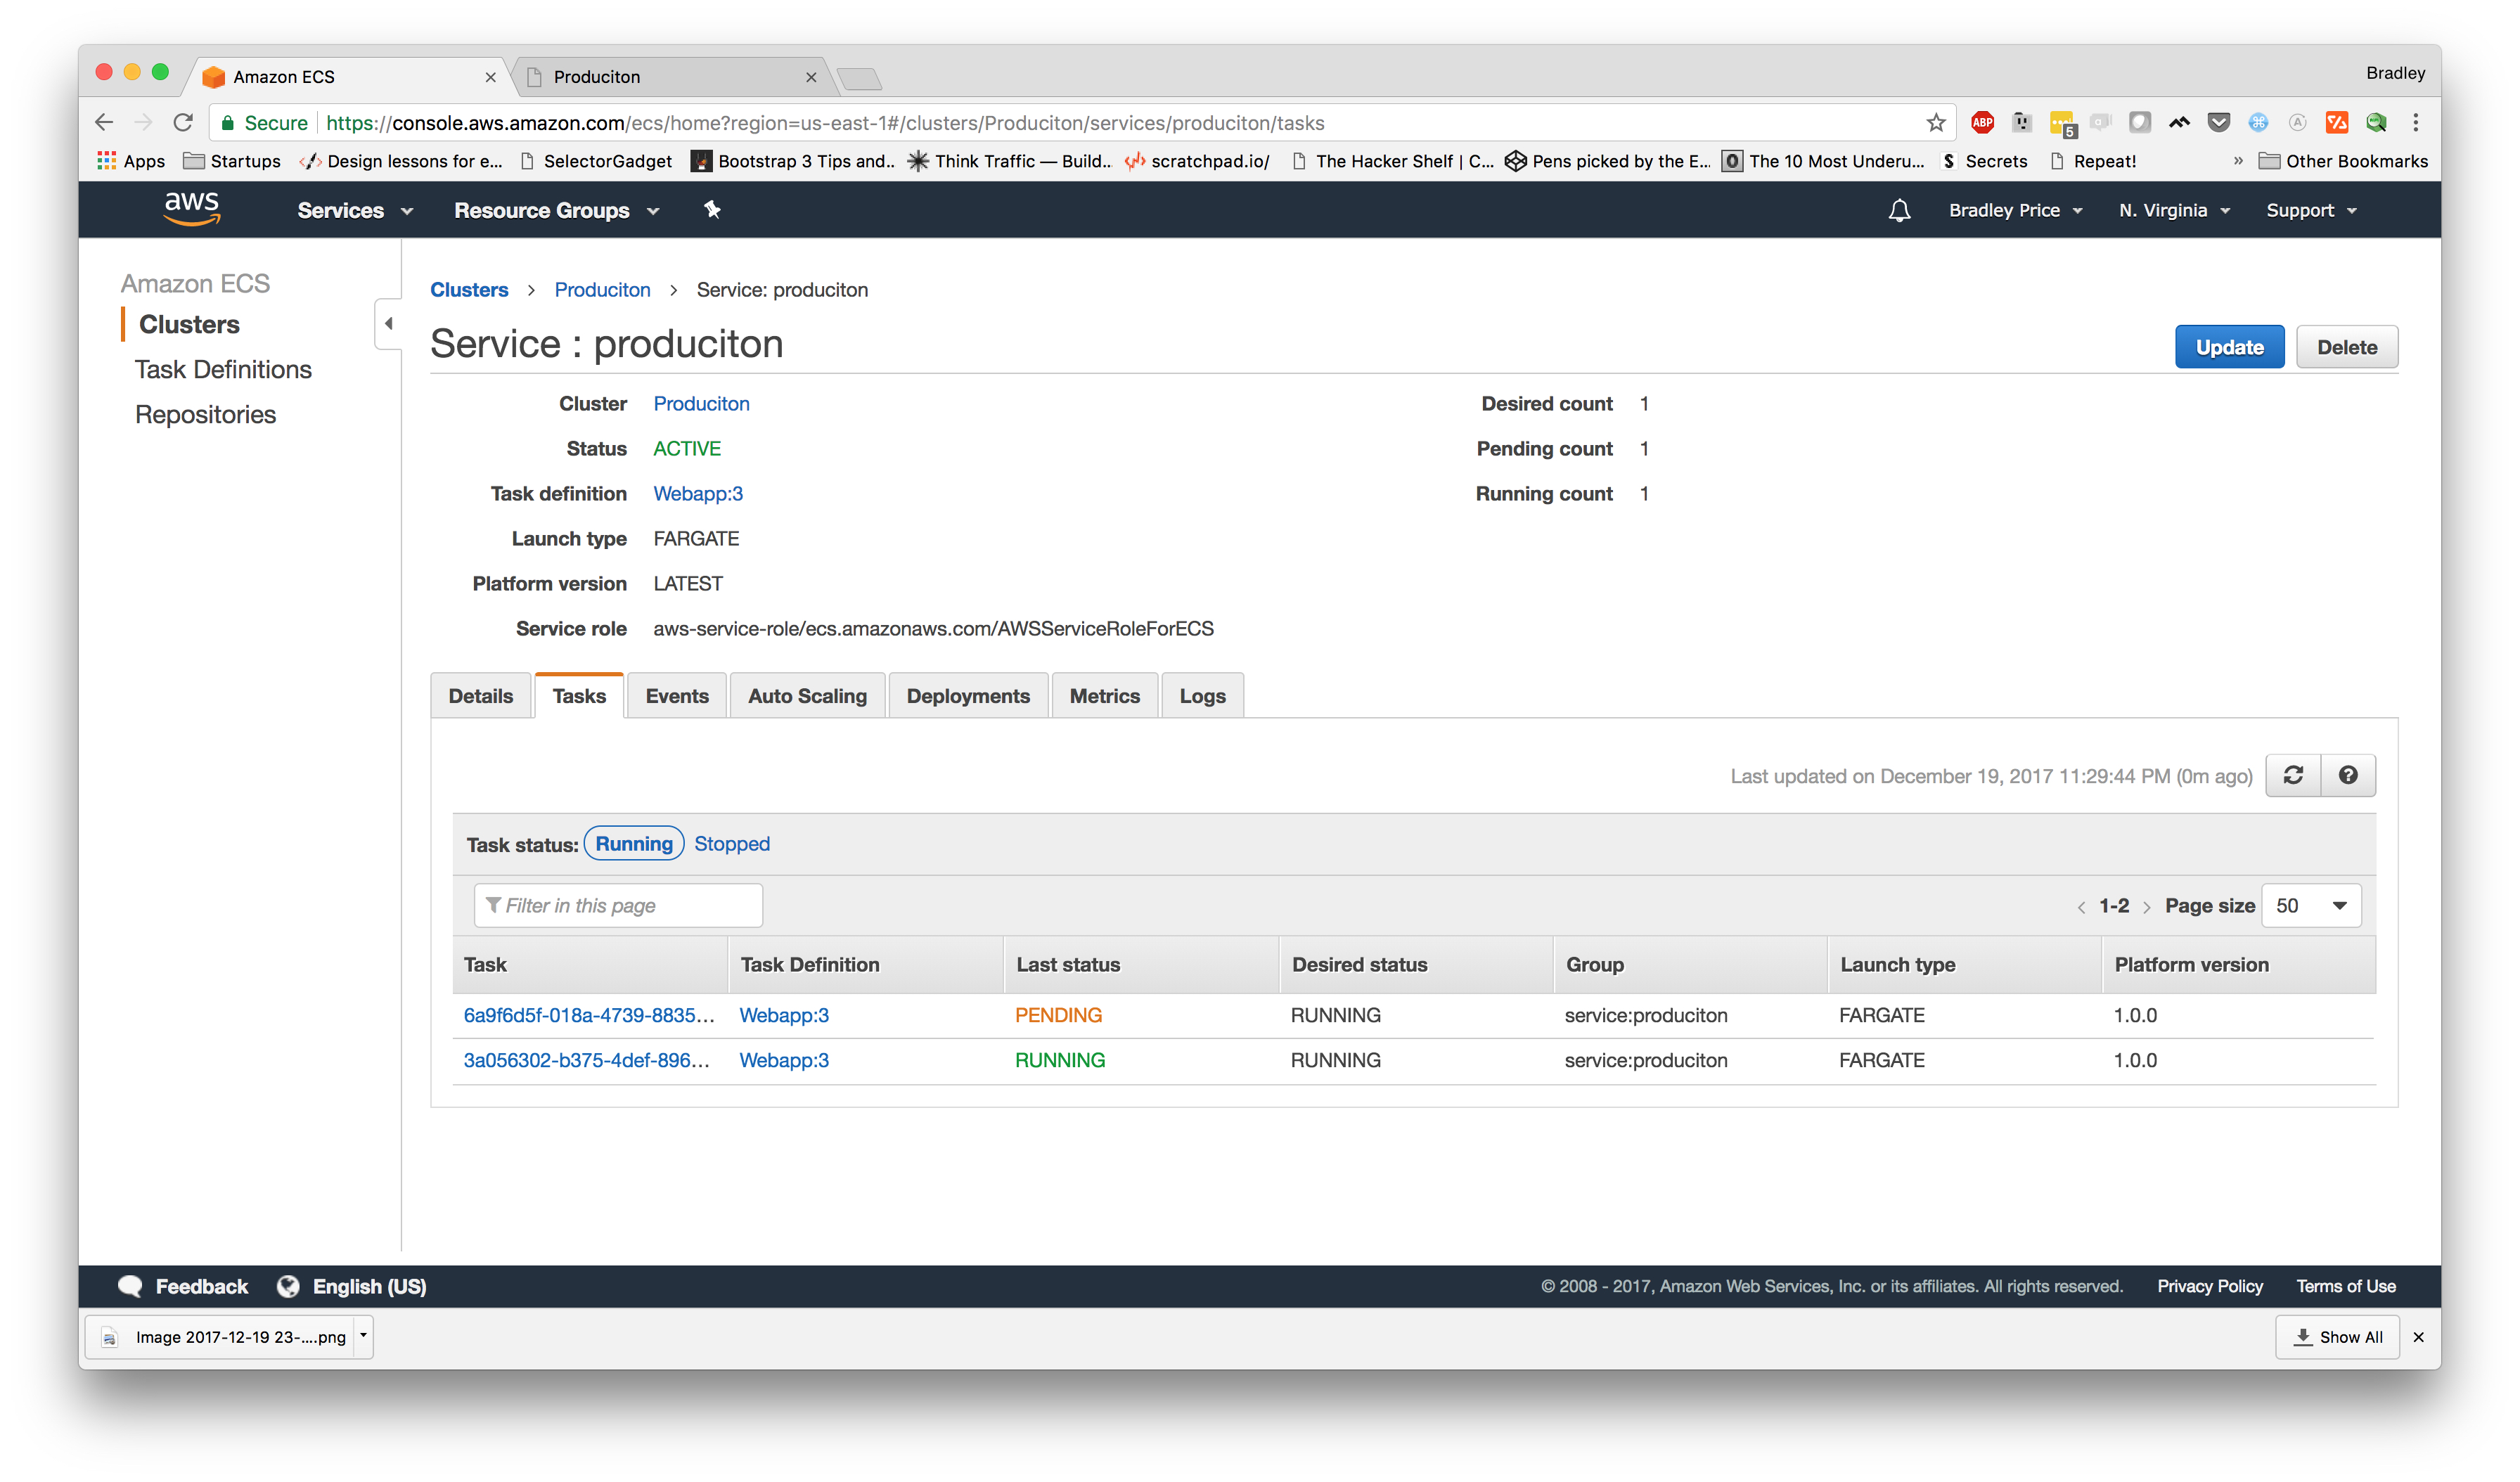
Now, we can go to the AWS console and restart our app. To do this, we will need to navigate to Elastic Container Services and go to the "Clusters" section. Once there, select the "produciton" service and click the "update" button.
This takes us to the "Update Service" page that has 4 steps. The only change we need to make here is to select the "force new deployment" option and click "Next step" through all of the pages until the last page, then we will click "Update Service". This will take us to a page to with the status of the changes. We can click the "View Service" button to get back to our service overview.
Note: There are other ways that we can restart our service both from the AWS console and the command line. I've just chose this method.
Once we are back on our Service overview page, we should see a second task starting up. What is happening here is a new task is being started (with the latest image we pushed) and once running, the older running task will be removed.
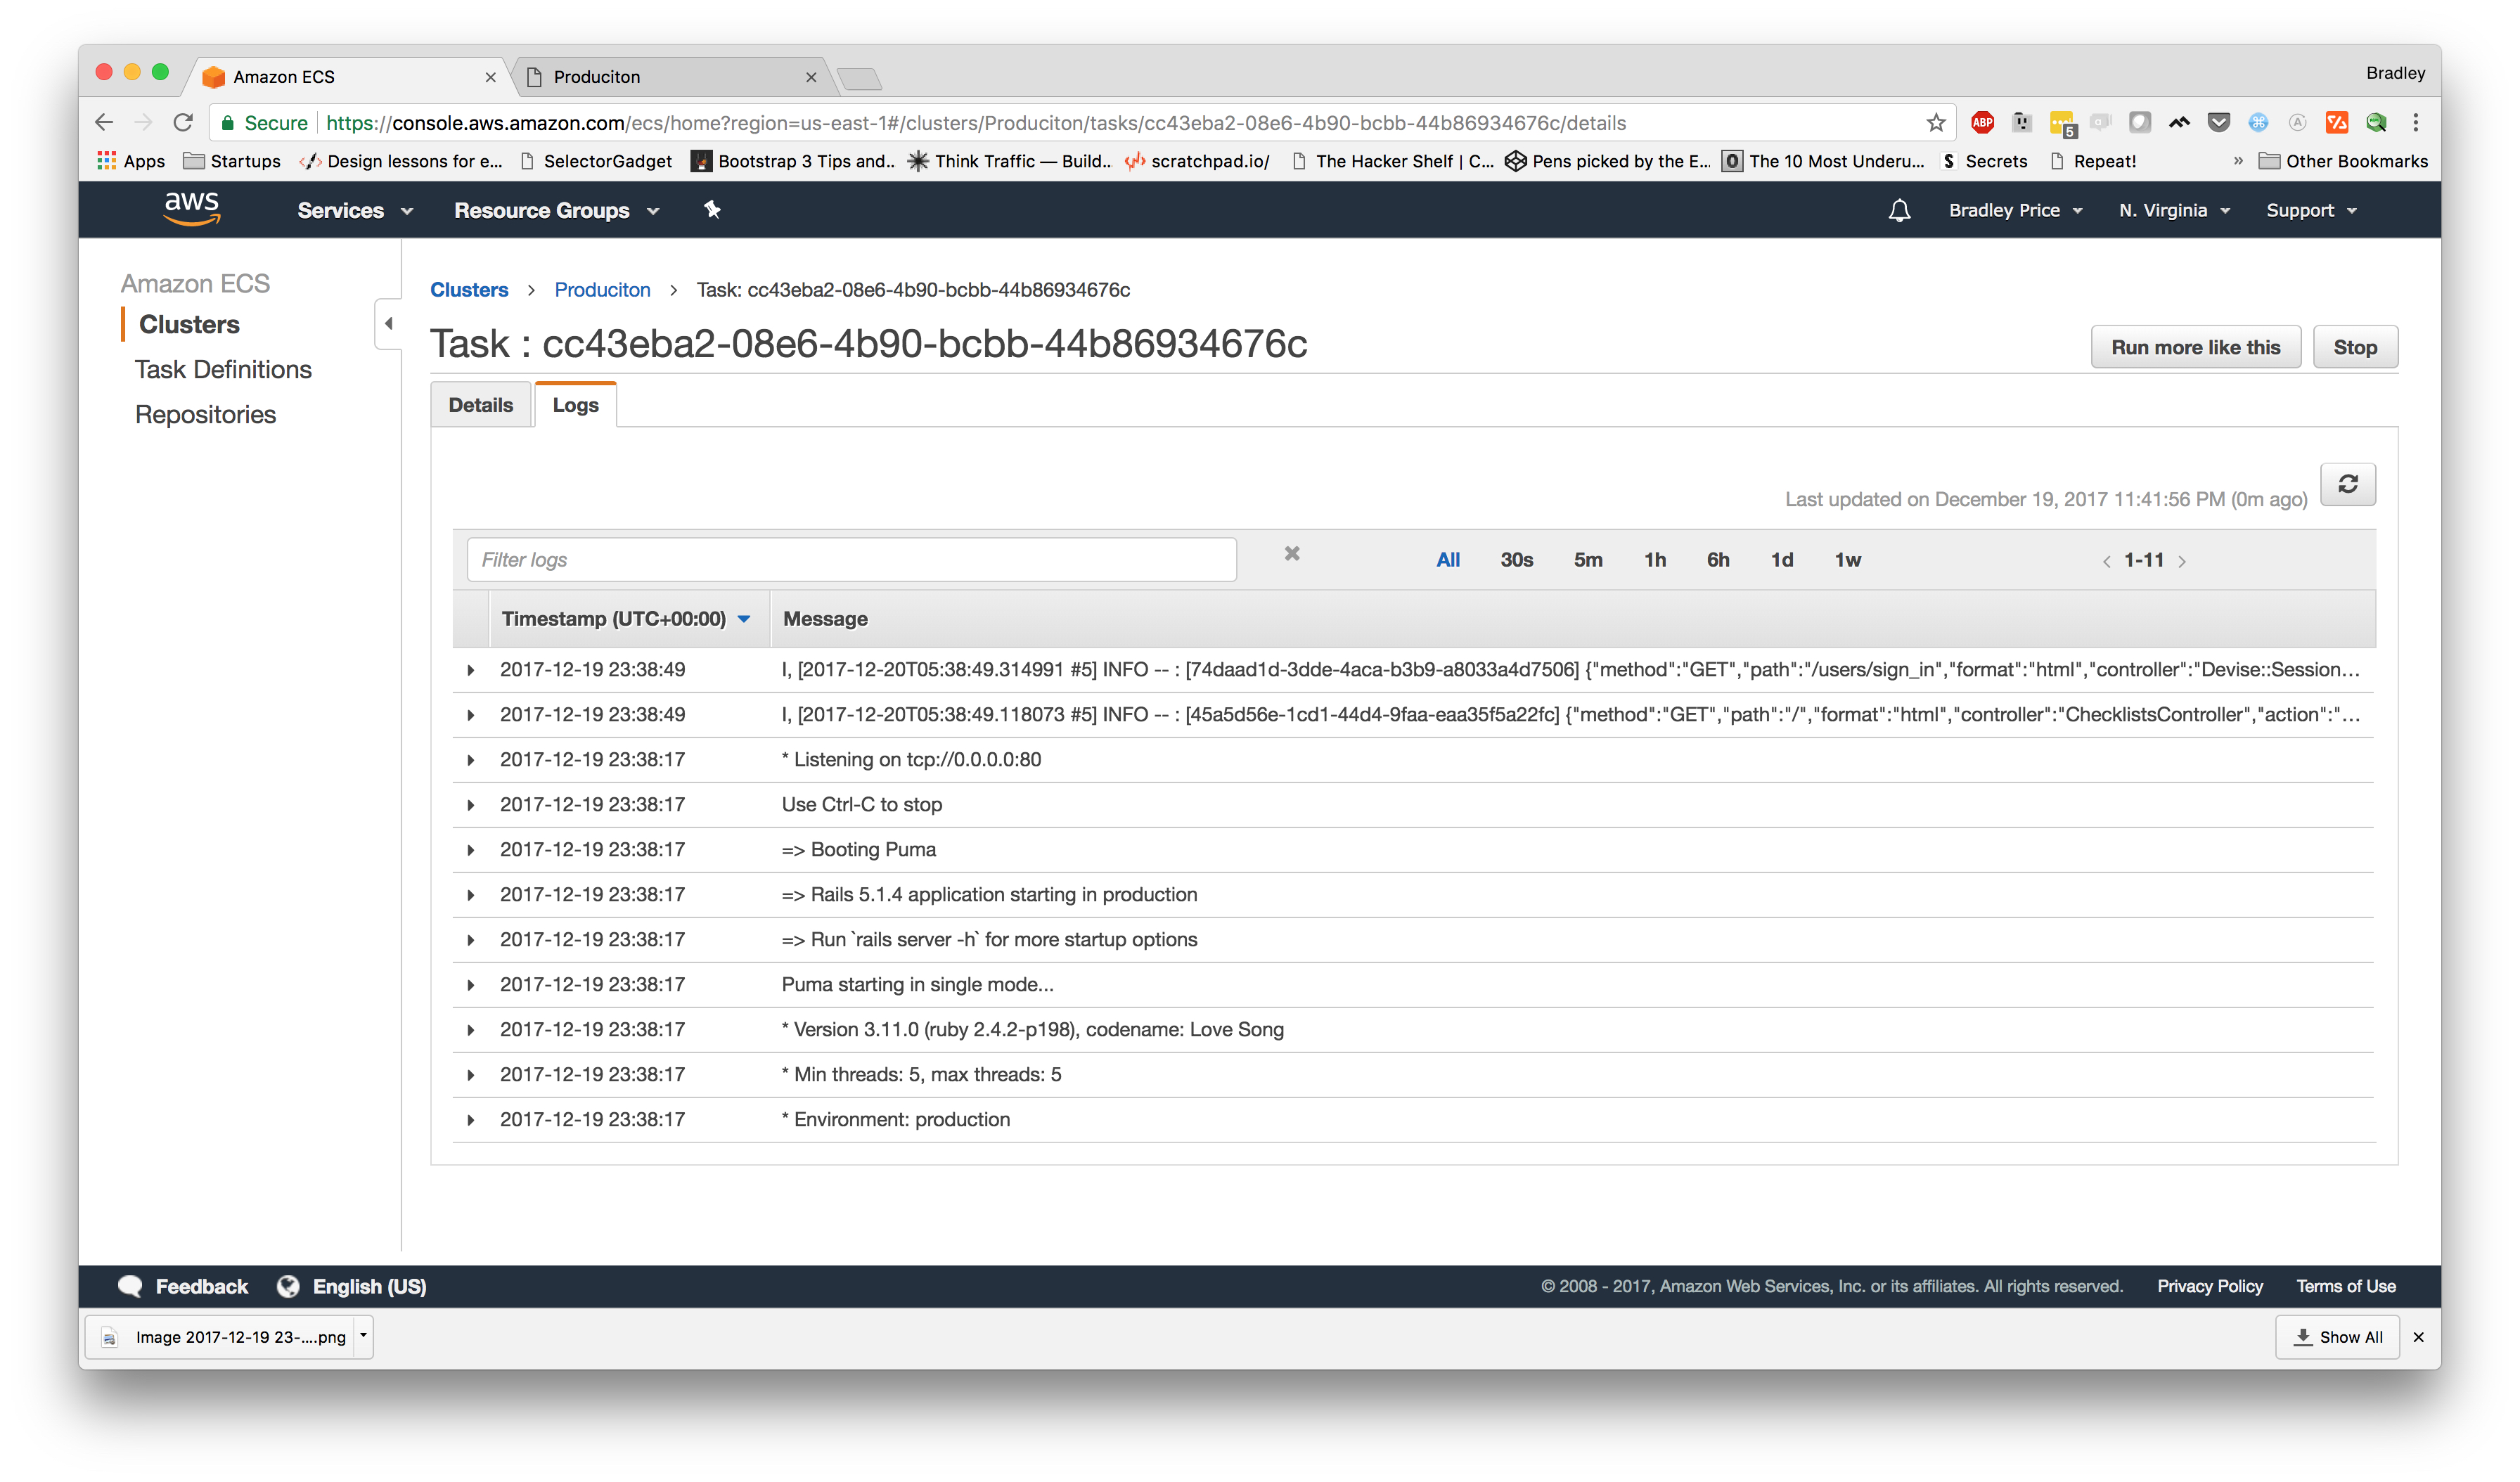
Once the new task is up and running, we can find the IP by selecting the task, clicking on the ENI and getting the address in the "IPv4". Now, if we navigate to that IP address, we should see that our app is still running. Also, we can click on the "Logs" tab in our Task details page and we should see our logs are now being delivered as json.
Shipping our logs to LogDNA
The last step of this process is configuring AWS to ship our logs over to LogDNA. The process of sending our logs to LogDNA requires setting up a lambda function on AWS and configuring our CloudWatch LogGroup to stream logs to the lambda function.
The first step is to head over to LogDNA and setup an account. Once the account is setup, you'll need to login, click on the tab with the cog icon in the top left, and choose "Organization" in the left navigation menu.
Once you've done that, you should be on the "Manage Organization Profile" page. You'll need to get the ingestion key as we'll need that in the next step.

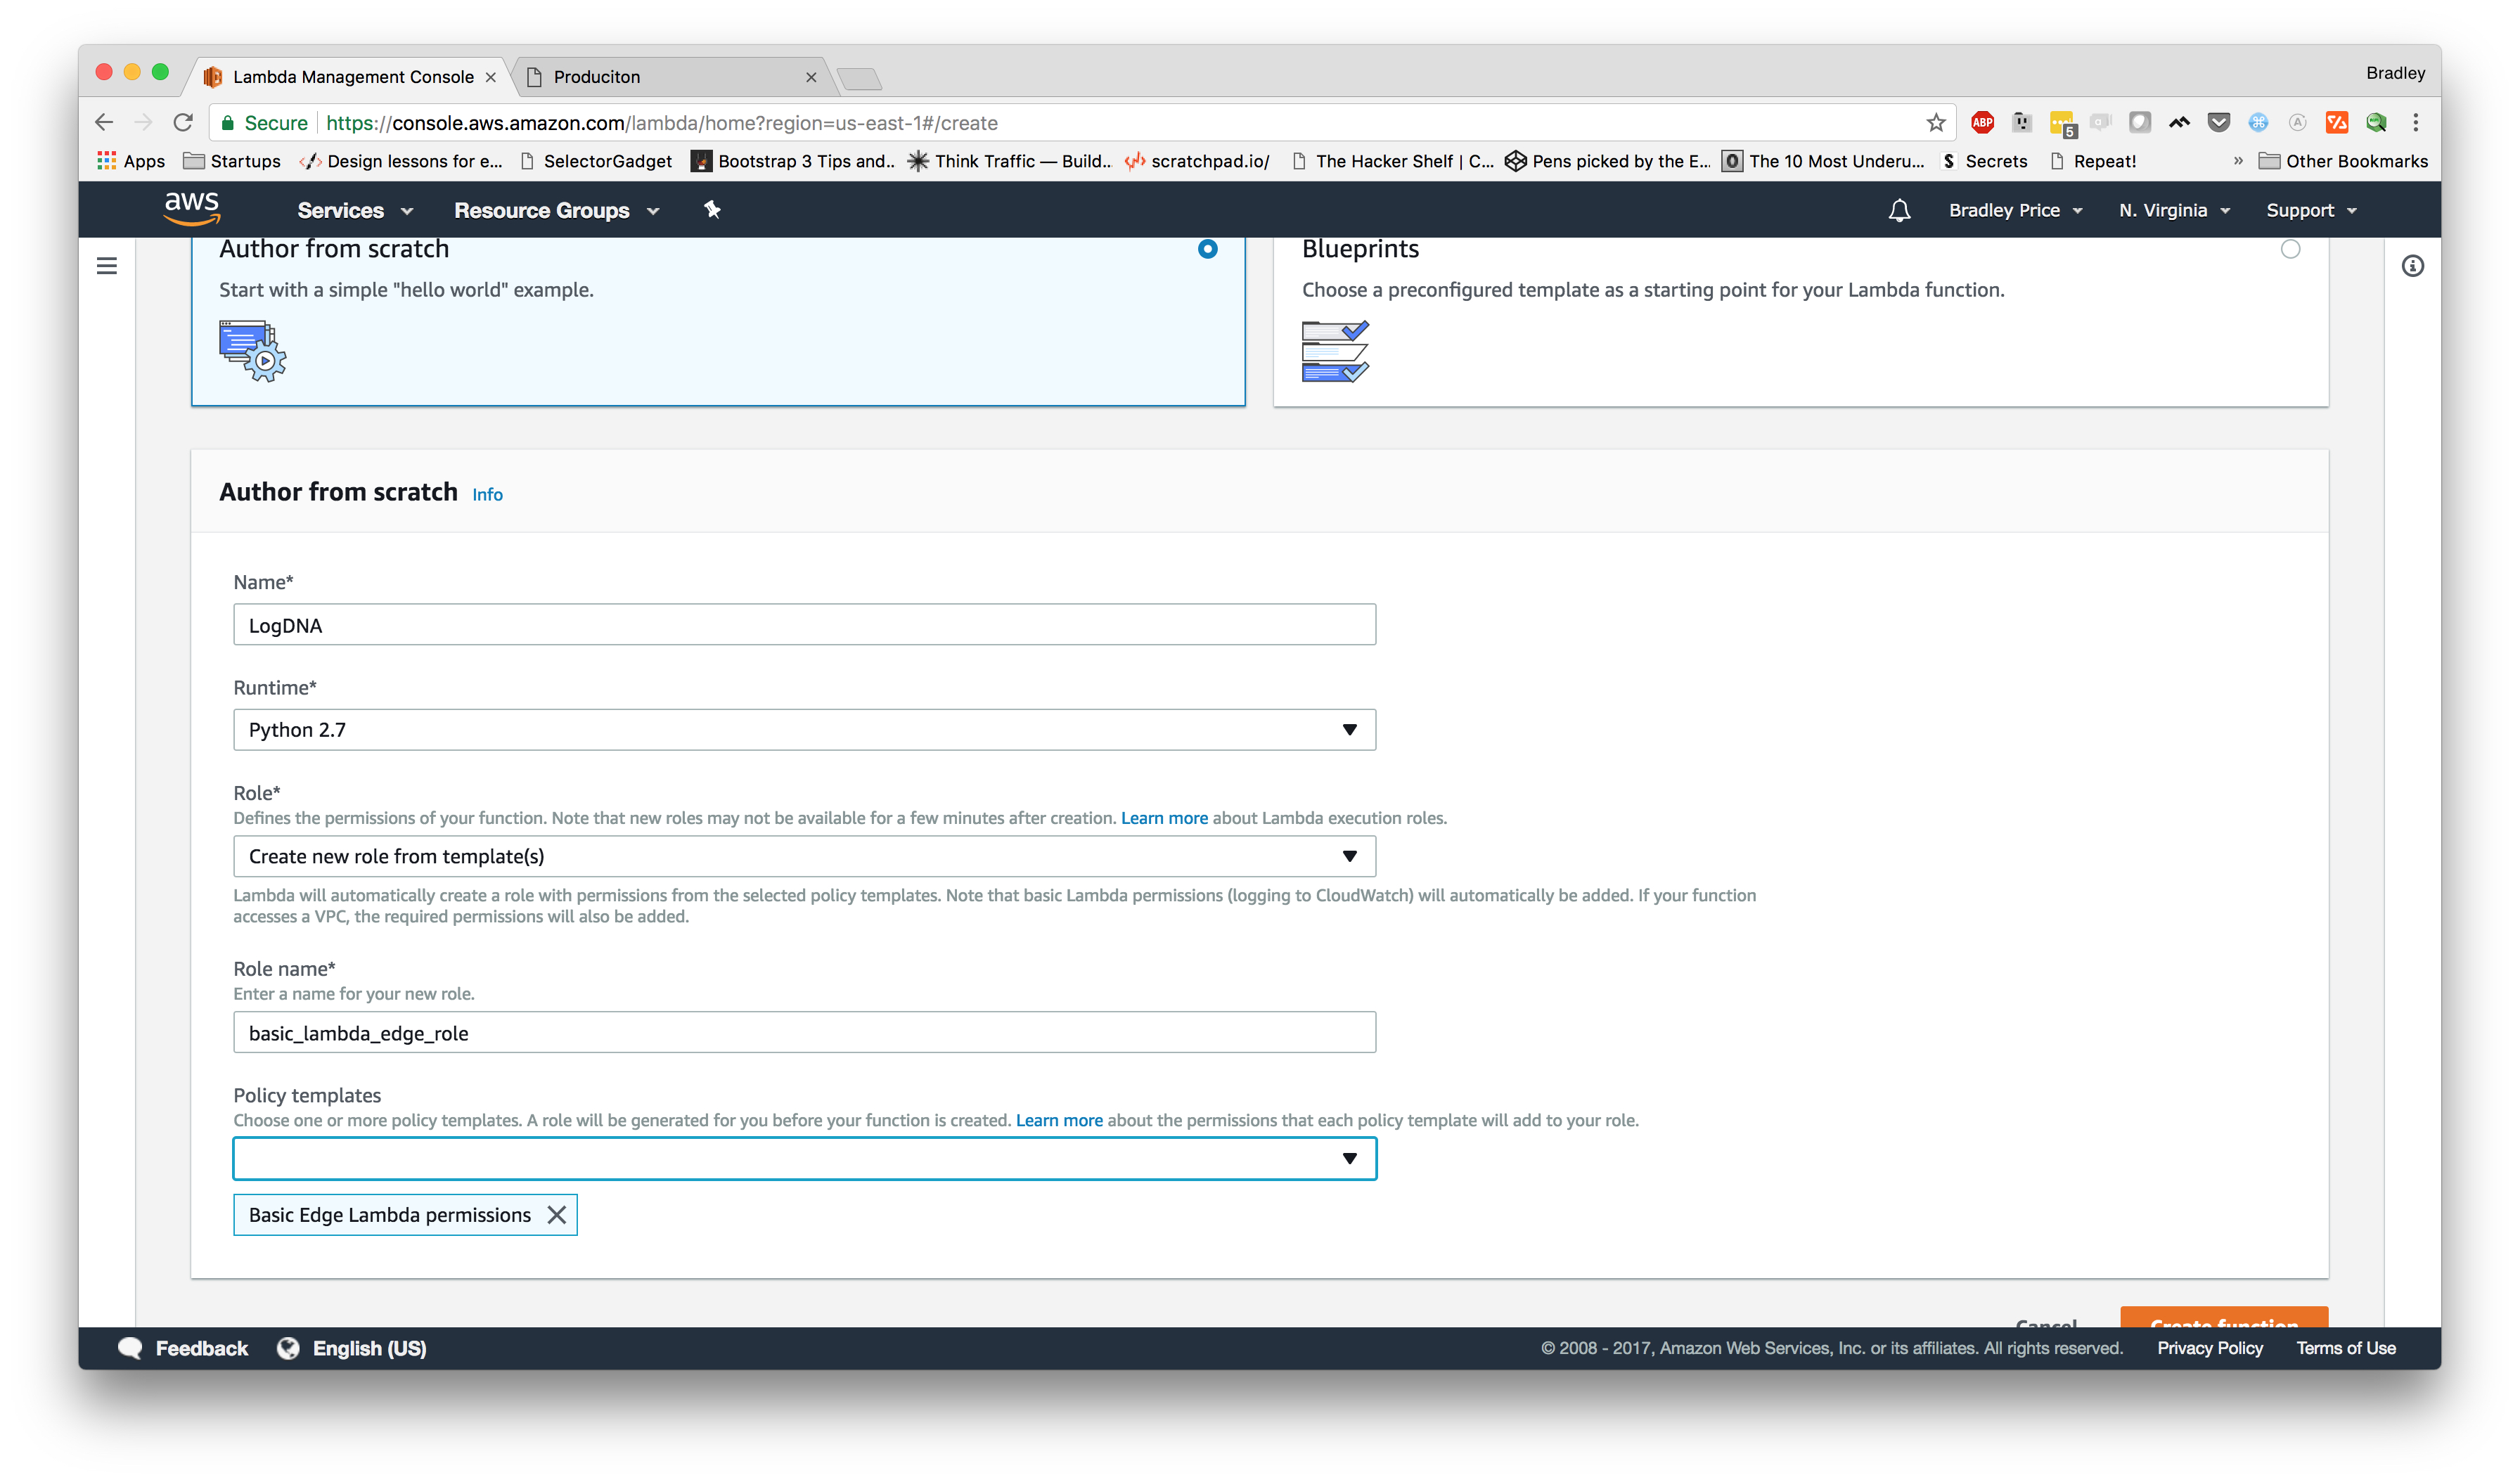
Now, let's move back over to the AWS Console and go to the Services dropdown and choose "Lambda". Click the "Create a function" button. On this page, we are going to skip down to the "Author from Scratch" section and enter the following info:
- Name: LogDNA
- Runtime: Python 2.7
- Role: Create a new role from template(s) (unless you already have an iam user setup that you can use)
- Role name: basic_lambda_edge_role
- Policy Templates: Basic Edge Lambda permissions
The page should now look like this:
From here, if we click the "Create Function" button at the bottom, it should create the lambda function and send us to the configuration page. From here, we need to scroll down to the "Function code" section and set these values:
- Code Entry Type: Upload a file from S3
- Handler: logdna_cloudwatch.lambda_handler
- S3 link URL: https://s3.amazonaws.com/repo.logdna.com/integrations/cloudwatch/lambda.zip
Also, we need to create a LOGDNA_KEY environment variable with the ingestion key from LogDNA. Once all of that is completed, our configuration should look similar to this:

At this point, we can click "Save" in the top right and navigate to the CloudWatch console.
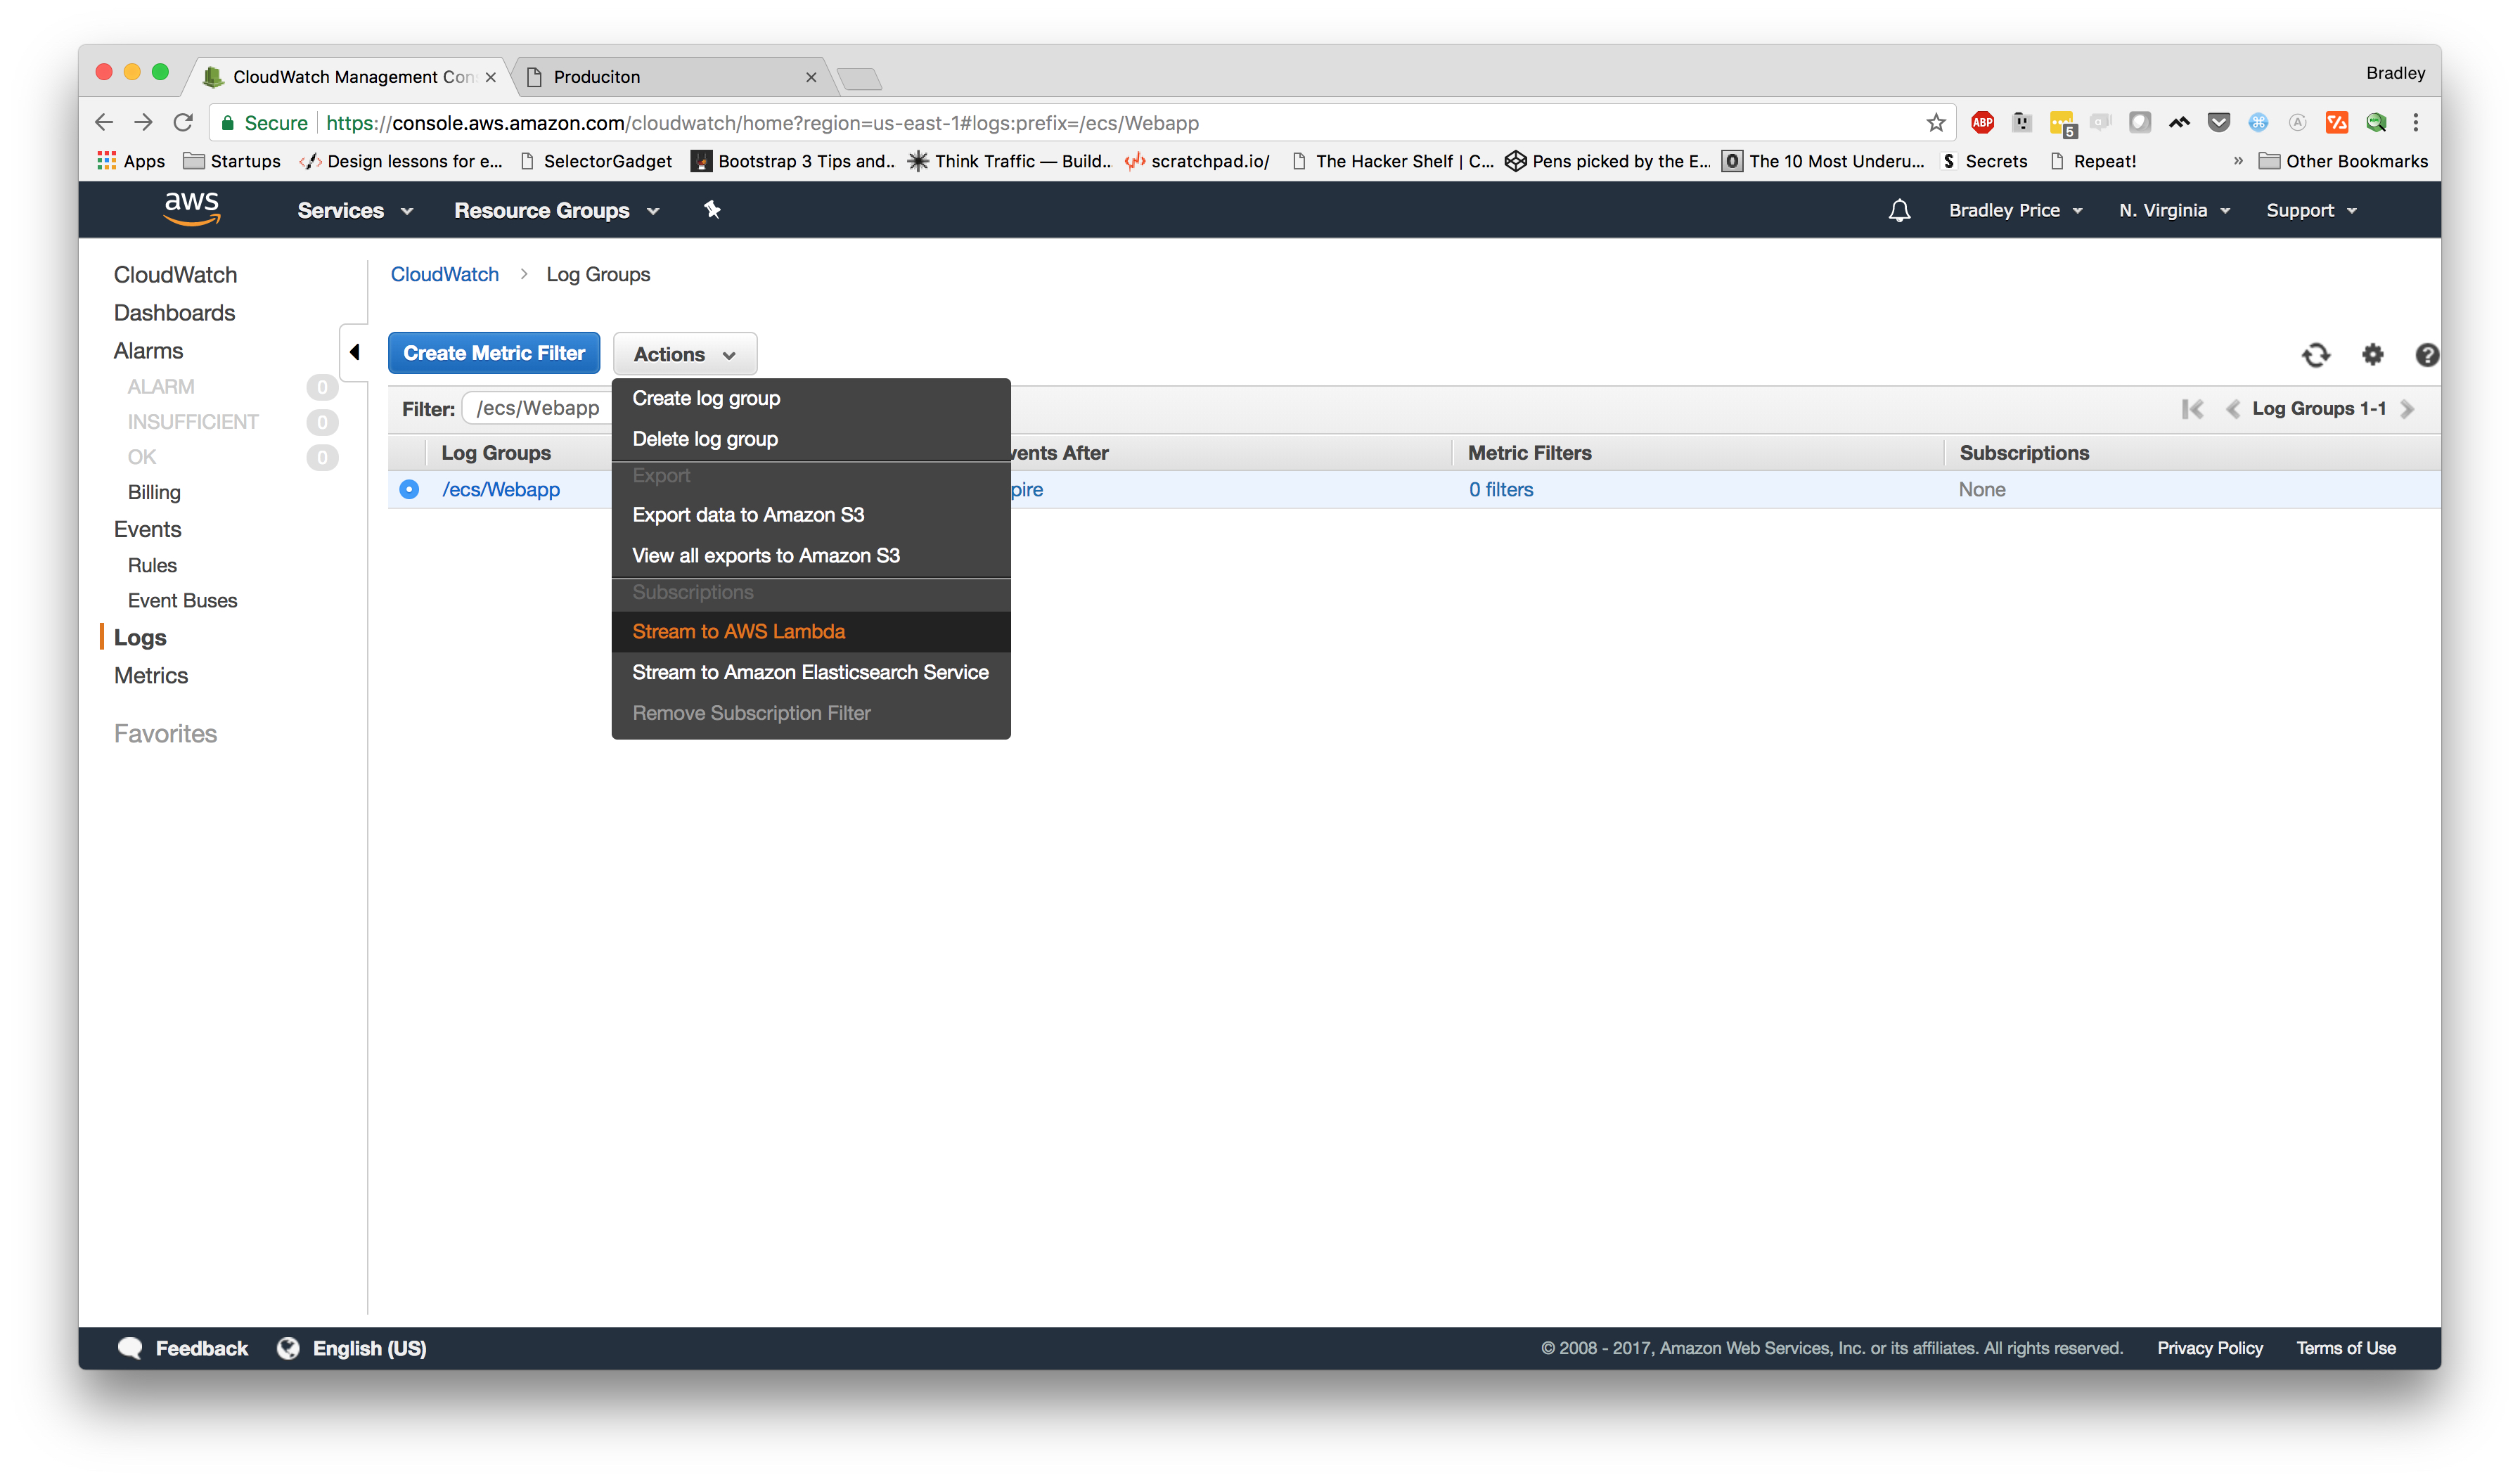
Once we are in the CloudWatch console, we need to click on "Logs" in the left navigation menu and find our Log Group for our ECS Service. If you follow along with the last video, it will probably be called /ecs/Web. Once you have found your Log Group, select the button on the left of the row and choose "Stream to AWS Lambda" from the Actions dropdown.
Once you click "Stream to AWS Lambda" it will redirect you to another page to choose the Lambda Function. Choose "LogDNA" and click next. Now, it should ask you to choose a log format. Select Json and click next. On the last page, click "Start Streaming".
At this point, we should be redirected back to the CloudWatch Log Groups page and we can see "Lambda (LogDNA)" under the Subscriptions column for our service's log group.
Finally, we can head back over to our produciton app and refresh the page a few times to make some traffic. Once we've done that, we can head back over to LogDNA, click on "Everything" from the left navigation pane and see our logs being aggragated.

Summary
Today we dove into configuring our rails application to format logs using a Json formatter, at the environment level. We also learned the basics of creating a lambda function and configuring CloudWatch to stream the logs to LogDNA using that lambda.
Take some time to go through LogDNA and look through all of the features. Some of features they offer include natural language searching, the ability to setup views for filters you might frequently use, and a decent assortment of filter options.


