Deploying to AWS Part IV: Performance monitoring with Scout
Looking for a fresh, 2018 approach to deploying a Rails app to AWS? We've partnered with DailyDrip on a series of videos to guide you through the process. We'll be covering how to Dockerize a Rails app, AWS Fargate, logging, monitoring, and CDN support.
Today, we're configuring application performance monitoring for our Rails app using Scout. In the last video, we configured AWS to ship our logs to LogDNA, but logging is just one of the three pillars of observability. With Scout's transaction
Let's dive in.
Getting Started
Let's get started by visiting Scout and creating a new account. Once we've
For this, we're going to select "Ruby on Rails", which then takes us to this page:
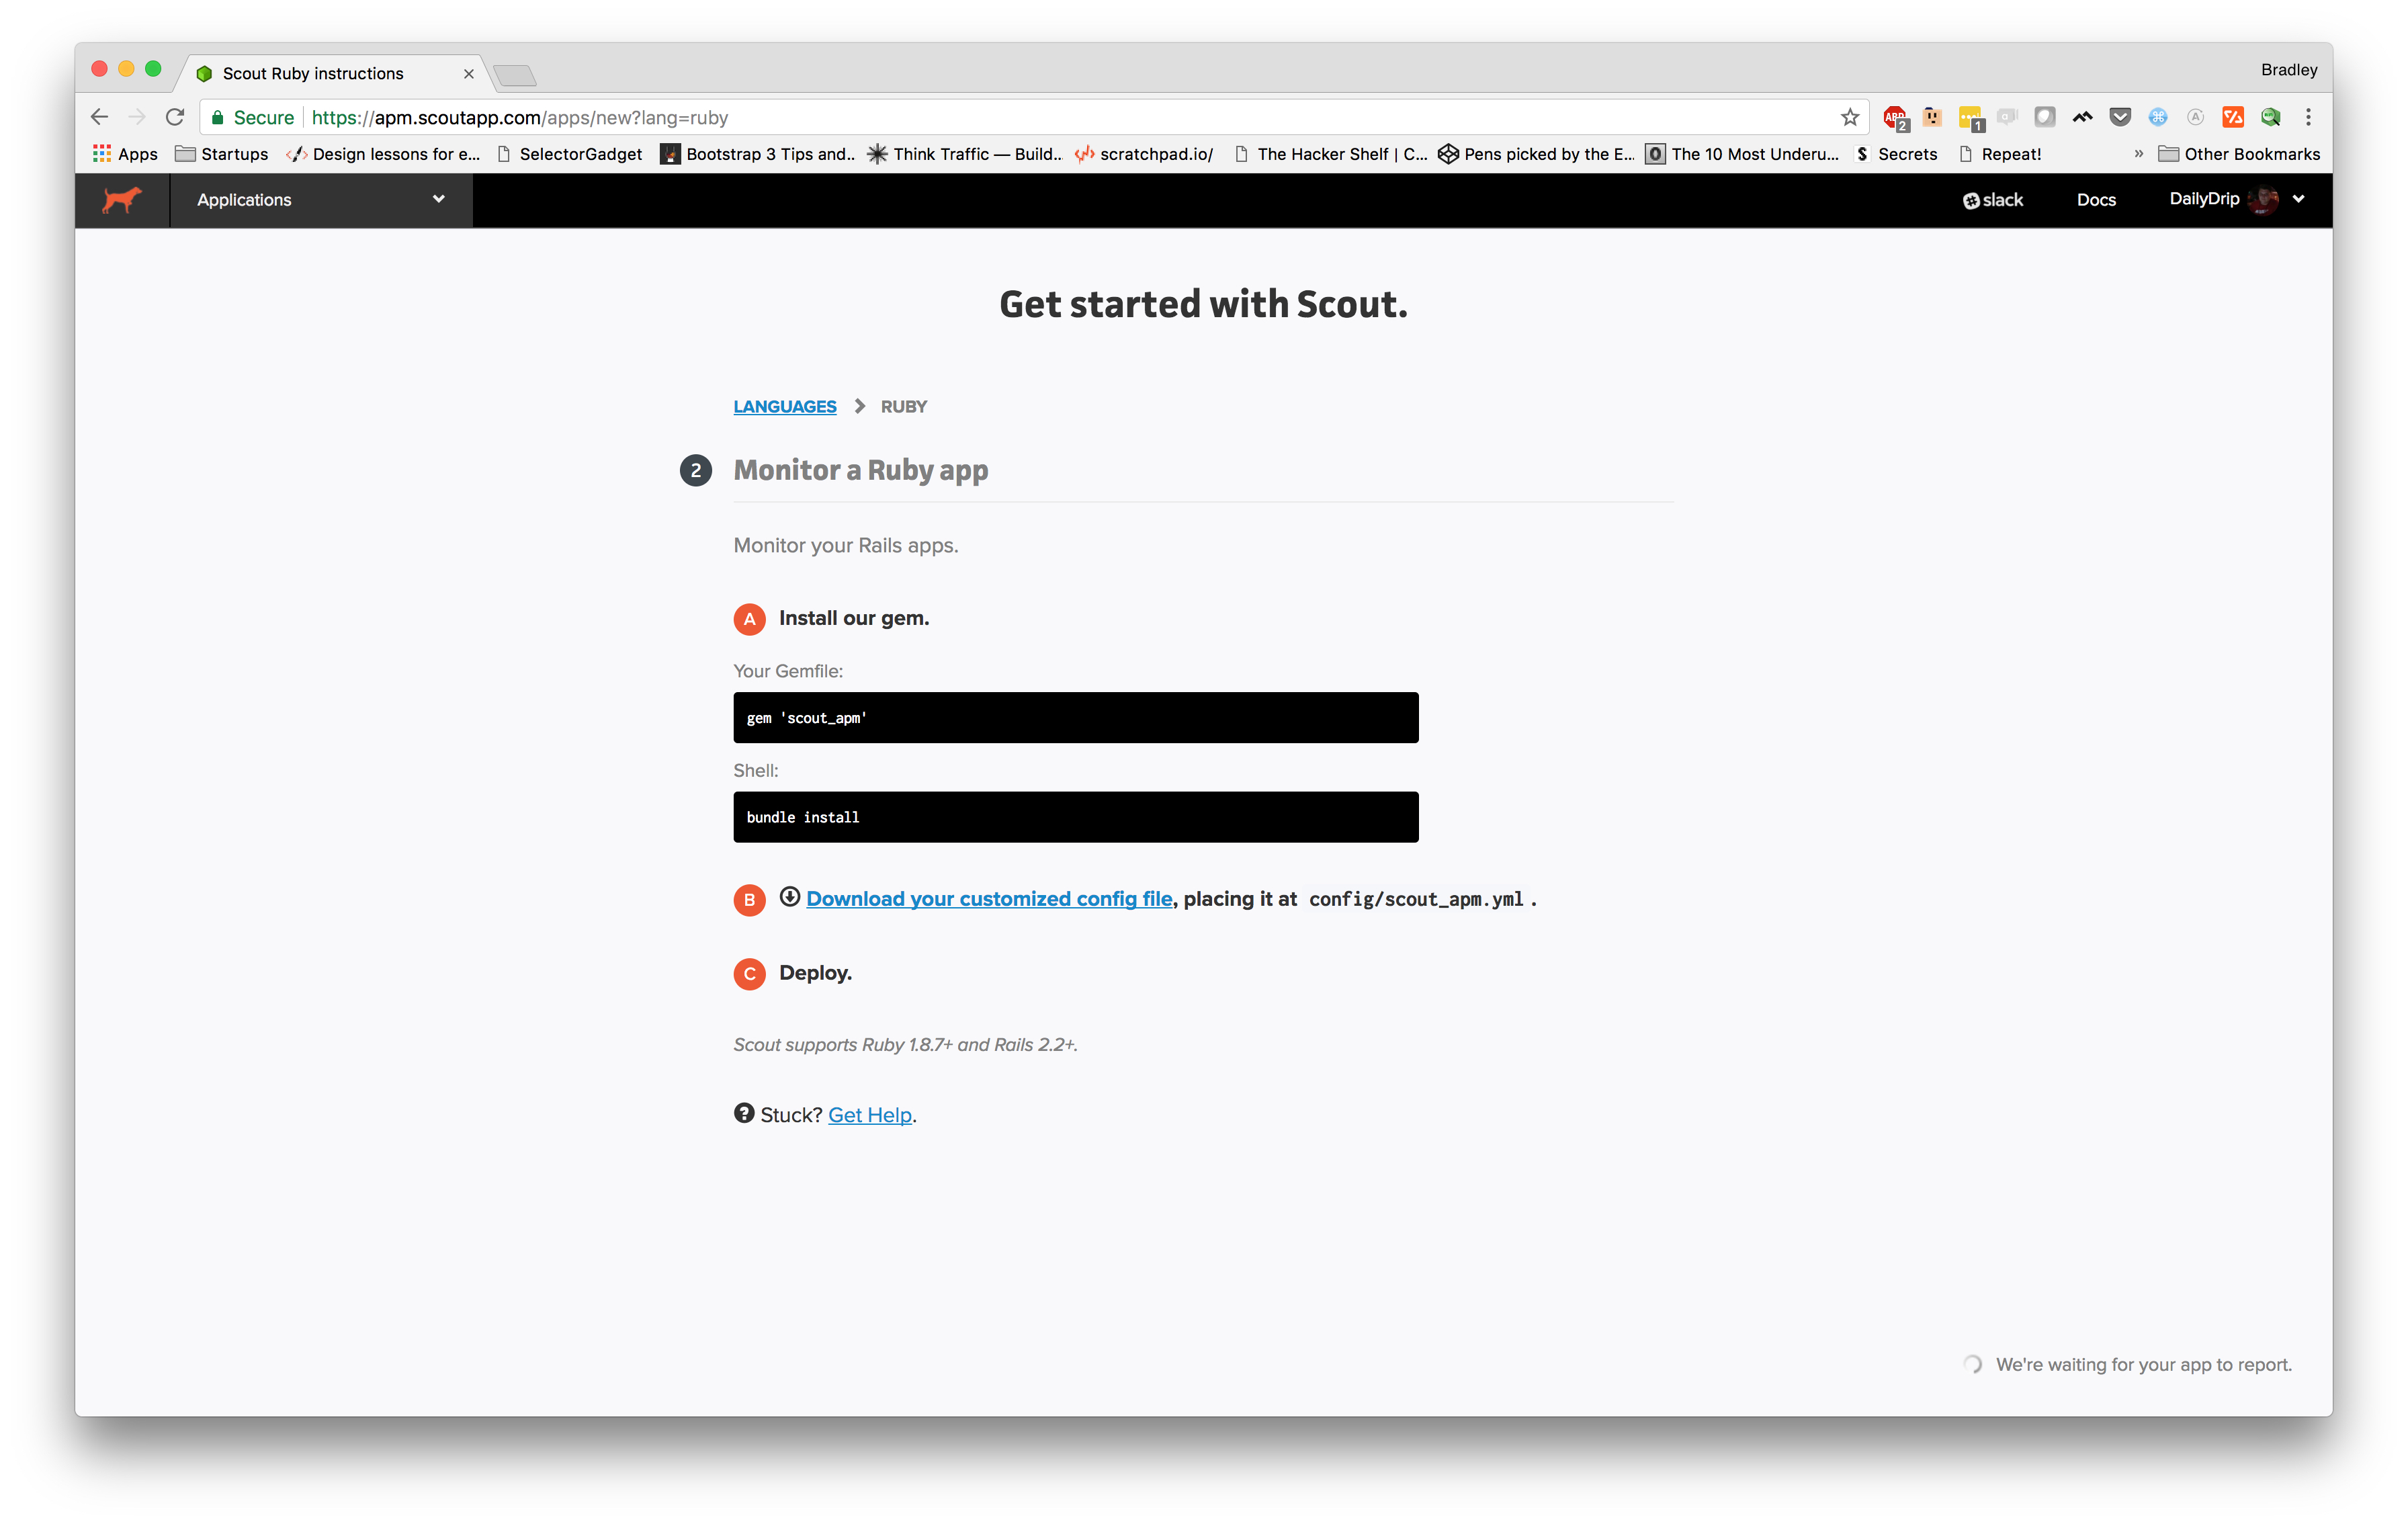
Since we're using environment variables, we'll use that to configure Scout. We'll set two variables:
SCOUT_KEY - our Scout API KEY
SCOUT_DEV_TRACE - This adds a small speed badge in our browser in development mode. Clicking the badge reveals a transaction trace. We can use this to confirm Scout is working.
After adding scout_apm to Gemfile
➜ produciton.com git:(bprice/setup-scout) ✗ SCOUT_KEY=SCOUT_DEV_TRACE=true RAILS_SERVE_STATIC_FILES=true SECRET_KEY_BASE= DATABASE_URL= RAILS_LOG_TO_STDOUT=true bundle exec rails s
Now, open a browser tab and http://localhost:3000
Let's switch back over to Scout and see what's happened:
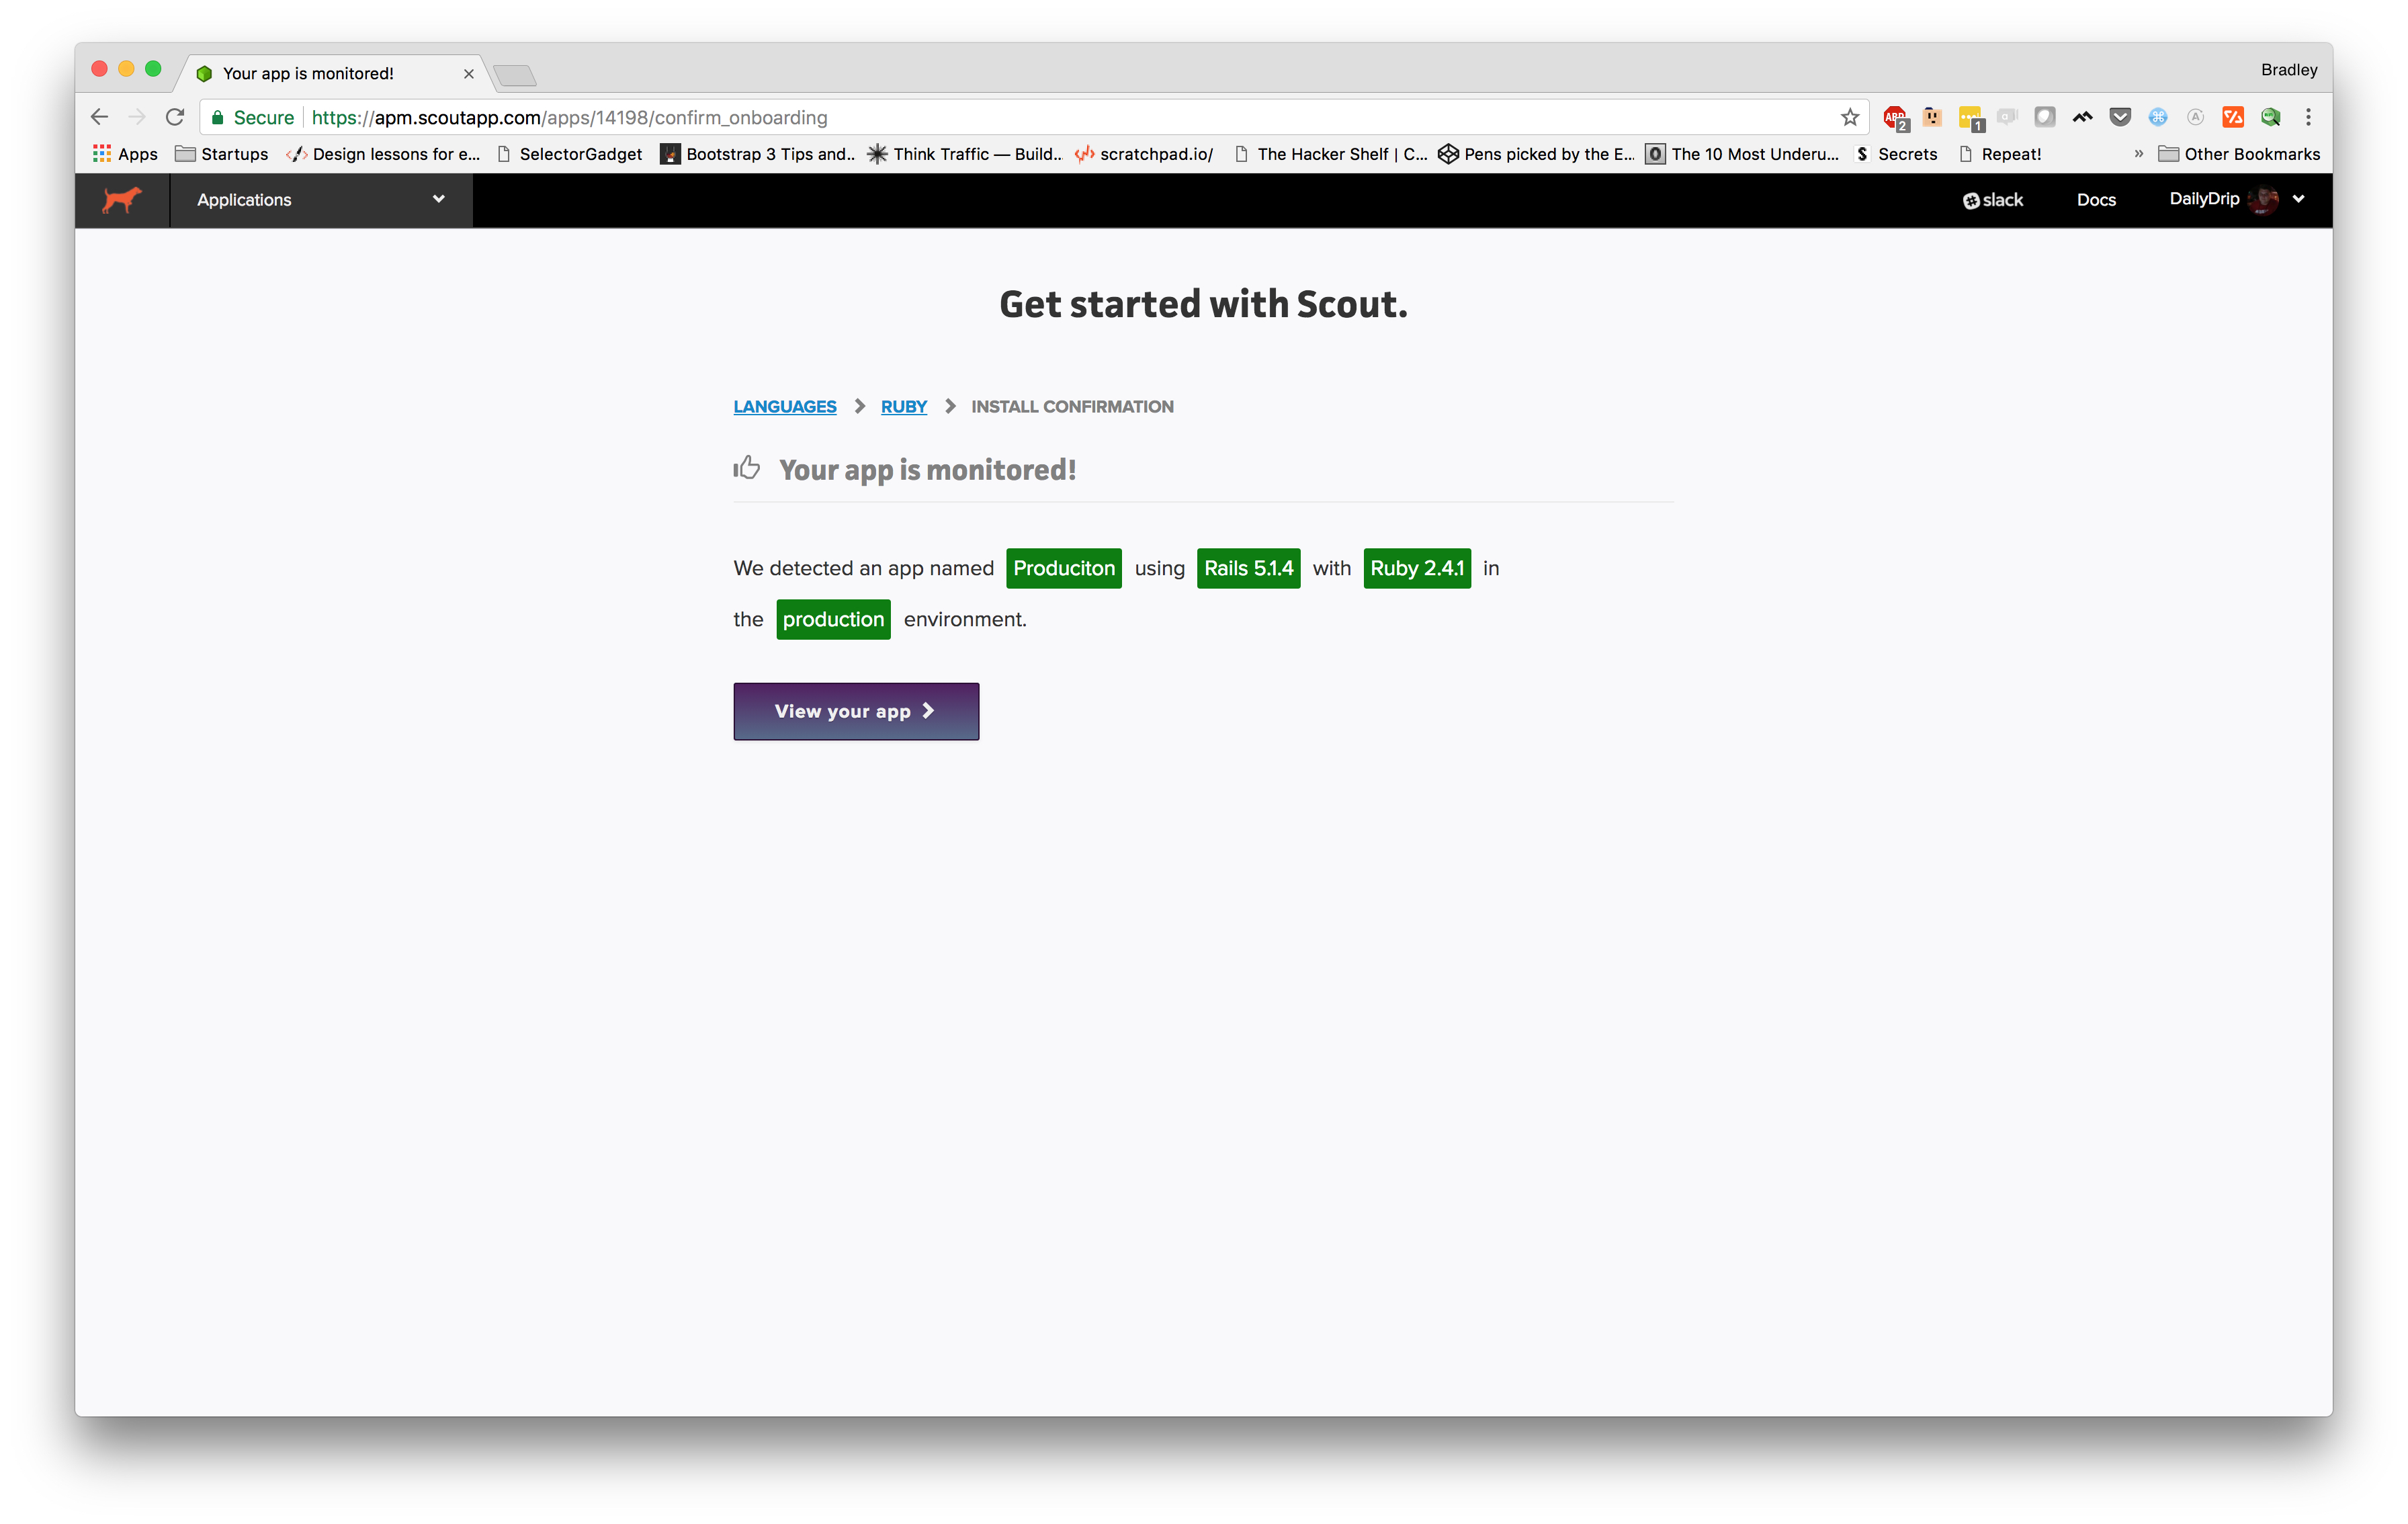
Well, it doesn't get much easier than that. It's already sent some traces up to the Scout server and it has recognized quite a few things about our app already.
Now, we're ready to commit these changes and push the new image up to AWS.
➜  produciton.com git:(bprice/setup-scout) docker build -t production .
(concatenated output...)
Successfully tagged production:latest
➜  produciton.com git:(bprice/setup-scout) docker tag production:latest 154477107666.dkr.ecr.us-east-1.amazonaws.com/dailydrip/produciton
➜  produciton.com git:(bprice/setup-scout) docker push 154477107666.dkr.ecr.us-east-1.amazonaws.com/dailydrip/produciton
(concatenated output...)
latest: digest: sha256:8f0ace7abf2c3a0277c7491497f3b445518031596ce5e13a86704ee79871172b size: 2840
This time will be a little different than the last time we had to make a change to the code and push a new
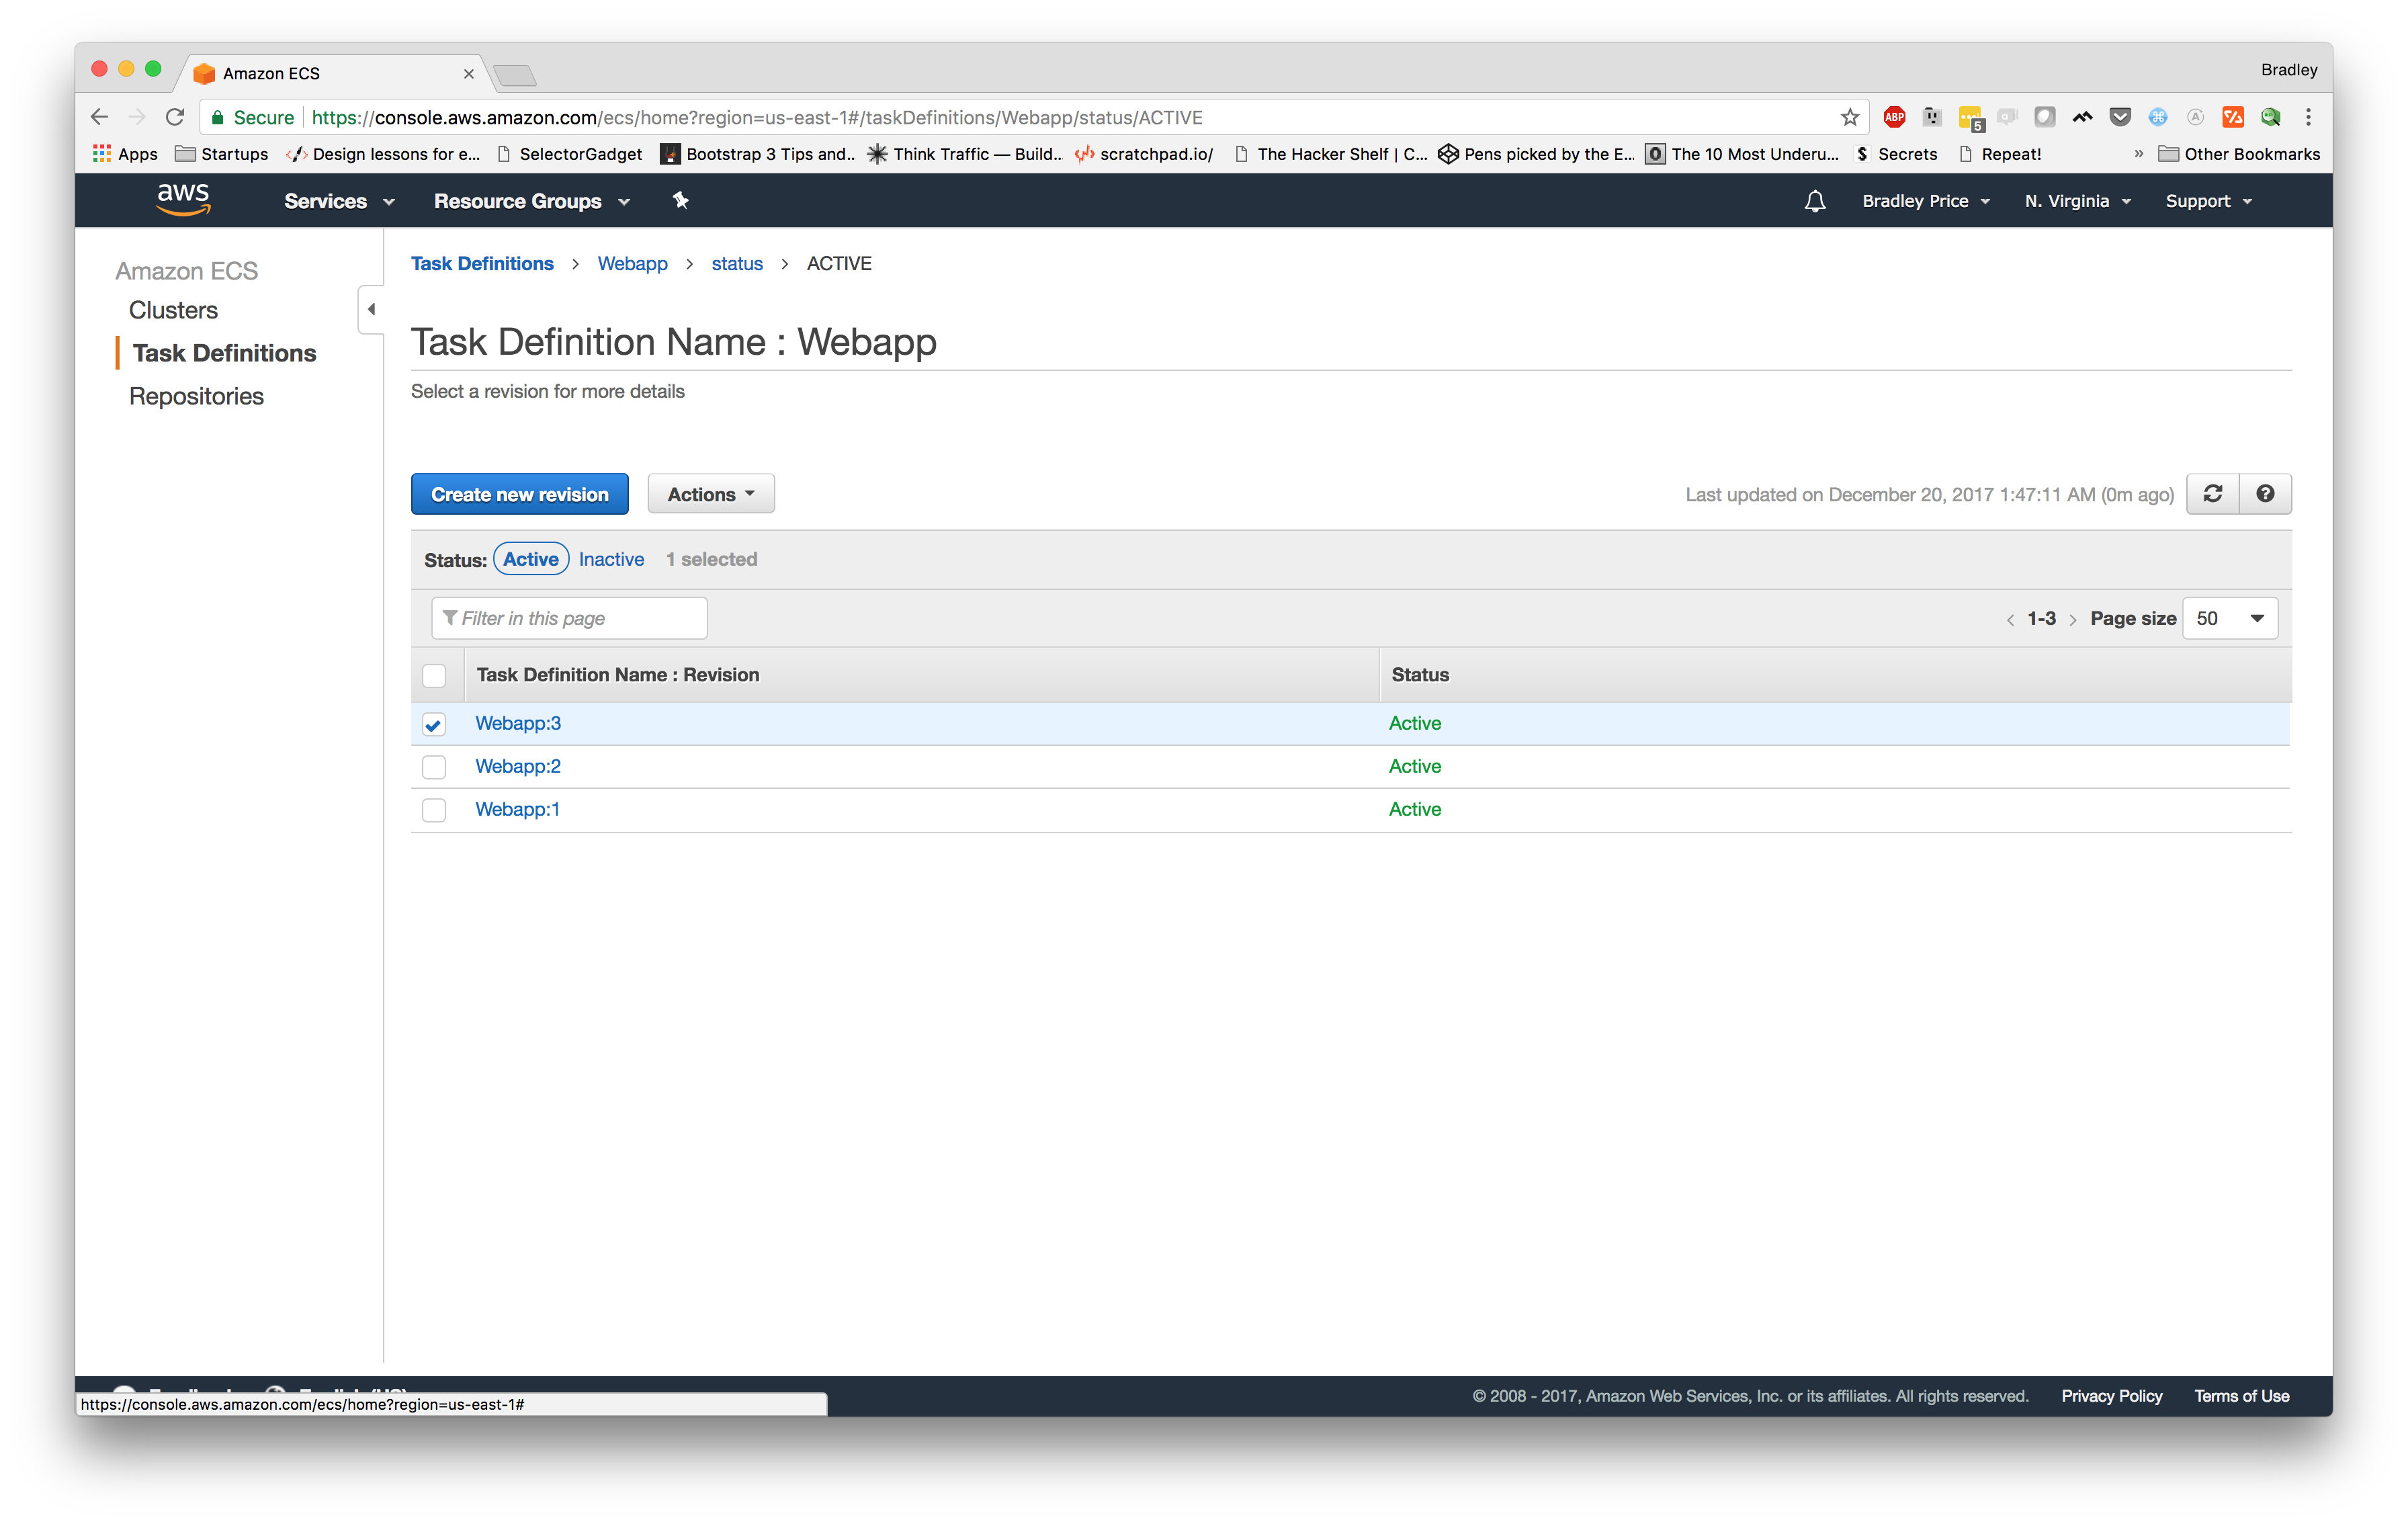
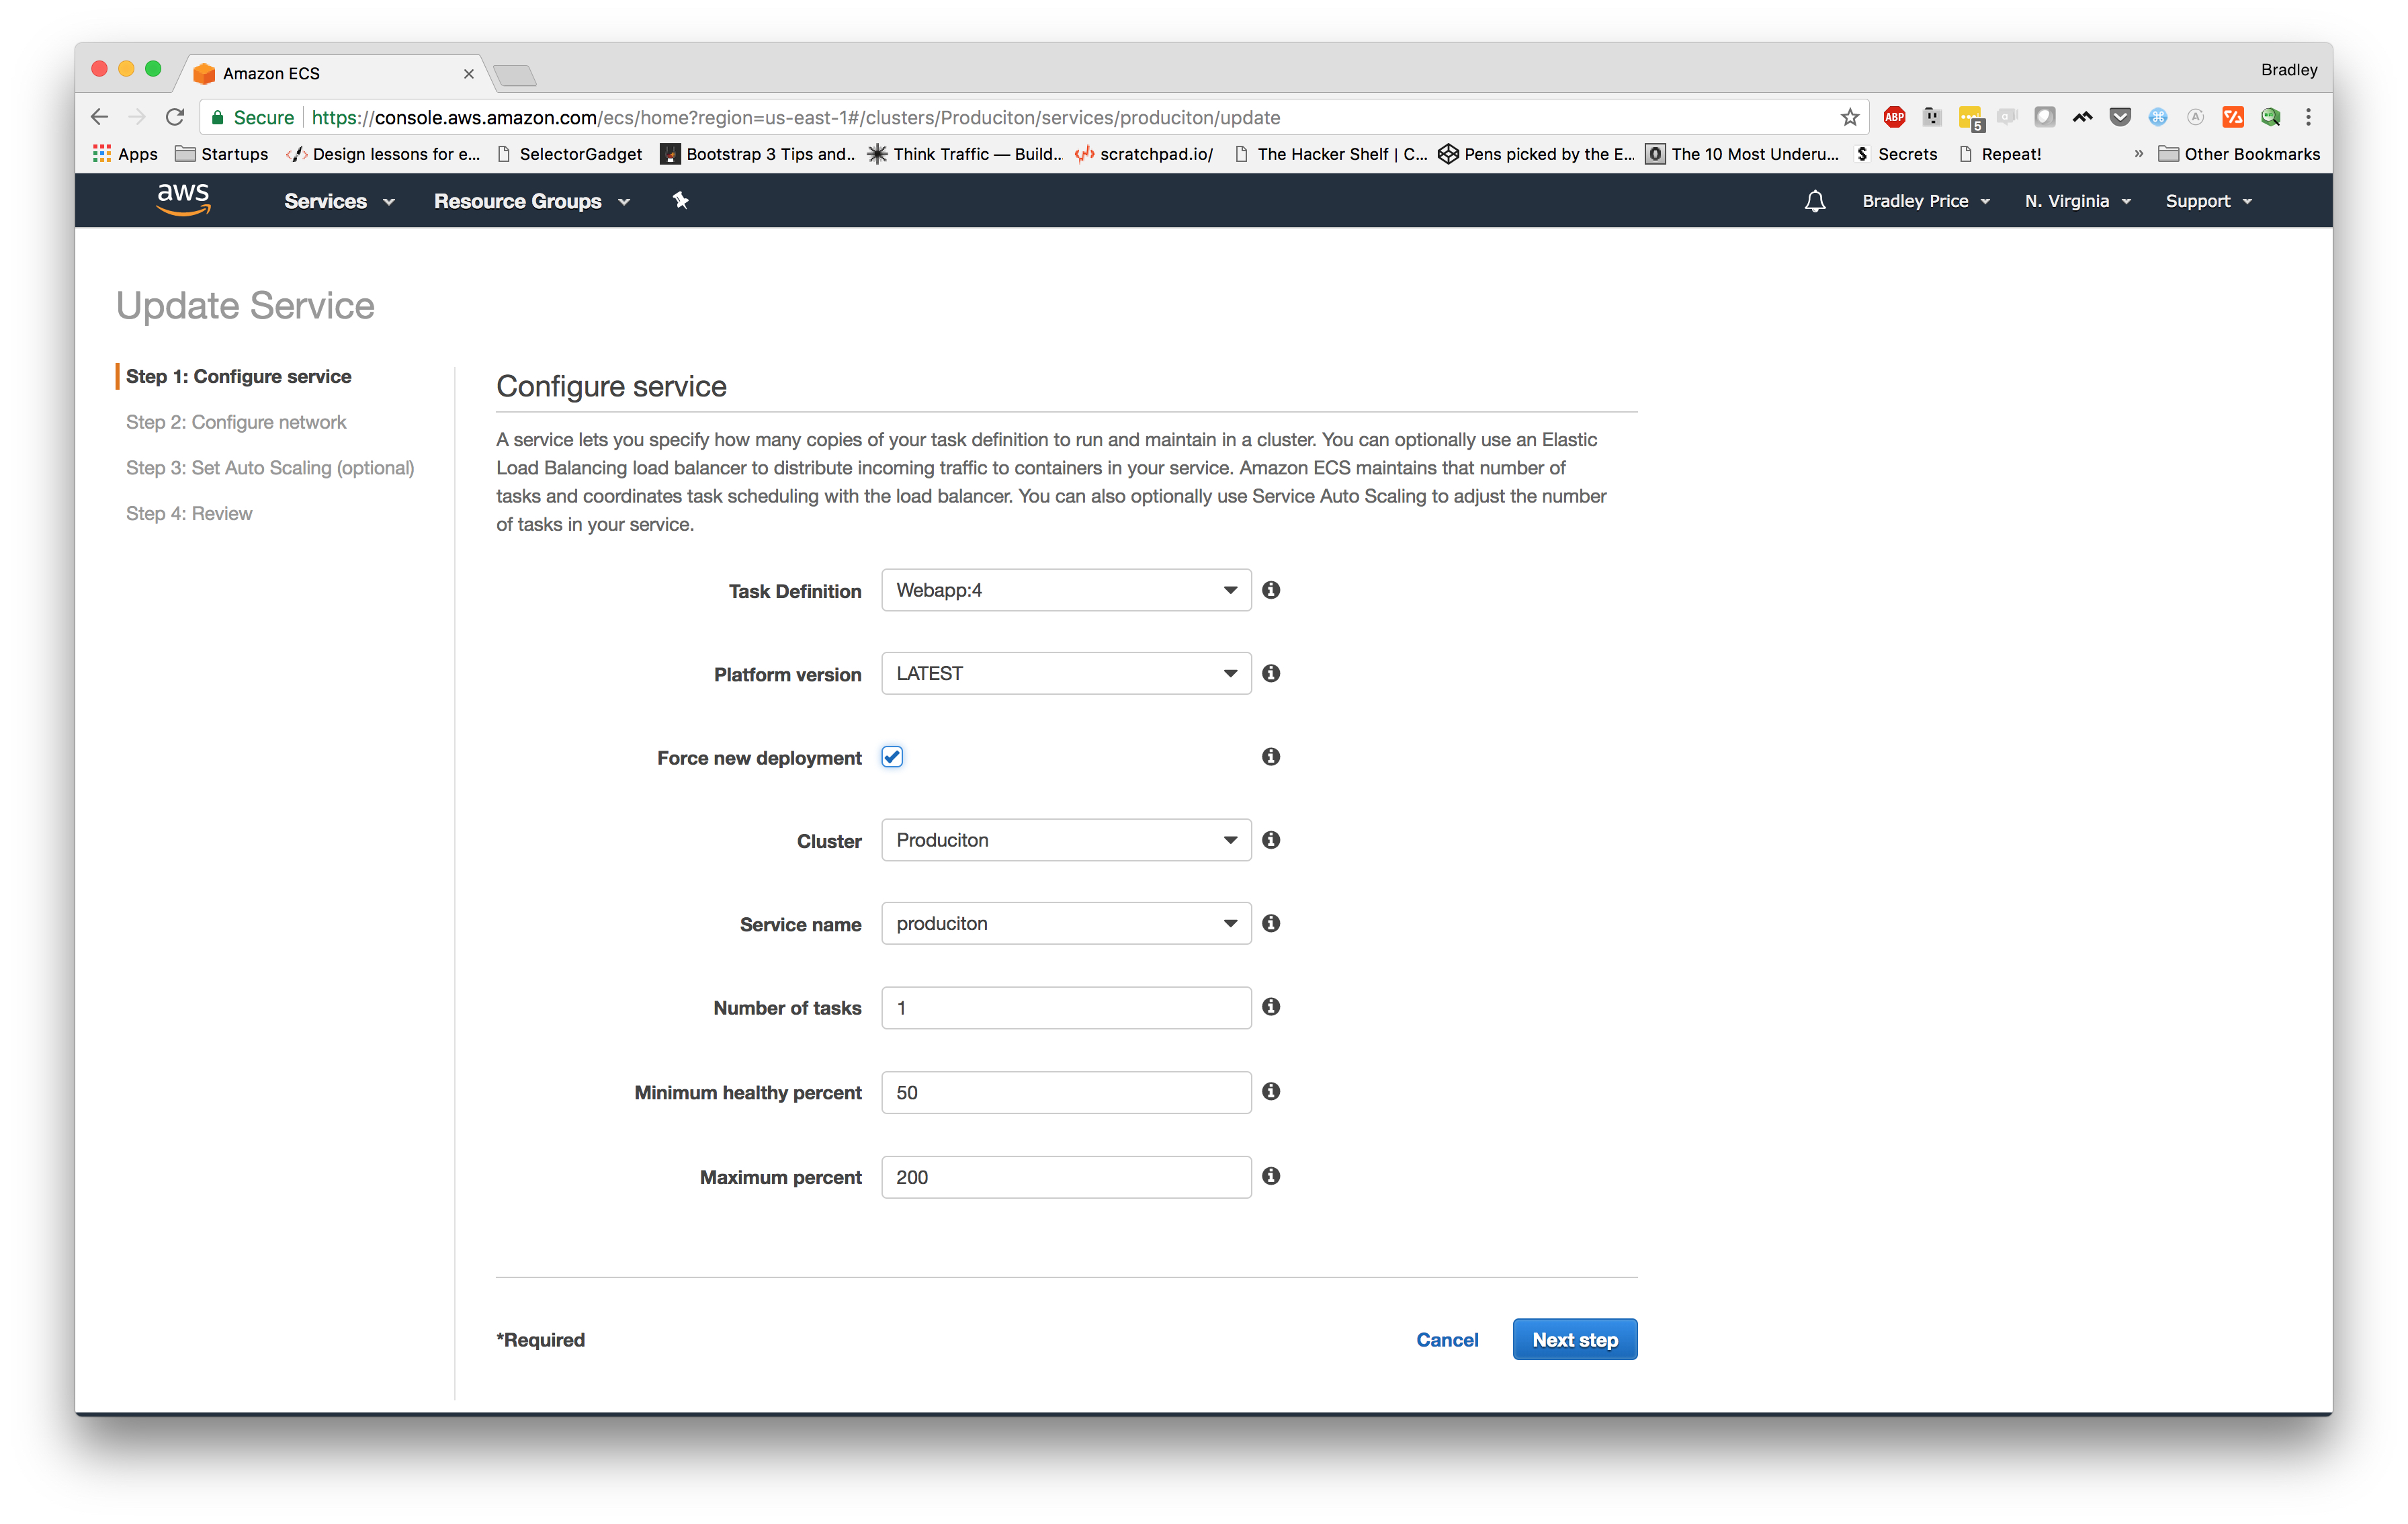
Now, let's make sure we select the latest revision and click "Create new revision". On the next page, we need to scroll down to the "Container Definitions" section and click on our "production" container name, which should slide out a modal. From here, we need to scroll down and add a new environment variable SCOUT_KEY
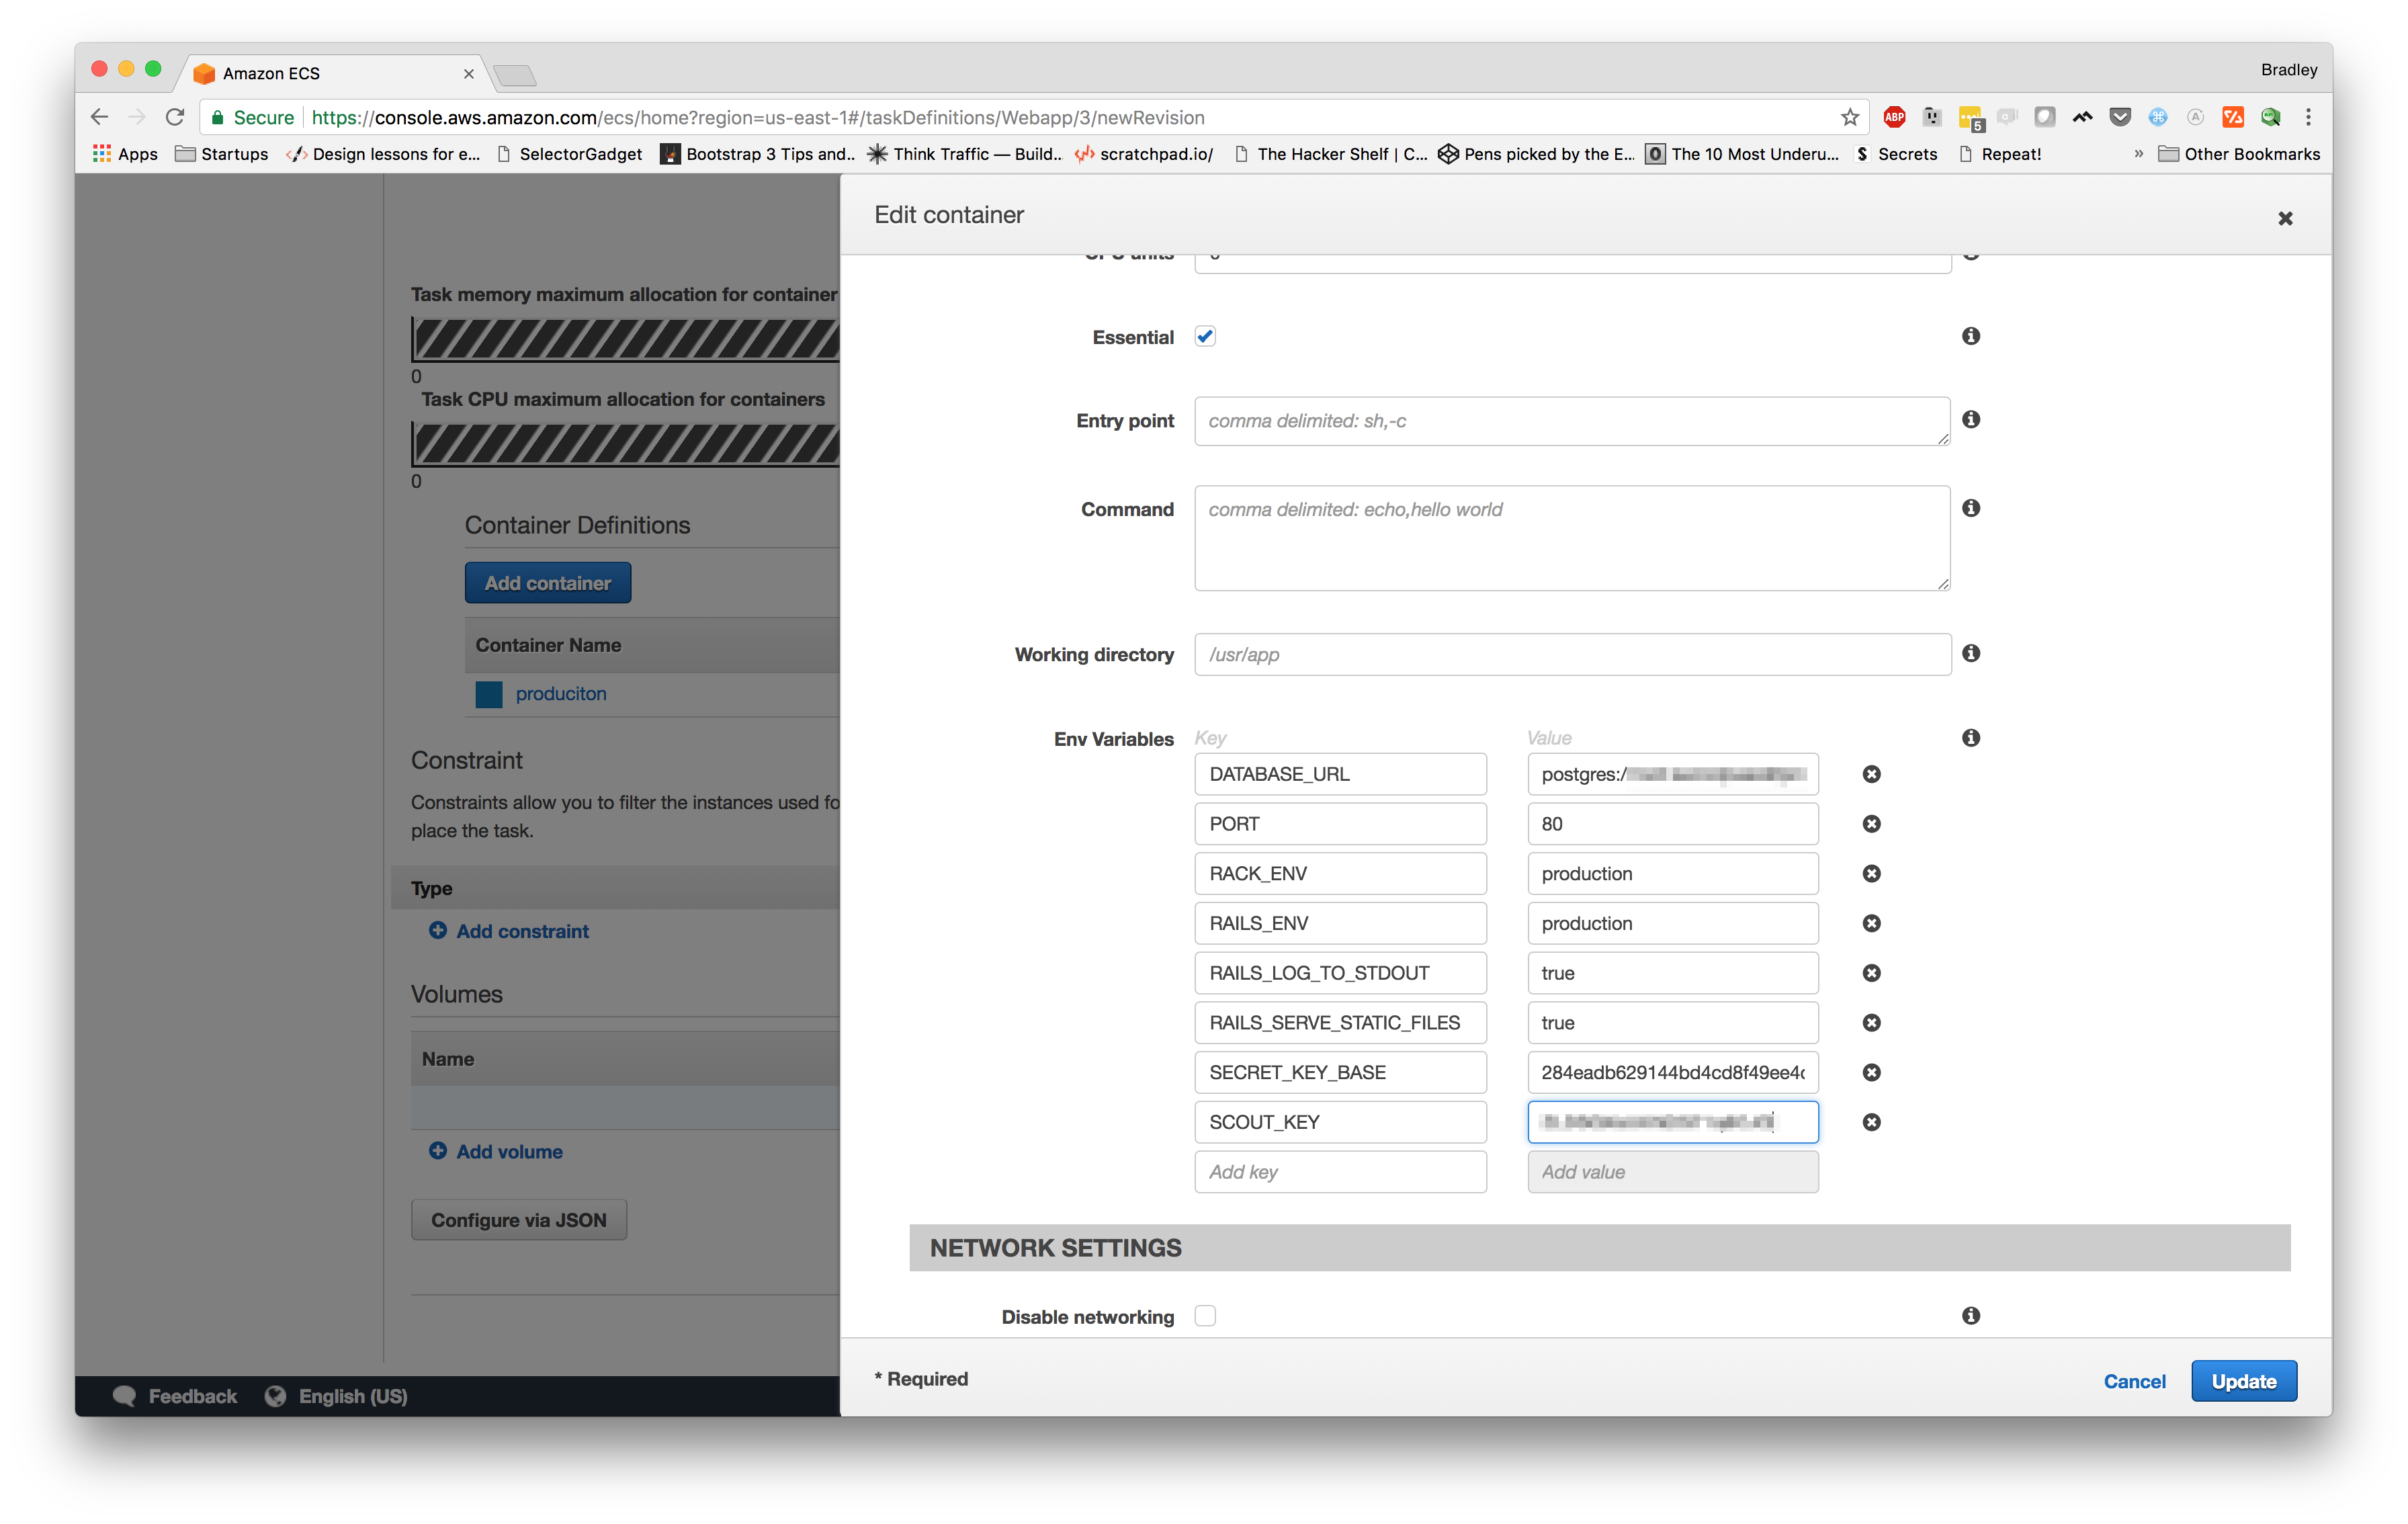
Once we are finished, we can click update then scroll to the bottom and click "Create". We should now be looking at the details page for the new revision of the task definition.
Now, we can navigate over to our "Clusters" section from the left menu and choose our "
Let's select our newest task definition for our service. The newest revision for my task definition is "
Now, we can navigate back to our "
Once we've hit the service and generated some traffic, let's head back over to Scout and make sure our logs are showing up.
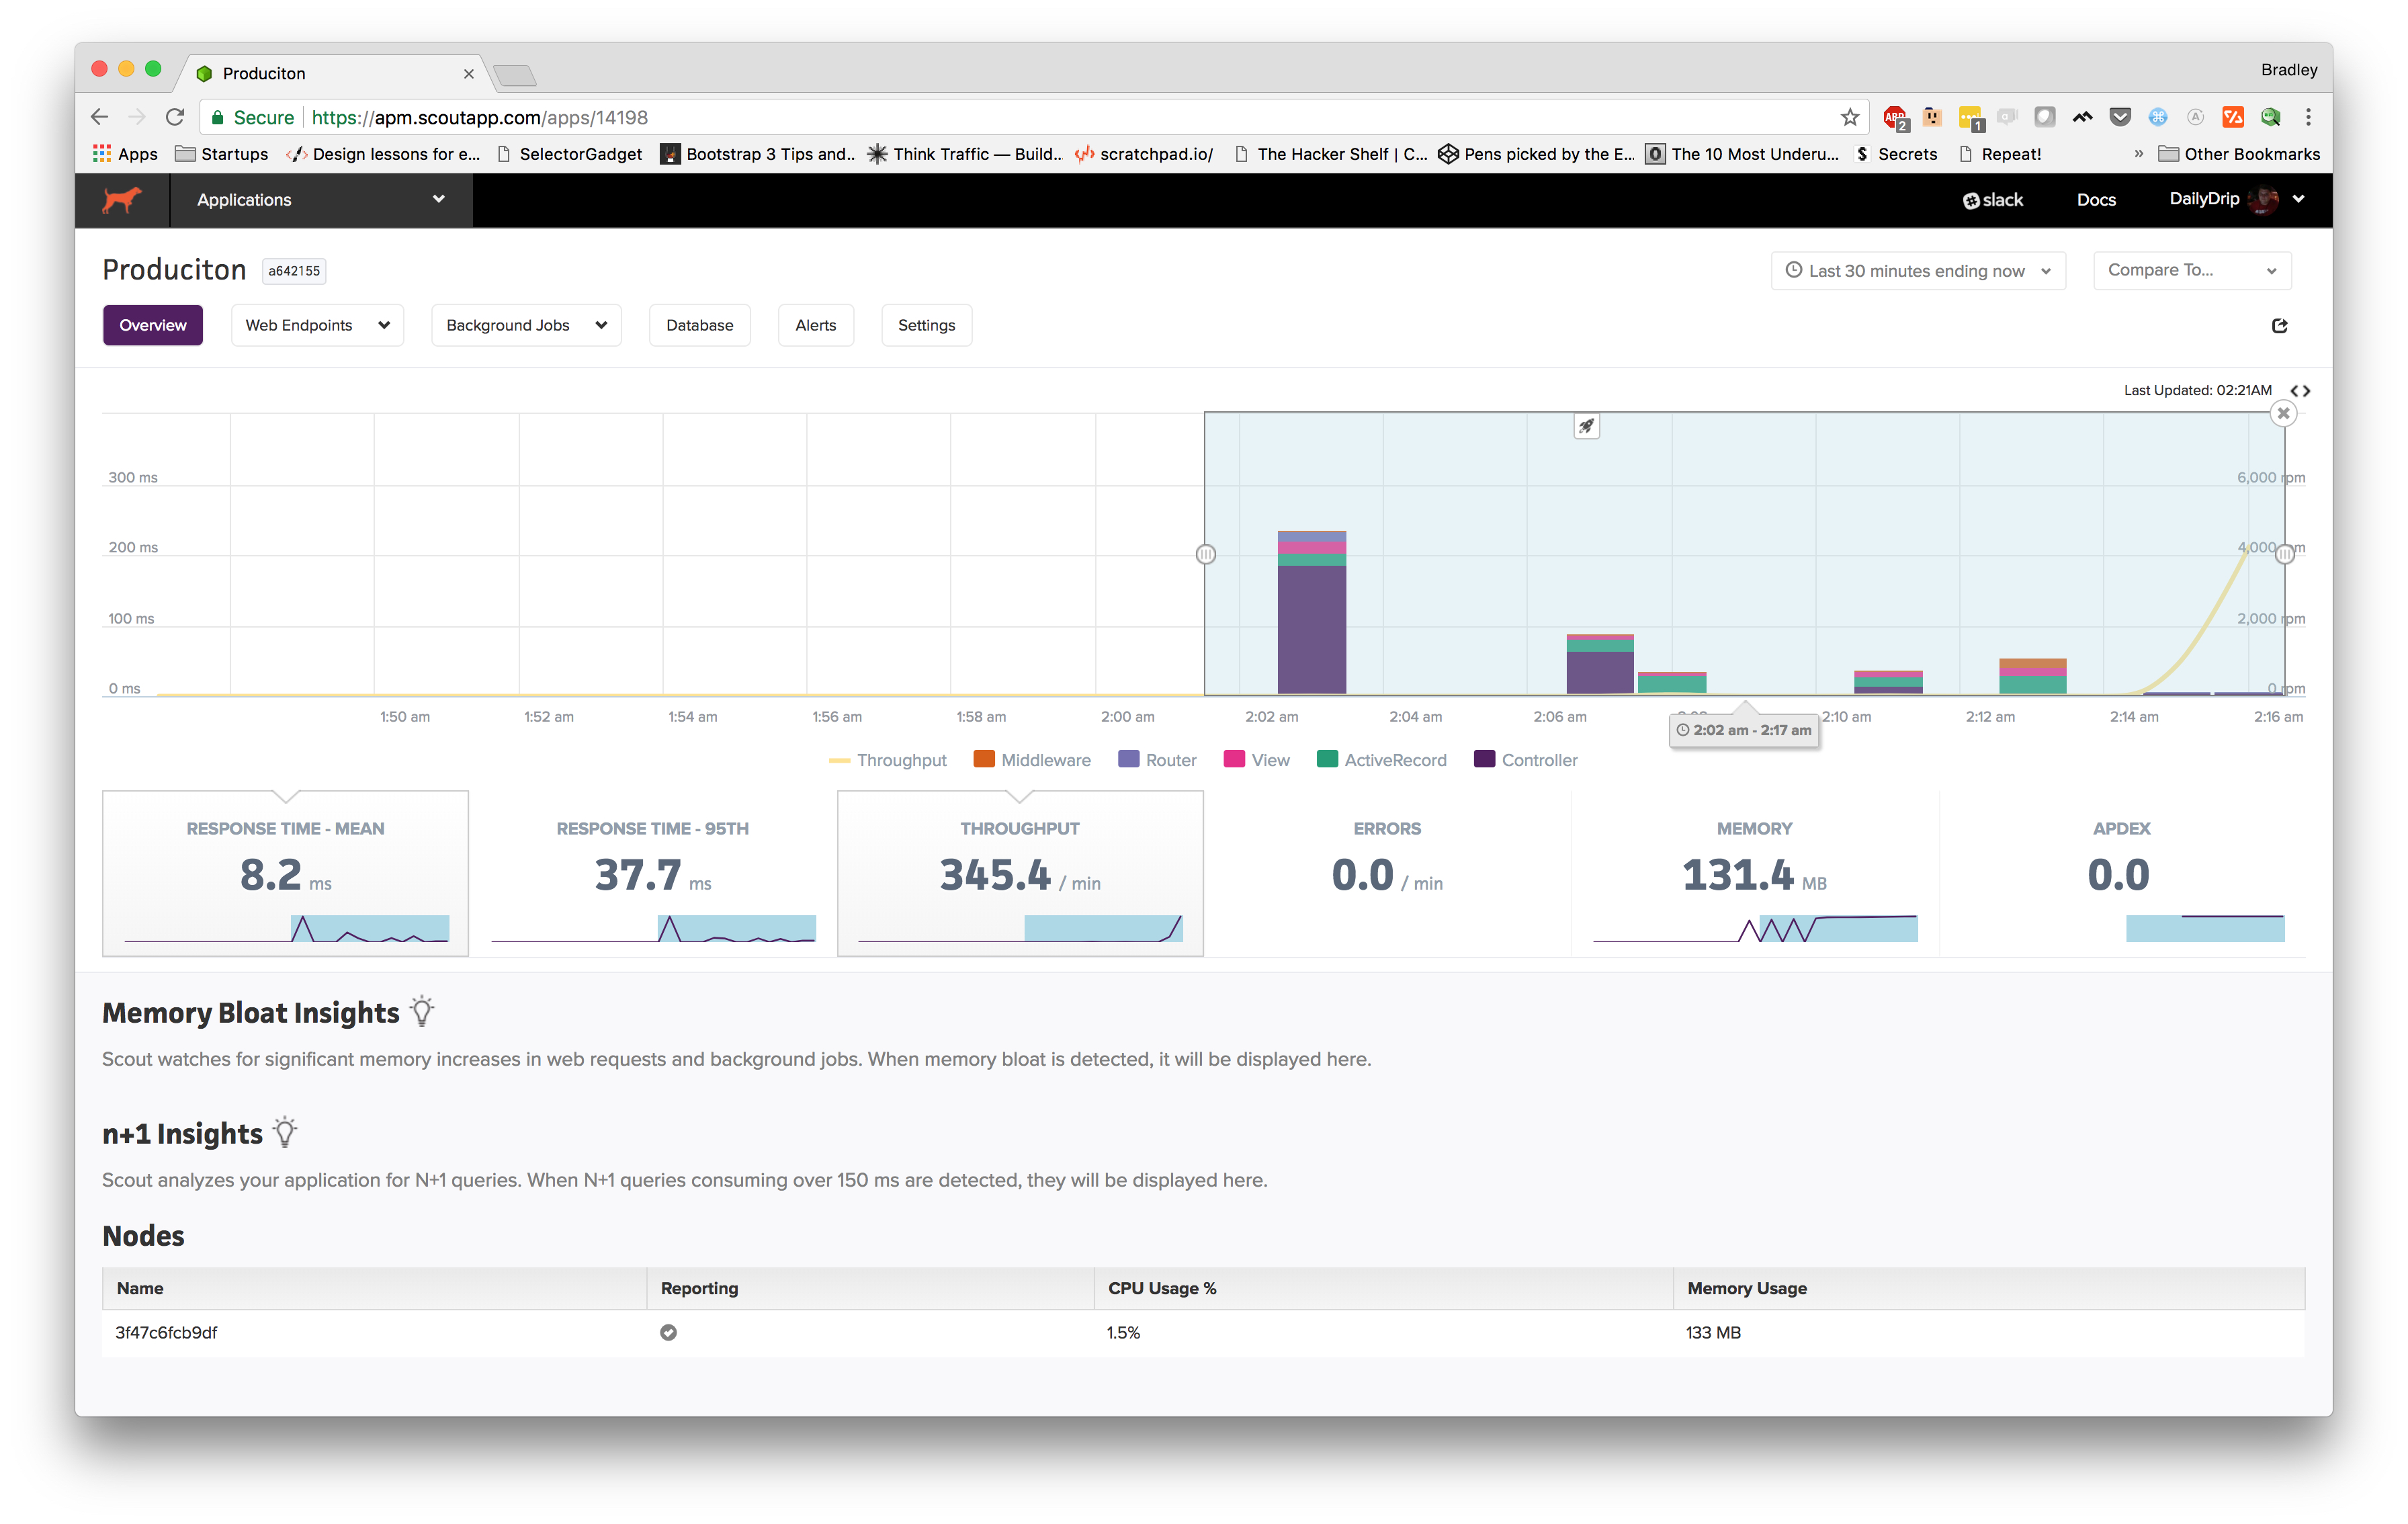
It looks like our traffic is showing up.
We can even notice some cool features right out of the gate. One of the first things I noticed is the little rocket signifying a new deploy. If you hover over the icon, it gives you the short git
At the bottom, we can see that it's showing the node from which we are gathering traffic and that it's currently reporting traffic and that we're barely using any of our CPU and only 133 MB of the 512 MB we've allotted to our container.
I used Apache Benchmark to send over some concurrent traffic, so toward the end of the graph, we can see throughput (yellow line) spike up to around 4k request per minute.
Also, you can see that I've highlighted a portion of the graph, and the metrics below it are showing the metrics for that time frame. From
Let's look at a few other screenshots:
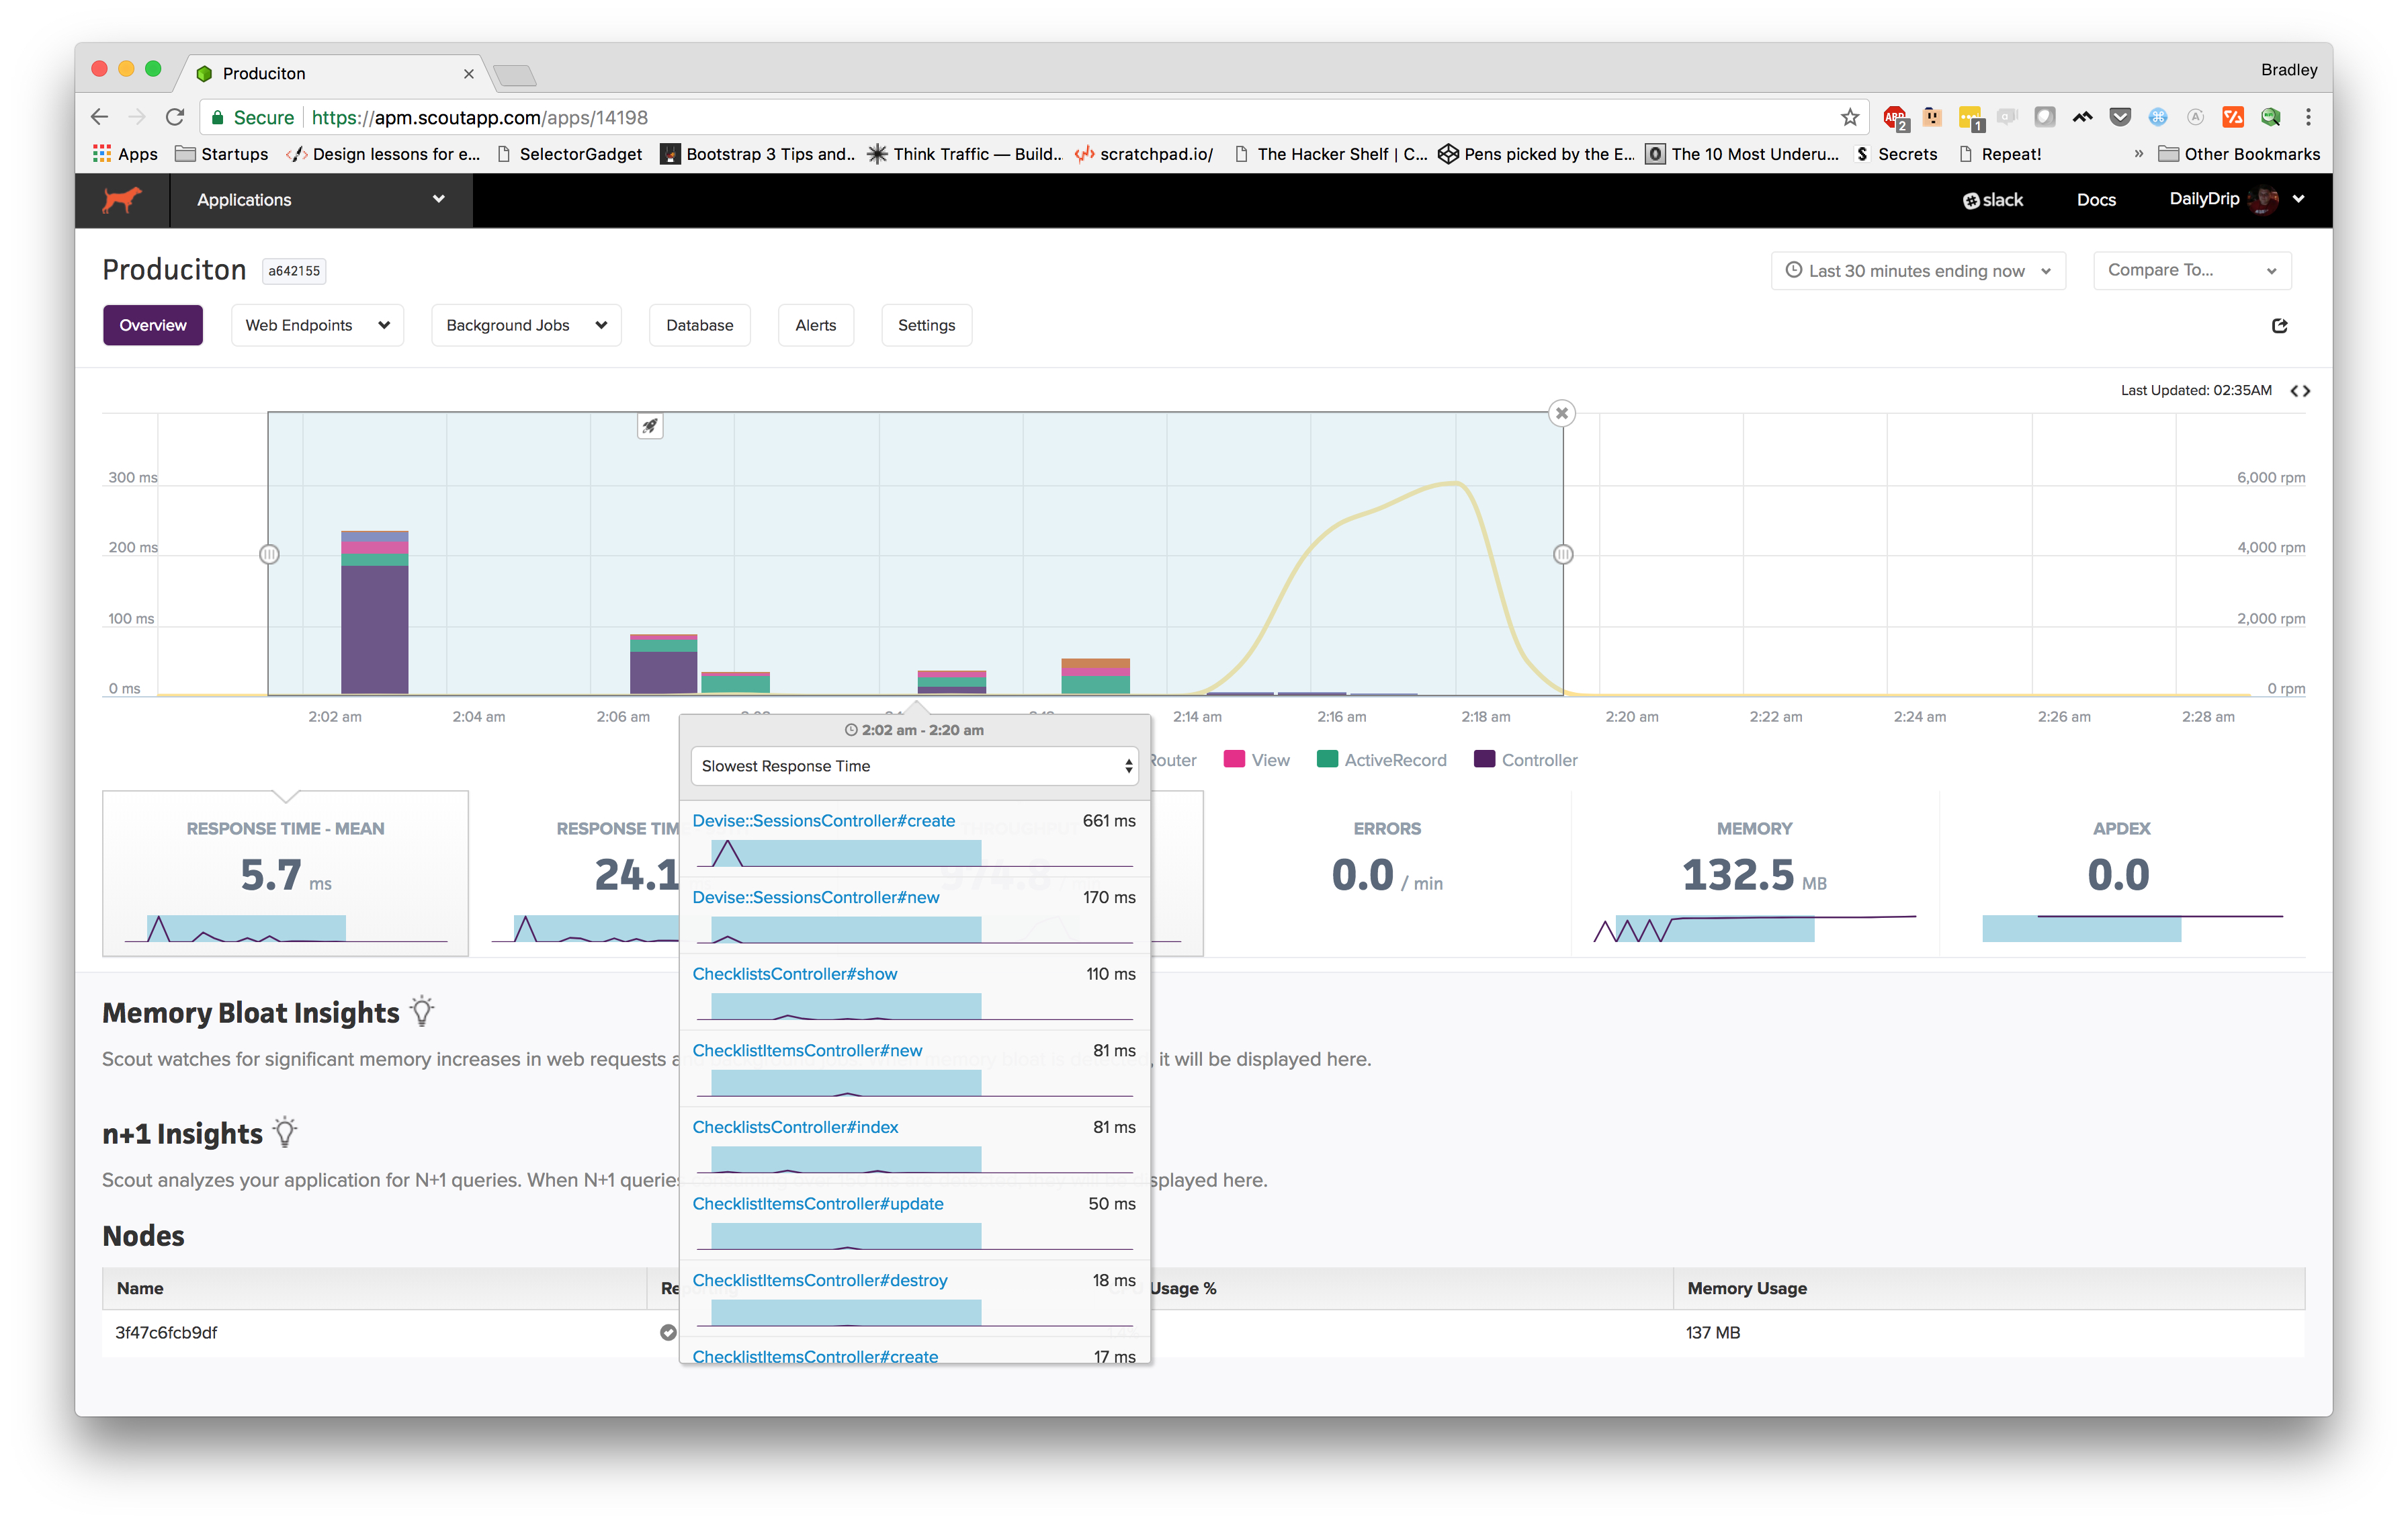
When you highlight a timeframe, this modal pops up allowing you to see controller actions that are taking the longest. Our app is extremely basic at the moment, so it makes sense that

However, if we click on the dropdown, we can choose "Largest Memory Increase", so with a simple click we can now see what actions are causing us the most memory, which would allow us to easily pinpoint subpar code.
Scout enables you to
- throughput is greater than 2000 request per minute for more than 5 minutes.
- errors
is greater than 5 per minute for more than 5 minutes. apdex is less than .9 for 15 minutes
Scout also enables background job monitoring and database monitoring. Which are definitely features that you'd want if you were running a production
Summary
In this video, we
Resources
Subscribe for more
We wrap up our series on the 2018 approach to deploying to AWS in our next post. We'll cover those final production hurdles: setting up a CDN with CloudFront, SSL via LetsEncrypt, load balancing, and more.


